Immigrants from Switzerland vs Moroccan Single Female Poverty
COMPARE
Immigrants from Switzerland
Moroccan
Single Female Poverty
Single Female Poverty Comparison
Immigrants from Switzerland
Moroccans
20.0%
SINGLE FEMALE POVERTY
95.1/ 100
METRIC RATING
121st/ 347
METRIC RANK
21.0%
SINGLE FEMALE POVERTY
52.8/ 100
METRIC RATING
171st/ 347
METRIC RANK
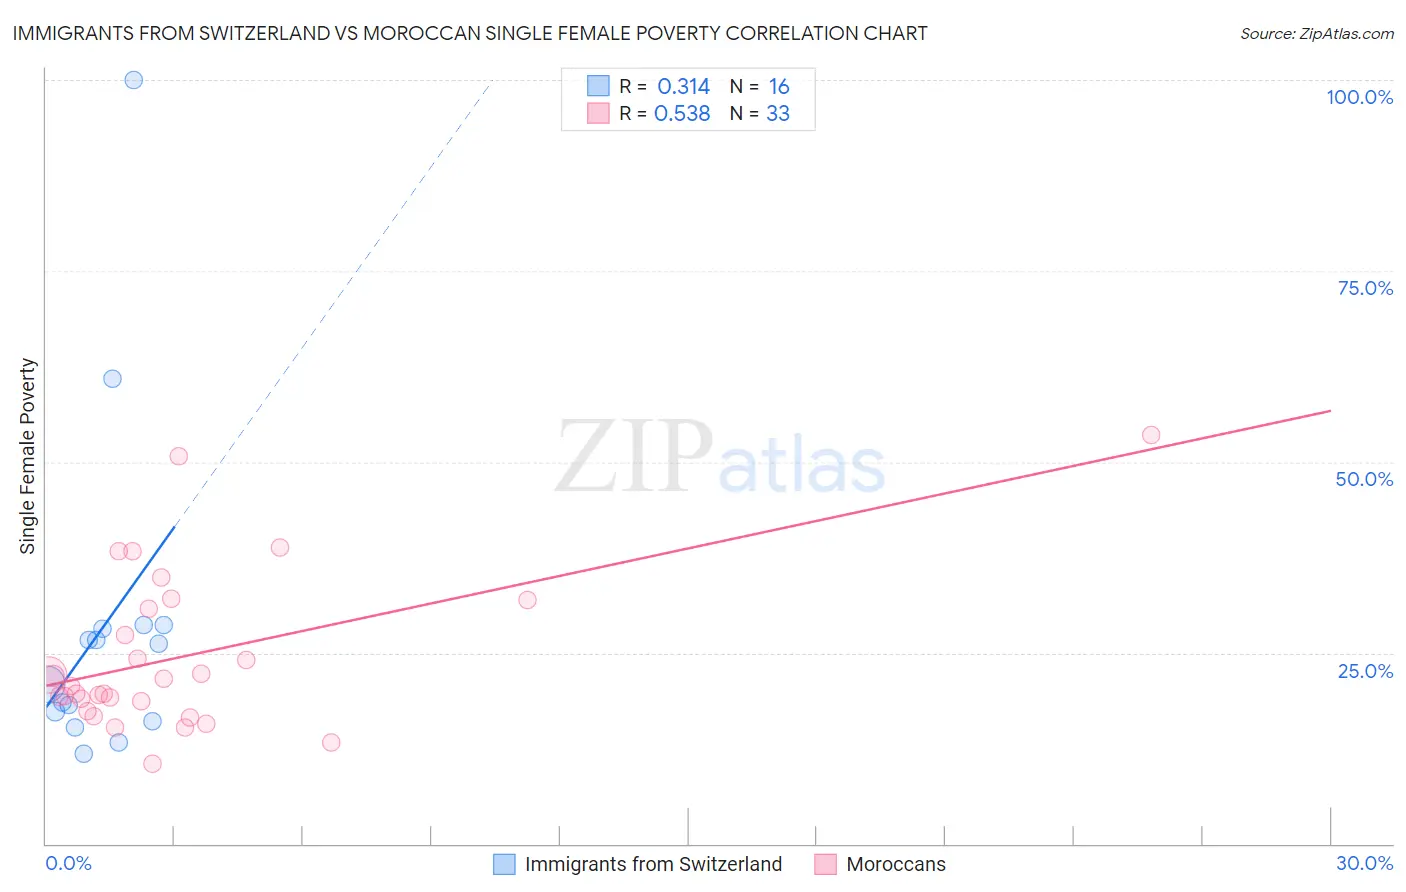
Immigrants from Switzerland vs Moroccan Single Female Poverty Correlation Chart
The statistical analysis conducted on geographies consisting of 146,751,859 people shows a mild positive correlation between the proportion of Immigrants from Switzerland and poverty level among single females in the United States with a correlation coefficient (R) of 0.314 and weighted average of 20.0%. Similarly, the statistical analysis conducted on geographies consisting of 200,405,308 people shows a substantial positive correlation between the proportion of Moroccans and poverty level among single females in the United States with a correlation coefficient (R) of 0.538 and weighted average of 21.0%, a difference of 4.6%.
Single Female Poverty Correlation Summary
| Measurement | Immigrants from Switzerland | Moroccan |
| Minimum | 11.7% | 10.5% |
| Maximum | 100.0% | 53.5% |
| Range | 88.3% | 43.0% |
| Mean | 28.5% | 24.5% |
| Median | 23.5% | 20.6% |
| Interquartile 25% (IQ1) | 16.6% | 18.0% |
| Interquartile 75% (IQ3) | 28.3% | 31.3% |
| Interquartile Range (IQR) | 11.7% | 13.4% |
| Standard Deviation (Sample) | 22.2% | 10.3% |
| Standard Deviation (Population) | 21.5% | 10.1% |
Similar Demographics by Single Female Poverty
Demographics Similar to Immigrants from Switzerland by Single Female Poverty
In terms of single female poverty, the demographic groups most similar to Immigrants from Switzerland are South American (20.0%, a difference of 0.030%), Immigrants from South America (20.0%, a difference of 0.030%), Immigrants from Afghanistan (20.0%, a difference of 0.13%), Immigrants from Ethiopia (20.0%, a difference of 0.13%), and Polish (20.0%, a difference of 0.20%).
| Demographics | Rating | Rank | Single Female Poverty |
| Immigrants | Colombia | 95.9 /100 | #114 | Exceptional 20.0% |
| Immigrants | Northern Africa | 95.8 /100 | #115 | Exceptional 20.0% |
| Immigrants | Kazakhstan | 95.7 /100 | #116 | Exceptional 20.0% |
| Poles | 95.6 /100 | #117 | Exceptional 20.0% |
| Immigrants | Afghanistan | 95.4 /100 | #118 | Exceptional 20.0% |
| Immigrants | Ethiopia | 95.4 /100 | #119 | Exceptional 20.0% |
| South Americans | 95.1 /100 | #120 | Exceptional 20.0% |
| Immigrants | Switzerland | 95.1 /100 | #121 | Exceptional 20.0% |
| Immigrants | South America | 95.0 /100 | #122 | Exceptional 20.0% |
| Brazilians | 94.4 /100 | #123 | Exceptional 20.1% |
| Immigrants | Chile | 94.3 /100 | #124 | Exceptional 20.1% |
| Immigrants | South Africa | 93.9 /100 | #125 | Exceptional 20.1% |
| Serbians | 93.3 /100 | #126 | Exceptional 20.1% |
| Mongolians | 93.2 /100 | #127 | Exceptional 20.2% |
| Immigrants | Spain | 92.7 /100 | #128 | Exceptional 20.2% |
Demographics Similar to Moroccans by Single Female Poverty
In terms of single female poverty, the demographic groups most similar to Moroccans are New Zealander (21.0%, a difference of 0.020%), Guyanese (21.0%, a difference of 0.050%), Immigrants from Guyana (21.0%, a difference of 0.14%), Cuban (21.0%, a difference of 0.17%), and Immigrants from Trinidad and Tobago (20.9%, a difference of 0.22%).
| Demographics | Rating | Rank | Single Female Poverty |
| Iraqis | 64.5 /100 | #164 | Good 20.8% |
| Ugandans | 64.0 /100 | #165 | Good 20.8% |
| Norwegians | 63.0 /100 | #166 | Good 20.8% |
| Immigrants | Norway | 63.0 /100 | #167 | Good 20.8% |
| Immigrants | Costa Rica | 61.5 /100 | #168 | Good 20.9% |
| Immigrants | Trinidad and Tobago | 56.3 /100 | #169 | Average 20.9% |
| New Zealanders | 53.2 /100 | #170 | Average 21.0% |
| Moroccans | 52.8 /100 | #171 | Average 21.0% |
| Guyanese | 52.0 /100 | #172 | Average 21.0% |
| Immigrants | Guyana | 50.6 /100 | #173 | Average 21.0% |
| Cubans | 50.0 /100 | #174 | Average 21.0% |
| Czechs | 46.8 /100 | #175 | Average 21.0% |
| Canadians | 45.4 /100 | #176 | Average 21.1% |
| Scandinavians | 45.2 /100 | #177 | Average 21.1% |
| Immigrants | Bosnia and Herzegovina | 44.9 /100 | #178 | Average 21.1% |