Immigrants from Ghana vs Moroccan Single Female Poverty
COMPARE
Immigrants from Ghana
Moroccan
Single Female Poverty
Single Female Poverty Comparison
Immigrants from Ghana
Moroccans
21.9%
SINGLE FEMALE POVERTY
5.8/ 100
METRIC RATING
227th/ 347
METRIC RANK
21.0%
SINGLE FEMALE POVERTY
52.8/ 100
METRIC RATING
171st/ 347
METRIC RANK
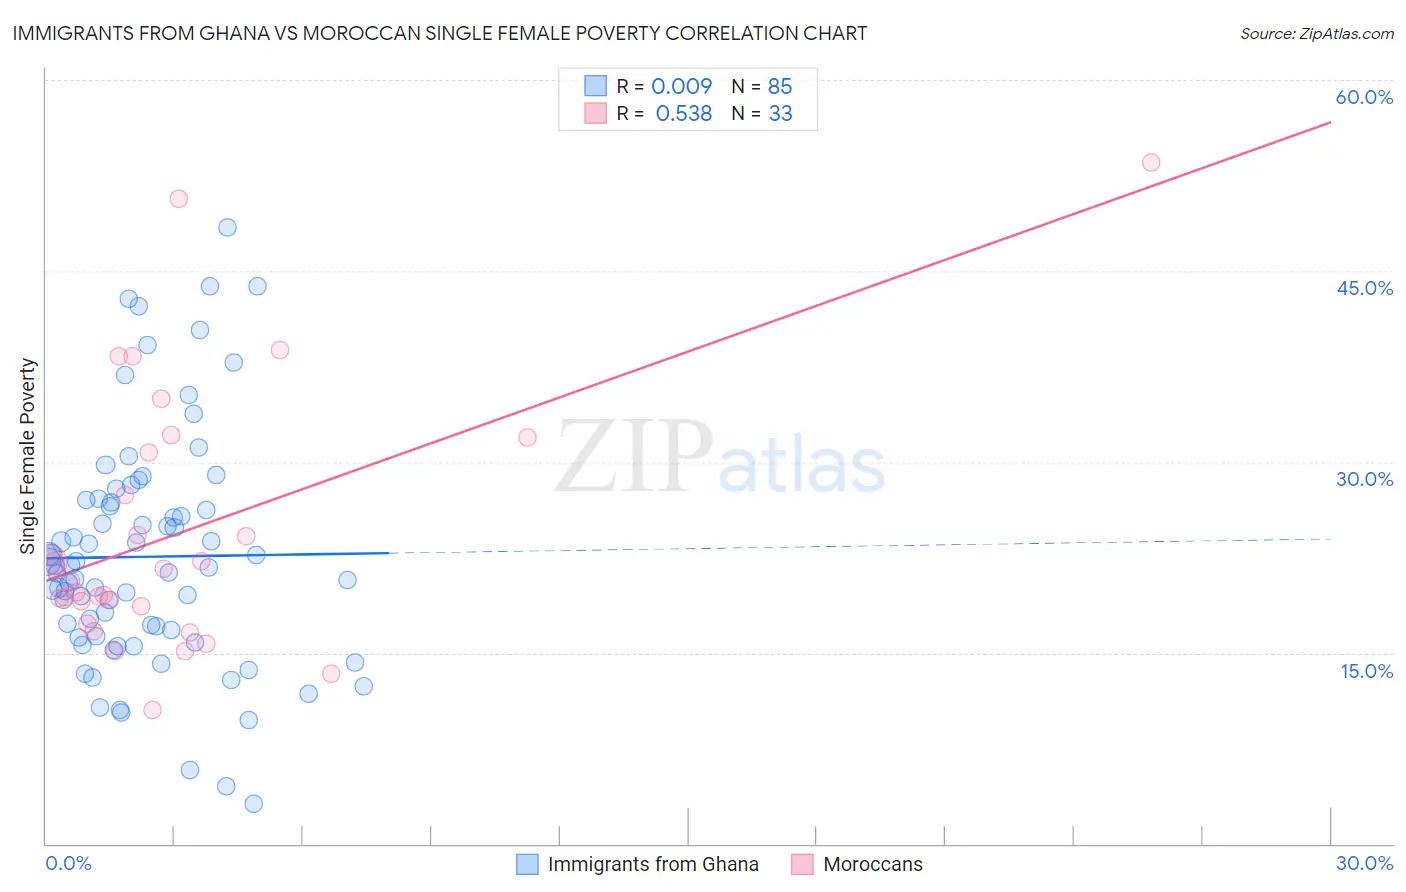
Immigrants from Ghana vs Moroccan Single Female Poverty Correlation Chart
The statistical analysis conducted on geographies consisting of 198,608,893 people shows no correlation between the proportion of Immigrants from Ghana and poverty level among single females in the United States with a correlation coefficient (R) of 0.009 and weighted average of 21.9%. Similarly, the statistical analysis conducted on geographies consisting of 200,405,308 people shows a substantial positive correlation between the proportion of Moroccans and poverty level among single females in the United States with a correlation coefficient (R) of 0.538 and weighted average of 21.0%, a difference of 4.5%.
Single Female Poverty Correlation Summary
| Measurement | Immigrants from Ghana | Moroccan |
| Minimum | 3.1% | 10.5% |
| Maximum | 48.4% | 53.5% |
| Range | 45.2% | 43.0% |
| Mean | 22.5% | 24.5% |
| Median | 21.7% | 20.6% |
| Interquartile 25% (IQ1) | 16.3% | 18.0% |
| Interquartile 75% (IQ3) | 26.9% | 31.3% |
| Interquartile Range (IQR) | 10.7% | 13.4% |
| Standard Deviation (Sample) | 9.2% | 10.3% |
| Standard Deviation (Population) | 9.1% | 10.1% |
Similar Demographics by Single Female Poverty
Demographics Similar to Immigrants from Ghana by Single Female Poverty
In terms of single female poverty, the demographic groups most similar to Immigrants from Ghana are Immigrants from Portugal (21.9%, a difference of 0.0%), Salvadoran (21.9%, a difference of 0.10%), Tlingit-Haida (21.9%, a difference of 0.12%), Immigrants from Western Africa (22.0%, a difference of 0.14%), and English (21.9%, a difference of 0.16%).
| Demographics | Rating | Rank | Single Female Poverty |
| Germans | 8.3 /100 | #220 | Tragic 21.8% |
| Immigrants | Grenada | 8.0 /100 | #221 | Tragic 21.8% |
| Immigrants | Eritrea | 7.9 /100 | #222 | Tragic 21.8% |
| Scottish | 7.3 /100 | #223 | Tragic 21.8% |
| Barbadians | 7.2 /100 | #224 | Tragic 21.8% |
| English | 6.4 /100 | #225 | Tragic 21.9% |
| Immigrants | Portugal | 5.8 /100 | #226 | Tragic 21.9% |
| Immigrants | Ghana | 5.8 /100 | #227 | Tragic 21.9% |
| Salvadorans | 5.5 /100 | #228 | Tragic 21.9% |
| Tlingit-Haida | 5.4 /100 | #229 | Tragic 21.9% |
| Immigrants | Western Africa | 5.3 /100 | #230 | Tragic 22.0% |
| Welsh | 5.0 /100 | #231 | Tragic 22.0% |
| Immigrants | Thailand | 5.0 /100 | #232 | Tragic 22.0% |
| Spaniards | 4.7 /100 | #233 | Tragic 22.0% |
| Spanish | 4.7 /100 | #234 | Tragic 22.0% |
Demographics Similar to Moroccans by Single Female Poverty
In terms of single female poverty, the demographic groups most similar to Moroccans are New Zealander (21.0%, a difference of 0.020%), Guyanese (21.0%, a difference of 0.050%), Immigrants from Guyana (21.0%, a difference of 0.14%), Cuban (21.0%, a difference of 0.17%), and Immigrants from Trinidad and Tobago (20.9%, a difference of 0.22%).
| Demographics | Rating | Rank | Single Female Poverty |
| Iraqis | 64.5 /100 | #164 | Good 20.8% |
| Ugandans | 64.0 /100 | #165 | Good 20.8% |
| Norwegians | 63.0 /100 | #166 | Good 20.8% |
| Immigrants | Norway | 63.0 /100 | #167 | Good 20.8% |
| Immigrants | Costa Rica | 61.5 /100 | #168 | Good 20.9% |
| Immigrants | Trinidad and Tobago | 56.3 /100 | #169 | Average 20.9% |
| New Zealanders | 53.2 /100 | #170 | Average 21.0% |
| Moroccans | 52.8 /100 | #171 | Average 21.0% |
| Guyanese | 52.0 /100 | #172 | Average 21.0% |
| Immigrants | Guyana | 50.6 /100 | #173 | Average 21.0% |
| Cubans | 50.0 /100 | #174 | Average 21.0% |
| Czechs | 46.8 /100 | #175 | Average 21.0% |
| Canadians | 45.4 /100 | #176 | Average 21.1% |
| Scandinavians | 45.2 /100 | #177 | Average 21.1% |
| Immigrants | Bosnia and Herzegovina | 44.9 /100 | #178 | Average 21.1% |