Chickasaw vs Moroccan Unemployment Among Ages 65 to 74 years
COMPARE
Chickasaw
Moroccan
Unemployment Among Ages 65 to 74 years
Unemployment Among Ages 65 to 74 years Comparison
Chickasaw
Moroccans
4.7%
UNEMPLOYMENT AMONG AGES 65 TO 74 YEARS
100.0/ 100
METRIC RATING
9th/ 347
METRIC RANK
5.7%
UNEMPLOYMENT AMONG AGES 65 TO 74 YEARS
0.1/ 100
METRIC RATING
280th/ 347
METRIC RANK
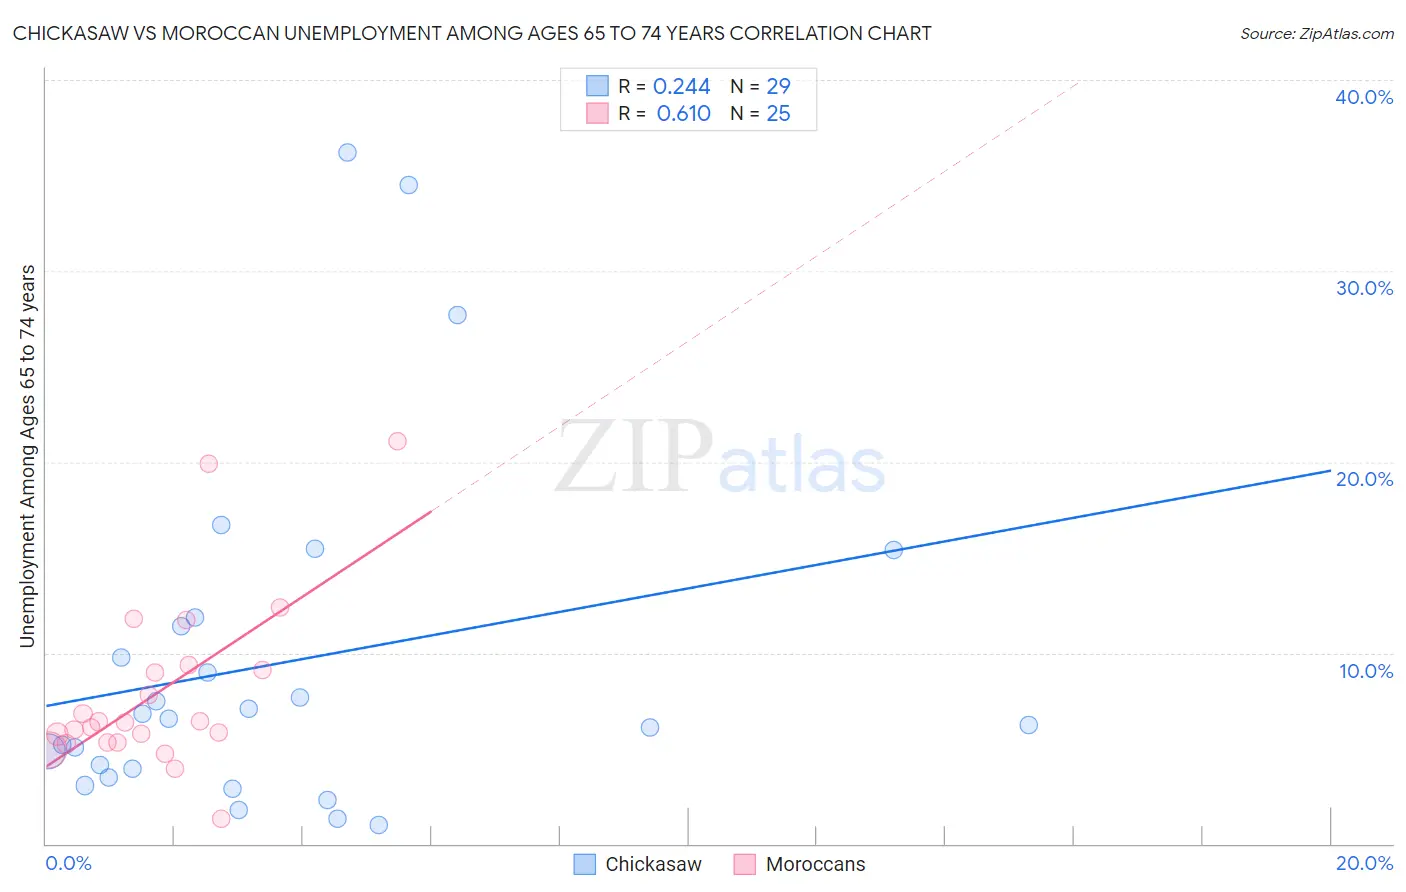
Chickasaw vs Moroccan Unemployment Among Ages 65 to 74 years Correlation Chart
The statistical analysis conducted on geographies consisting of 136,812,598 people shows a weak positive correlation between the proportion of Chickasaw and unemployment rate among population between the ages 65 and 74 in the United States with a correlation coefficient (R) of 0.244 and weighted average of 4.7%. Similarly, the statistical analysis conducted on geographies consisting of 188,925,696 people shows a significant positive correlation between the proportion of Moroccans and unemployment rate among population between the ages 65 and 74 in the United States with a correlation coefficient (R) of 0.610 and weighted average of 5.7%, a difference of 20.7%.
Unemployment Among Ages 65 to 74 years Correlation Summary
| Measurement | Chickasaw | Moroccan |
| Minimum | 0.98% | 1.3% |
| Maximum | 36.2% | 21.1% |
| Range | 35.2% | 19.8% |
| Mean | 9.5% | 7.9% |
| Median | 6.6% | 6.3% |
| Interquartile 25% (IQ1) | 3.7% | 5.3% |
| Interquartile 75% (IQ3) | 11.6% | 9.2% |
| Interquartile Range (IQR) | 7.9% | 3.9% |
| Standard Deviation (Sample) | 9.1% | 4.6% |
| Standard Deviation (Population) | 9.0% | 4.5% |
Similar Demographics by Unemployment Among Ages 65 to 74 years
Demographics Similar to Chickasaw by Unemployment Among Ages 65 to 74 years
In terms of unemployment among ages 65 to 74 years, the demographic groups most similar to Chickasaw are Osage (4.7%, a difference of 0.11%), Comanche (4.7%, a difference of 0.26%), Indonesian (4.7%, a difference of 0.43%), Immigrants from Congo (4.7%, a difference of 0.52%), and Tongan (4.7%, a difference of 0.68%).
| Demographics | Rating | Rank | Unemployment Among Ages 65 to 74 years |
| Chinese | 100.0 /100 | #2 | Exceptional 4.4% |
| Fijians | 100.0 /100 | #3 | Exceptional 4.5% |
| Tsimshian | 100.0 /100 | #4 | Exceptional 4.6% |
| Sudanese | 100.0 /100 | #5 | Exceptional 4.6% |
| Immigrants | Cuba | 100.0 /100 | #6 | Exceptional 4.6% |
| Indonesians | 100.0 /100 | #7 | Exceptional 4.7% |
| Comanche | 100.0 /100 | #8 | Exceptional 4.7% |
| Chickasaw | 100.0 /100 | #9 | Exceptional 4.7% |
| Osage | 100.0 /100 | #10 | Exceptional 4.7% |
| Immigrants | Congo | 100.0 /100 | #11 | Exceptional 4.7% |
| Tongans | 100.0 /100 | #12 | Exceptional 4.7% |
| Lumbee | 100.0 /100 | #13 | Exceptional 4.8% |
| Cubans | 100.0 /100 | #14 | Exceptional 4.8% |
| Immigrants | North Macedonia | 100.0 /100 | #15 | Exceptional 4.8% |
| Immigrants | Burma/Myanmar | 100.0 /100 | #16 | Exceptional 4.8% |
Demographics Similar to Moroccans by Unemployment Among Ages 65 to 74 years
In terms of unemployment among ages 65 to 74 years, the demographic groups most similar to Moroccans are Immigrants from Norway (5.7%, a difference of 0.0%), Immigrants from West Indies (5.7%, a difference of 0.080%), Ottawa (5.7%, a difference of 0.12%), Mexican American Indian (5.7%, a difference of 0.16%), and Cypriot (5.7%, a difference of 0.16%).
| Demographics | Rating | Rank | Unemployment Among Ages 65 to 74 years |
| Bahamians | 0.1 /100 | #273 | Tragic 5.7% |
| Immigrants | Guyana | 0.1 /100 | #274 | Tragic 5.7% |
| Immigrants | Liberia | 0.1 /100 | #275 | Tragic 5.7% |
| Somalis | 0.1 /100 | #276 | Tragic 5.7% |
| Immigrants | South America | 0.1 /100 | #277 | Tragic 5.7% |
| Mexican American Indians | 0.1 /100 | #278 | Tragic 5.7% |
| Immigrants | Norway | 0.1 /100 | #279 | Tragic 5.7% |
| Moroccans | 0.1 /100 | #280 | Tragic 5.7% |
| Immigrants | West Indies | 0.1 /100 | #281 | Tragic 5.7% |
| Ottawa | 0.1 /100 | #282 | Tragic 5.7% |
| Cypriots | 0.1 /100 | #283 | Tragic 5.7% |
| Chippewa | 0.1 /100 | #284 | Tragic 5.7% |
| Immigrants | Sierra Leone | 0.1 /100 | #285 | Tragic 5.7% |
| Marshallese | 0.1 /100 | #286 | Tragic 5.7% |
| Central American Indians | 0.0 /100 | #287 | Tragic 5.7% |