Asian vs Moroccan Single Female Poverty
COMPARE
Asian
Moroccan
Single Female Poverty
Single Female Poverty Comparison
Asians
Moroccans
18.3%
SINGLE FEMALE POVERTY
100.0/ 100
METRIC RATING
23rd/ 347
METRIC RANK
21.0%
SINGLE FEMALE POVERTY
52.8/ 100
METRIC RATING
171st/ 347
METRIC RANK
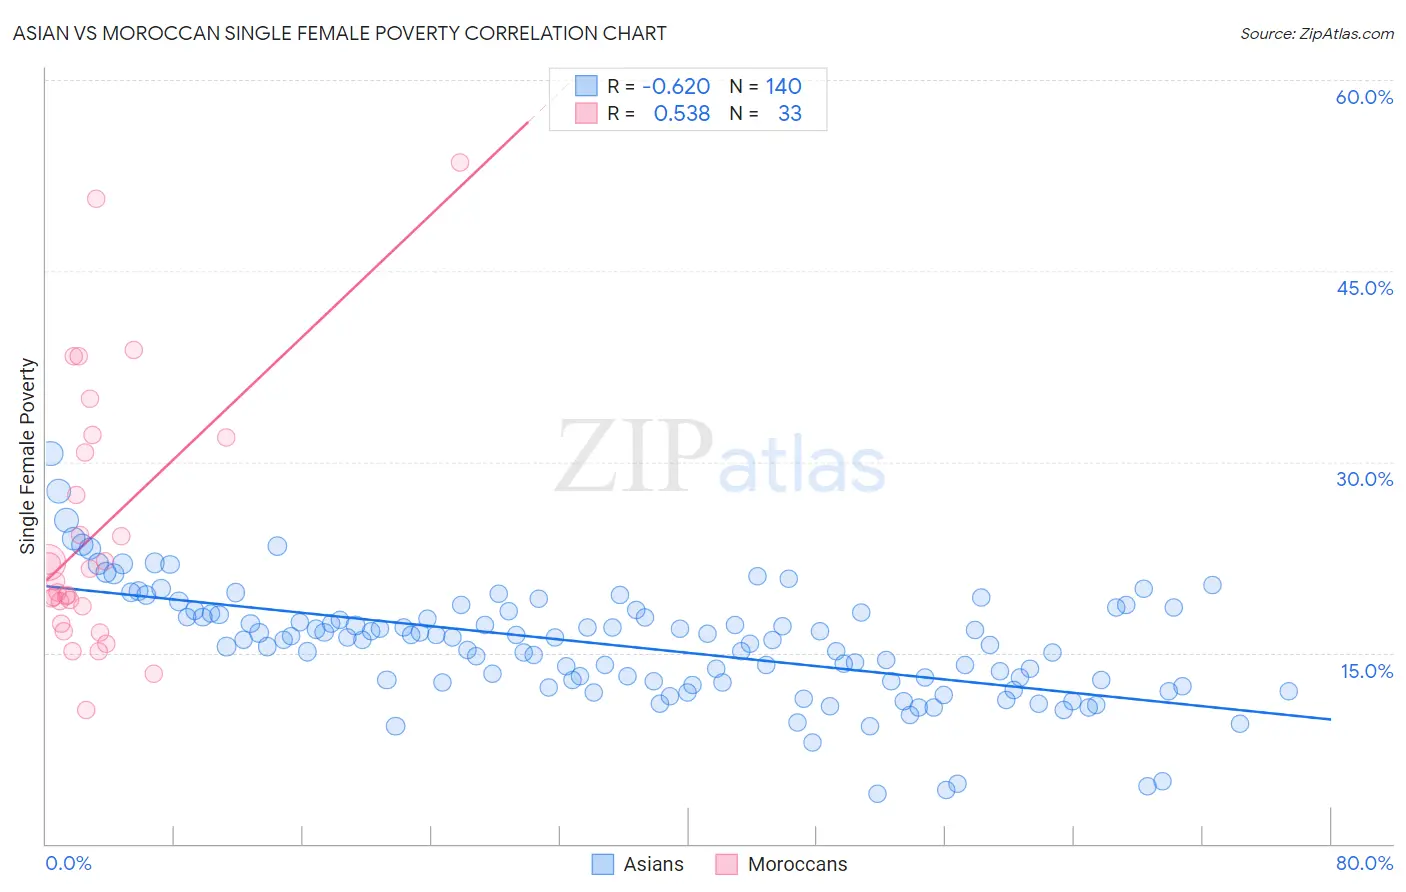
Asian vs Moroccan Single Female Poverty Correlation Chart
The statistical analysis conducted on geographies consisting of 534,134,882 people shows a significant negative correlation between the proportion of Asians and poverty level among single females in the United States with a correlation coefficient (R) of -0.620 and weighted average of 18.3%. Similarly, the statistical analysis conducted on geographies consisting of 200,405,308 people shows a substantial positive correlation between the proportion of Moroccans and poverty level among single females in the United States with a correlation coefficient (R) of 0.538 and weighted average of 21.0%, a difference of 14.7%.
Single Female Poverty Correlation Summary
| Measurement | Asian | Moroccan |
| Minimum | 3.9% | 10.5% |
| Maximum | 30.6% | 53.5% |
| Range | 26.7% | 43.0% |
| Mean | 15.6% | 24.5% |
| Median | 16.0% | 20.6% |
| Interquartile 25% (IQ1) | 12.7% | 18.0% |
| Interquartile 75% (IQ3) | 18.1% | 31.3% |
| Interquartile Range (IQR) | 5.4% | 13.4% |
| Standard Deviation (Sample) | 4.4% | 10.3% |
| Standard Deviation (Population) | 4.4% | 10.1% |
Similar Demographics by Single Female Poverty
Demographics Similar to Asians by Single Female Poverty
In terms of single female poverty, the demographic groups most similar to Asians are Burmese (18.3%, a difference of 0.0%), Maltese (18.3%, a difference of 0.020%), Immigrants from Greece (18.3%, a difference of 0.070%), Armenian (18.3%, a difference of 0.23%), and Immigrants from Singapore (18.3%, a difference of 0.33%).
| Demographics | Rating | Rank | Single Female Poverty |
| Iranians | 100.0 /100 | #16 | Exceptional 18.0% |
| Immigrants | Korea | 100.0 /100 | #17 | Exceptional 18.1% |
| Immigrants | Eastern Asia | 100.0 /100 | #18 | Exceptional 18.1% |
| Immigrants | China | 100.0 /100 | #19 | Exceptional 18.1% |
| Immigrants | Greece | 100.0 /100 | #20 | Exceptional 18.3% |
| Maltese | 100.0 /100 | #21 | Exceptional 18.3% |
| Burmese | 100.0 /100 | #22 | Exceptional 18.3% |
| Asians | 100.0 /100 | #23 | Exceptional 18.3% |
| Armenians | 100.0 /100 | #24 | Exceptional 18.3% |
| Immigrants | Singapore | 100.0 /100 | #25 | Exceptional 18.3% |
| Immigrants | Israel | 100.0 /100 | #26 | Exceptional 18.3% |
| Immigrants | Pakistan | 100.0 /100 | #27 | Exceptional 18.4% |
| Immigrants | Moldova | 100.0 /100 | #28 | Exceptional 18.5% |
| Immigrants | Poland | 100.0 /100 | #29 | Exceptional 18.5% |
| Immigrants | North Macedonia | 99.9 /100 | #30 | Exceptional 18.5% |
Demographics Similar to Moroccans by Single Female Poverty
In terms of single female poverty, the demographic groups most similar to Moroccans are New Zealander (21.0%, a difference of 0.020%), Guyanese (21.0%, a difference of 0.050%), Immigrants from Guyana (21.0%, a difference of 0.14%), Cuban (21.0%, a difference of 0.17%), and Immigrants from Trinidad and Tobago (20.9%, a difference of 0.22%).
| Demographics | Rating | Rank | Single Female Poverty |
| Iraqis | 64.5 /100 | #164 | Good 20.8% |
| Ugandans | 64.0 /100 | #165 | Good 20.8% |
| Norwegians | 63.0 /100 | #166 | Good 20.8% |
| Immigrants | Norway | 63.0 /100 | #167 | Good 20.8% |
| Immigrants | Costa Rica | 61.5 /100 | #168 | Good 20.9% |
| Immigrants | Trinidad and Tobago | 56.3 /100 | #169 | Average 20.9% |
| New Zealanders | 53.2 /100 | #170 | Average 21.0% |
| Moroccans | 52.8 /100 | #171 | Average 21.0% |
| Guyanese | 52.0 /100 | #172 | Average 21.0% |
| Immigrants | Guyana | 50.6 /100 | #173 | Average 21.0% |
| Cubans | 50.0 /100 | #174 | Average 21.0% |
| Czechs | 46.8 /100 | #175 | Average 21.0% |
| Canadians | 45.4 /100 | #176 | Average 21.1% |
| Scandinavians | 45.2 /100 | #177 | Average 21.1% |
| Immigrants | Bosnia and Herzegovina | 44.9 /100 | #178 | Average 21.1% |