Afghan vs Chickasaw Single Female Poverty
COMPARE
Afghan
Chickasaw
Single Female Poverty
Single Female Poverty Comparison
Afghans
Chickasaw
19.5%
SINGLE FEMALE POVERTY
99.0/ 100
METRIC RATING
88th/ 347
METRIC RANK
26.3%
SINGLE FEMALE POVERTY
0.0/ 100
METRIC RATING
318th/ 347
METRIC RANK
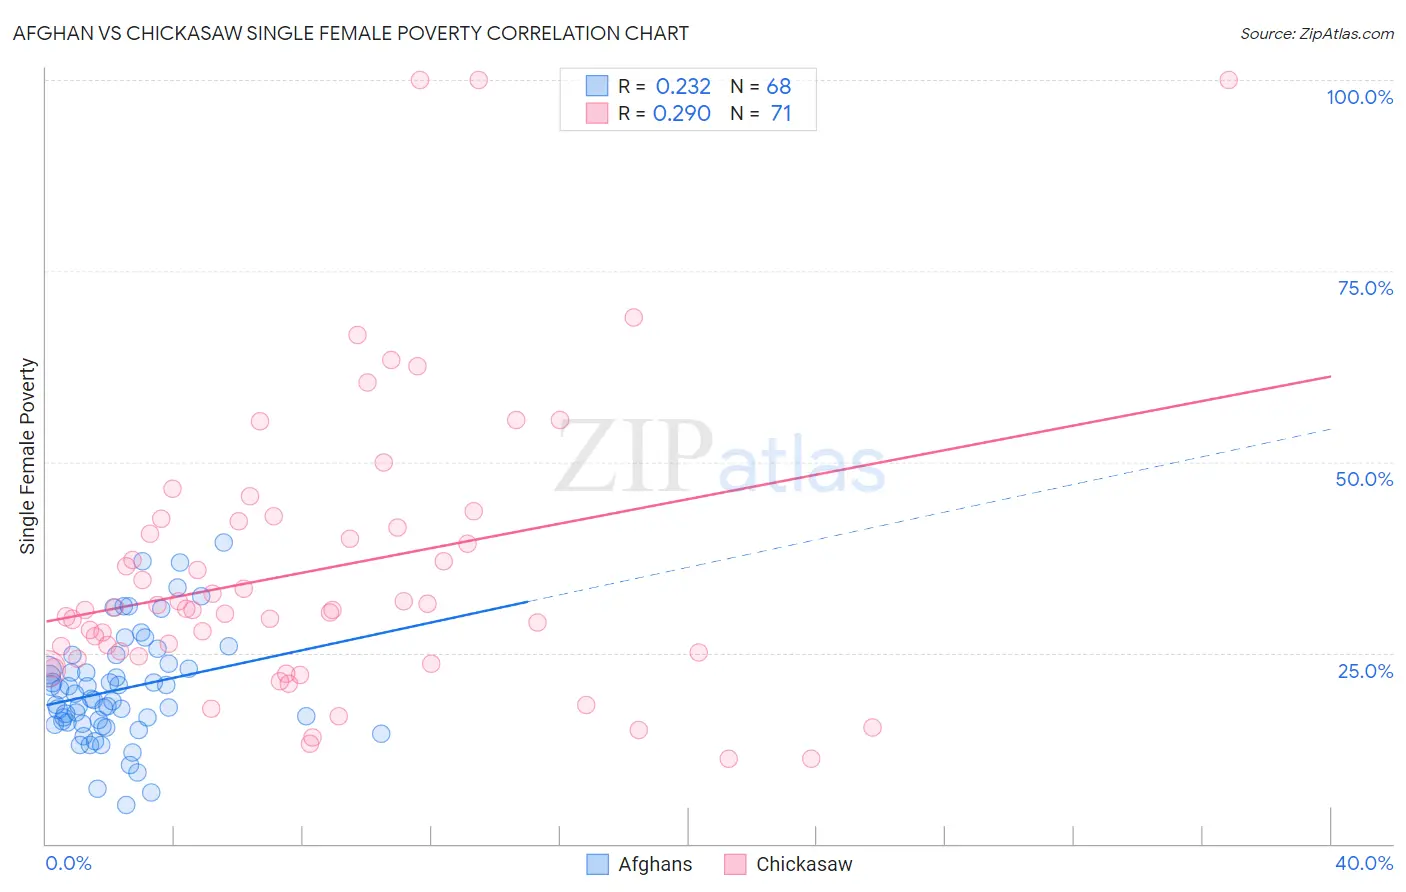
Afghan vs Chickasaw Single Female Poverty Correlation Chart
The statistical analysis conducted on geographies consisting of 148,055,541 people shows a weak positive correlation between the proportion of Afghans and poverty level among single females in the United States with a correlation coefficient (R) of 0.232 and weighted average of 19.5%. Similarly, the statistical analysis conducted on geographies consisting of 147,052,400 people shows a weak positive correlation between the proportion of Chickasaw and poverty level among single females in the United States with a correlation coefficient (R) of 0.290 and weighted average of 26.3%, a difference of 34.6%.
Single Female Poverty Correlation Summary
| Measurement | Afghan | Chickasaw |
| Minimum | 5.1% | 11.1% |
| Maximum | 39.5% | 100.0% |
| Range | 34.4% | 88.9% |
| Mean | 20.2% | 35.8% |
| Median | 18.9% | 30.6% |
| Interquartile 25% (IQ1) | 15.9% | 24.5% |
| Interquartile 75% (IQ3) | 23.2% | 42.2% |
| Interquartile Range (IQR) | 7.4% | 17.7% |
| Standard Deviation (Sample) | 7.1% | 19.0% |
| Standard Deviation (Population) | 7.1% | 18.8% |
Similar Demographics by Single Female Poverty
Demographics Similar to Afghans by Single Female Poverty
In terms of single female poverty, the demographic groups most similar to Afghans are Immigrants from Ukraine (19.5%, a difference of 0.010%), Zimbabwean (19.5%, a difference of 0.020%), Immigrants from Lebanon (19.6%, a difference of 0.19%), Soviet Union (19.6%, a difference of 0.25%), and Italian (19.6%, a difference of 0.30%).
| Demographics | Rating | Rank | Single Female Poverty |
| Immigrants | Scotland | 99.2 /100 | #81 | Exceptional 19.4% |
| Immigrants | Malaysia | 99.2 /100 | #82 | Exceptional 19.4% |
| Taiwanese | 99.2 /100 | #83 | Exceptional 19.4% |
| Immigrants | Sweden | 99.2 /100 | #84 | Exceptional 19.4% |
| Immigrants | Albania | 99.2 /100 | #85 | Exceptional 19.4% |
| Greeks | 99.2 /100 | #86 | Exceptional 19.4% |
| Zimbabweans | 99.0 /100 | #87 | Exceptional 19.5% |
| Afghans | 99.0 /100 | #88 | Exceptional 19.5% |
| Immigrants | Ukraine | 99.0 /100 | #89 | Exceptional 19.5% |
| Immigrants | Lebanon | 98.8 /100 | #90 | Exceptional 19.6% |
| Soviet Union | 98.8 /100 | #91 | Exceptional 19.6% |
| Italians | 98.8 /100 | #92 | Exceptional 19.6% |
| Immigrants | Austria | 98.8 /100 | #93 | Exceptional 19.6% |
| Romanians | 98.6 /100 | #94 | Exceptional 19.6% |
| Estonians | 98.2 /100 | #95 | Exceptional 19.7% |
Demographics Similar to Chickasaw by Single Female Poverty
In terms of single female poverty, the demographic groups most similar to Chickasaw are Black/African American (26.4%, a difference of 0.33%), Arapaho (26.4%, a difference of 0.63%), Ottawa (26.0%, a difference of 1.0%), Yup'ik (26.6%, a difference of 1.3%), and Immigrants from Somalia (25.8%, a difference of 1.9%).
| Demographics | Rating | Rank | Single Female Poverty |
| Immigrants | Honduras | 0.0 /100 | #311 | Tragic 25.5% |
| Paiute | 0.0 /100 | #312 | Tragic 25.5% |
| Comanche | 0.0 /100 | #313 | Tragic 25.6% |
| Cherokee | 0.0 /100 | #314 | Tragic 25.7% |
| Iroquois | 0.0 /100 | #315 | Tragic 25.7% |
| Immigrants | Somalia | 0.0 /100 | #316 | Tragic 25.8% |
| Ottawa | 0.0 /100 | #317 | Tragic 26.0% |
| Chickasaw | 0.0 /100 | #318 | Tragic 26.3% |
| Blacks/African Americans | 0.0 /100 | #319 | Tragic 26.4% |
| Arapaho | 0.0 /100 | #320 | Tragic 26.4% |
| Yup'ik | 0.0 /100 | #321 | Tragic 26.6% |
| Seminole | 0.0 /100 | #322 | Tragic 26.8% |
| Chippewa | 0.0 /100 | #323 | Tragic 26.8% |
| Kiowa | 0.0 /100 | #324 | Tragic 26.9% |
| Choctaw | 0.0 /100 | #325 | Tragic 27.2% |