Afghan vs Chickasaw Median Family Income
COMPARE
Afghan
Chickasaw
Median Family Income
Median Family Income Comparison
Afghans
Chickasaw
$112,971
MEDIAN FAMILY INCOME
99.5/ 100
METRIC RATING
72nd/ 347
METRIC RANK
$85,356
MEDIAN FAMILY INCOME
0.0/ 100
METRIC RATING
307th/ 347
METRIC RANK
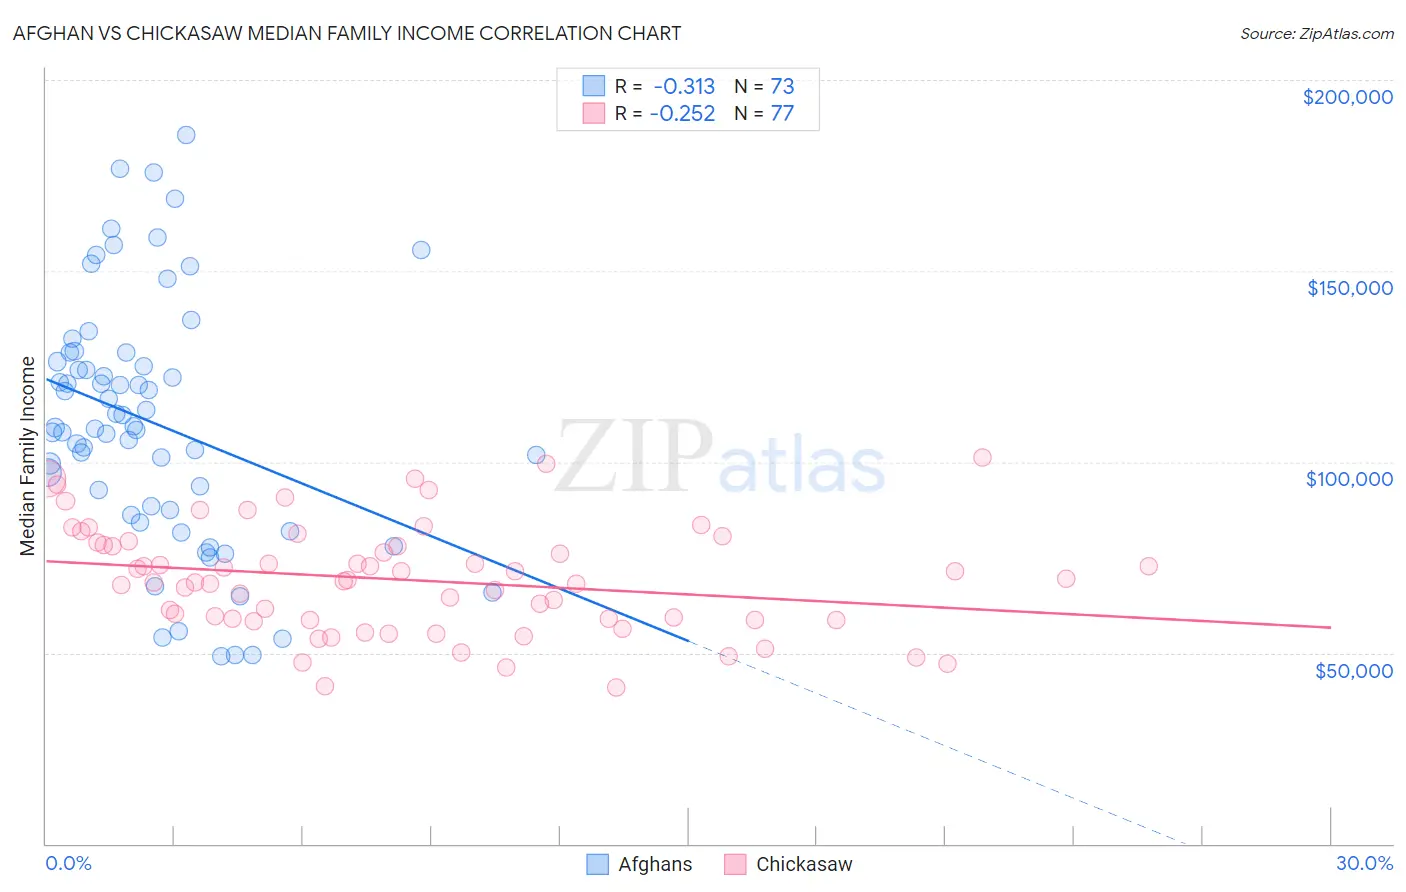
Afghan vs Chickasaw Median Family Income Correlation Chart
The statistical analysis conducted on geographies consisting of 148,816,167 people shows a mild negative correlation between the proportion of Afghans and median family income in the United States with a correlation coefficient (R) of -0.313 and weighted average of $112,971. Similarly, the statistical analysis conducted on geographies consisting of 147,660,168 people shows a weak negative correlation between the proportion of Chickasaw and median family income in the United States with a correlation coefficient (R) of -0.252 and weighted average of $85,356, a difference of 32.4%.
Median Family Income Correlation Summary
| Measurement | Afghan | Chickasaw |
| Minimum | $49,167 | $40,774 |
| Maximum | $185,438 | $101,302 |
| Range | $136,271 | $60,528 |
| Mean | $110,128 | $69,119 |
| Median | $108,924 | $68,772 |
| Interquartile 25% (IQ1) | $86,729 | $58,750 |
| Interquartile 75% (IQ3) | $127,419 | $78,533 |
| Interquartile Range (IQR) | $40,689 | $19,783 |
| Standard Deviation (Sample) | $32,416 | $14,096 |
| Standard Deviation (Population) | $32,193 | $14,004 |
Similar Demographics by Median Family Income
Demographics Similar to Afghans by Median Family Income
In terms of median family income, the demographic groups most similar to Afghans are Laotian ($112,859, a difference of 0.10%), Immigrants from Italy ($112,848, a difference of 0.11%), South African ($113,229, a difference of 0.23%), Immigrants from Western Europe ($112,688, a difference of 0.25%), and Argentinean ($112,665, a difference of 0.27%).
| Demographics | Rating | Rank | Median Family Income |
| Egyptians | 99.7 /100 | #65 | Exceptional $114,119 |
| Paraguayans | 99.7 /100 | #66 | Exceptional $114,016 |
| Immigrants | Spain | 99.7 /100 | #67 | Exceptional $113,815 |
| Immigrants | Serbia | 99.6 /100 | #68 | Exceptional $113,463 |
| Immigrants | Bulgaria | 99.6 /100 | #69 | Exceptional $113,461 |
| Immigrants | Romania | 99.6 /100 | #70 | Exceptional $113,434 |
| South Africans | 99.5 /100 | #71 | Exceptional $113,229 |
| Afghans | 99.5 /100 | #72 | Exceptional $112,971 |
| Laotians | 99.5 /100 | #73 | Exceptional $112,859 |
| Immigrants | Italy | 99.4 /100 | #74 | Exceptional $112,848 |
| Immigrants | Western Europe | 99.4 /100 | #75 | Exceptional $112,688 |
| Argentineans | 99.4 /100 | #76 | Exceptional $112,665 |
| Immigrants | Eastern Europe | 99.4 /100 | #77 | Exceptional $112,527 |
| Immigrants | Canada | 99.3 /100 | #78 | Exceptional $112,374 |
| Italians | 99.3 /100 | #79 | Exceptional $112,372 |
Demographics Similar to Chickasaw by Median Family Income
In terms of median family income, the demographic groups most similar to Chickasaw are Immigrants from Dominica ($85,411, a difference of 0.060%), Paiute ($85,414, a difference of 0.070%), U.S. Virgin Islander ($85,294, a difference of 0.070%), Haitian ($85,218, a difference of 0.16%), and Mexican ($85,618, a difference of 0.31%).
| Demographics | Rating | Rank | Median Family Income |
| Ottawa | 0.0 /100 | #300 | Tragic $86,380 |
| Colville | 0.0 /100 | #301 | Tragic $85,792 |
| Spanish American Indians | 0.0 /100 | #302 | Tragic $85,728 |
| Hispanics or Latinos | 0.0 /100 | #303 | Tragic $85,647 |
| Mexicans | 0.0 /100 | #304 | Tragic $85,618 |
| Paiute | 0.0 /100 | #305 | Tragic $85,414 |
| Immigrants | Dominica | 0.0 /100 | #306 | Tragic $85,411 |
| Chickasaw | 0.0 /100 | #307 | Tragic $85,356 |
| U.S. Virgin Islanders | 0.0 /100 | #308 | Tragic $85,294 |
| Haitians | 0.0 /100 | #309 | Tragic $85,218 |
| Immigrants | Central America | 0.0 /100 | #310 | Tragic $85,050 |
| Hondurans | 0.0 /100 | #311 | Tragic $85,004 |
| Cubans | 0.0 /100 | #312 | Tragic $84,981 |
| Choctaw | 0.0 /100 | #313 | Tragic $84,835 |
| Immigrants | Bahamas | 0.0 /100 | #314 | Tragic $84,732 |