Afghan vs Soviet Union Single Female Poverty
COMPARE
Afghan
Soviet Union
Single Female Poverty
Single Female Poverty Comparison
Afghans
Soviet Union
19.5%
SINGLE FEMALE POVERTY
99.0/ 100
METRIC RATING
88th/ 347
METRIC RANK
19.6%
SINGLE FEMALE POVERTY
98.8/ 100
METRIC RATING
91st/ 347
METRIC RANK
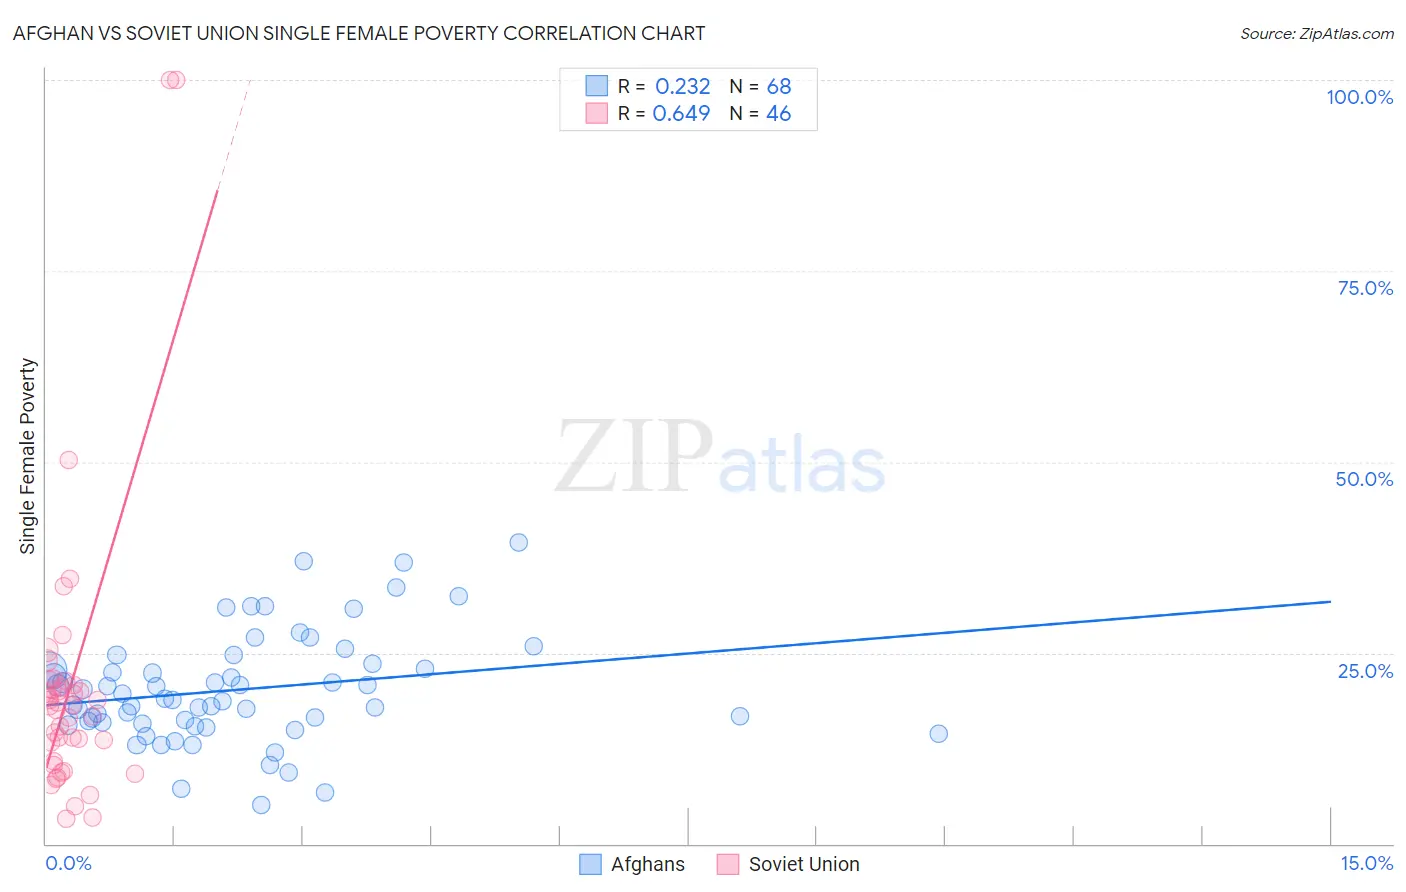
Afghan vs Soviet Union Single Female Poverty Correlation Chart
The statistical analysis conducted on geographies consisting of 148,055,541 people shows a weak positive correlation between the proportion of Afghans and poverty level among single females in the United States with a correlation coefficient (R) of 0.232 and weighted average of 19.5%. Similarly, the statistical analysis conducted on geographies consisting of 43,439,502 people shows a significant positive correlation between the proportion of Soviet Union and poverty level among single females in the United States with a correlation coefficient (R) of 0.649 and weighted average of 19.6%, a difference of 0.25%.
Single Female Poverty Correlation Summary
| Measurement | Afghan | Soviet Union |
| Minimum | 5.1% | 3.3% |
| Maximum | 39.5% | 100.0% |
| Range | 34.4% | 96.7% |
| Mean | 20.2% | 20.7% |
| Median | 18.9% | 18.1% |
| Interquartile 25% (IQ1) | 15.9% | 10.8% |
| Interquartile 75% (IQ3) | 23.2% | 20.9% |
| Interquartile Range (IQR) | 7.4% | 10.0% |
| Standard Deviation (Sample) | 7.1% | 19.1% |
| Standard Deviation (Population) | 7.1% | 18.9% |
Demographics Similar to Afghans and Soviet Union by Single Female Poverty
In terms of single female poverty, the demographic groups most similar to Afghans are Immigrants from Ukraine (19.5%, a difference of 0.010%), Zimbabwean (19.5%, a difference of 0.020%), Immigrants from Lebanon (19.6%, a difference of 0.19%), Italian (19.6%, a difference of 0.30%), and Immigrants from Austria (19.6%, a difference of 0.31%). Similarly, the demographic groups most similar to Soviet Union are Italian (19.6%, a difference of 0.050%), Immigrants from Lebanon (19.6%, a difference of 0.060%), Immigrants from Austria (19.6%, a difference of 0.060%), Immigrants from Ukraine (19.5%, a difference of 0.24%), and Zimbabwean (19.5%, a difference of 0.27%).
| Demographics | Rating | Rank | Single Female Poverty |
| Immigrants | Sierra Leone | 99.3 /100 | #79 | Exceptional 19.4% |
| Immigrants | Australia | 99.3 /100 | #80 | Exceptional 19.4% |
| Immigrants | Scotland | 99.2 /100 | #81 | Exceptional 19.4% |
| Immigrants | Malaysia | 99.2 /100 | #82 | Exceptional 19.4% |
| Taiwanese | 99.2 /100 | #83 | Exceptional 19.4% |
| Immigrants | Sweden | 99.2 /100 | #84 | Exceptional 19.4% |
| Immigrants | Albania | 99.2 /100 | #85 | Exceptional 19.4% |
| Greeks | 99.2 /100 | #86 | Exceptional 19.4% |
| Zimbabweans | 99.0 /100 | #87 | Exceptional 19.5% |
| Afghans | 99.0 /100 | #88 | Exceptional 19.5% |
| Immigrants | Ukraine | 99.0 /100 | #89 | Exceptional 19.5% |
| Immigrants | Lebanon | 98.8 /100 | #90 | Exceptional 19.6% |
| Soviet Union | 98.8 /100 | #91 | Exceptional 19.6% |
| Italians | 98.8 /100 | #92 | Exceptional 19.6% |
| Immigrants | Austria | 98.8 /100 | #93 | Exceptional 19.6% |
| Romanians | 98.6 /100 | #94 | Exceptional 19.6% |
| Estonians | 98.2 /100 | #95 | Exceptional 19.7% |
| Immigrants | Brazil | 98.2 /100 | #96 | Exceptional 19.7% |
| Croatians | 98.1 /100 | #97 | Exceptional 19.7% |
| Immigrants | France | 97.9 /100 | #98 | Exceptional 19.7% |
| Sierra Leoneans | 97.9 /100 | #99 | Exceptional 19.7% |