Afghan vs Chickasaw In Labor Force | Age 45-54
COMPARE
Afghan
Chickasaw
In Labor Force | Age 45-54
In Labor Force | Age 45-54 Comparison
Afghans
Chickasaw
83.5%
IN LABOR FORCE | AGE 45-54
97.9/ 100
METRIC RATING
63rd/ 347
METRIC RANK
79.0%
IN LABOR FORCE | AGE 45-54
0.0/ 100
METRIC RATING
318th/ 347
METRIC RANK
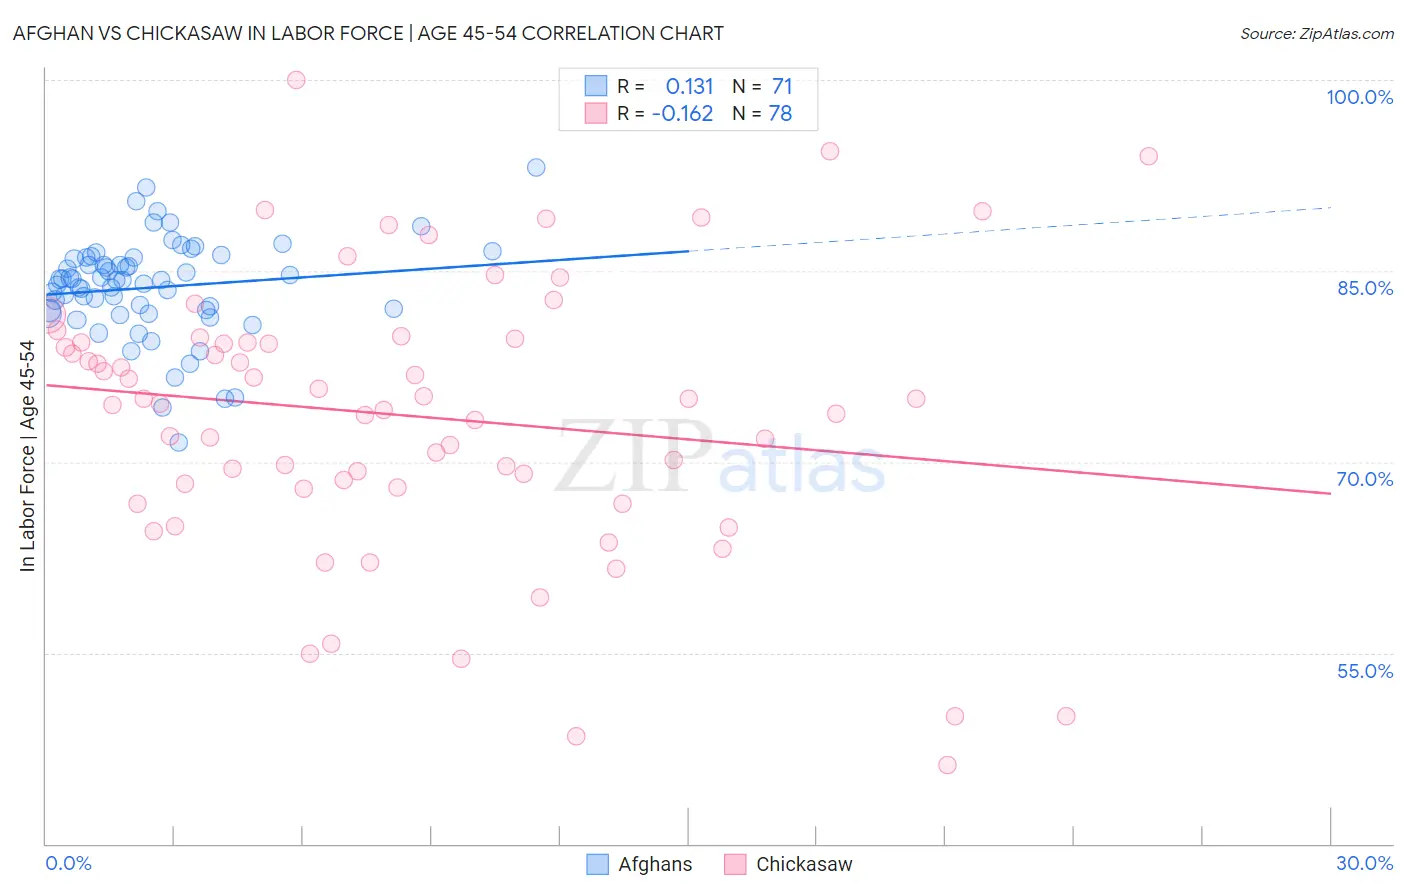
Afghan vs Chickasaw In Labor Force | Age 45-54 Correlation Chart
The statistical analysis conducted on geographies consisting of 148,803,008 people shows a poor positive correlation between the proportion of Afghans and labor force participation rate among population between the ages 45 and 54 in the United States with a correlation coefficient (R) of 0.131 and weighted average of 83.5%. Similarly, the statistical analysis conducted on geographies consisting of 147,675,622 people shows a poor negative correlation between the proportion of Chickasaw and labor force participation rate among population between the ages 45 and 54 in the United States with a correlation coefficient (R) of -0.162 and weighted average of 79.0%, a difference of 5.6%.
In Labor Force | Age 45-54 Correlation Summary
| Measurement | Afghan | Chickasaw |
| Minimum | 71.5% | 46.2% |
| Maximum | 93.1% | 100.0% |
| Range | 21.6% | 53.8% |
| Mean | 83.7% | 73.6% |
| Median | 84.3% | 74.8% |
| Interquartile 25% (IQ1) | 81.9% | 68.0% |
| Interquartile 75% (IQ3) | 86.0% | 79.4% |
| Interquartile Range (IQR) | 4.1% | 11.4% |
| Standard Deviation (Sample) | 3.9% | 10.8% |
| Standard Deviation (Population) | 3.8% | 10.7% |
Similar Demographics by In Labor Force | Age 45-54
Demographics Similar to Afghans by In Labor Force | Age 45-54
In terms of in labor force | age 45-54, the demographic groups most similar to Afghans are Immigrants from Kenya (83.5%, a difference of 0.0%), Immigrants from Taiwan (83.5%, a difference of 0.010%), Egyptian (83.5%, a difference of 0.010%), Asian (83.4%, a difference of 0.020%), and Chilean (83.4%, a difference of 0.020%).
| Demographics | Rating | Rank | In Labor Force | Age 45-54 |
| Immigrants | Peru | 98.6 /100 | #56 | Exceptional 83.5% |
| Paraguayans | 98.5 /100 | #57 | Exceptional 83.5% |
| Eastern Europeans | 98.5 /100 | #58 | Exceptional 83.5% |
| Bhutanese | 98.3 /100 | #59 | Exceptional 83.5% |
| Carpatho Rusyns | 98.3 /100 | #60 | Exceptional 83.5% |
| Filipinos | 98.3 /100 | #61 | Exceptional 83.5% |
| Immigrants | Taiwan | 98.0 /100 | #62 | Exceptional 83.5% |
| Afghans | 97.9 /100 | #63 | Exceptional 83.5% |
| Immigrants | Kenya | 97.9 /100 | #64 | Exceptional 83.5% |
| Egyptians | 97.9 /100 | #65 | Exceptional 83.5% |
| Asians | 97.7 /100 | #66 | Exceptional 83.4% |
| Chileans | 97.7 /100 | #67 | Exceptional 83.4% |
| Immigrants | Colombia | 97.6 /100 | #68 | Exceptional 83.4% |
| Taiwanese | 97.5 /100 | #69 | Exceptional 83.4% |
| Immigrants | Latvia | 97.4 /100 | #70 | Exceptional 83.4% |
Demographics Similar to Chickasaw by In Labor Force | Age 45-54
In terms of in labor force | age 45-54, the demographic groups most similar to Chickasaw are Cherokee (79.0%, a difference of 0.10%), Comanche (79.2%, a difference of 0.17%), Yaqui (78.9%, a difference of 0.21%), Shoshone (79.3%, a difference of 0.31%), and Black/African American (79.3%, a difference of 0.39%).
| Demographics | Rating | Rank | In Labor Force | Age 45-54 |
| Mexicans | 0.0 /100 | #311 | Tragic 79.8% |
| Immigrants | Mexico | 0.0 /100 | #312 | Tragic 79.7% |
| Colville | 0.0 /100 | #313 | Tragic 79.5% |
| Ottawa | 0.0 /100 | #314 | Tragic 79.5% |
| Blacks/African Americans | 0.0 /100 | #315 | Tragic 79.3% |
| Shoshone | 0.0 /100 | #316 | Tragic 79.3% |
| Comanche | 0.0 /100 | #317 | Tragic 79.2% |
| Chickasaw | 0.0 /100 | #318 | Tragic 79.0% |
| Cherokee | 0.0 /100 | #319 | Tragic 79.0% |
| Yaqui | 0.0 /100 | #320 | Tragic 78.9% |
| Yup'ik | 0.0 /100 | #321 | Tragic 78.6% |
| Crow | 0.0 /100 | #322 | Tragic 78.3% |
| Kiowa | 0.0 /100 | #323 | Tragic 78.3% |
| Dutch West Indians | 0.0 /100 | #324 | Tragic 78.2% |
| Choctaw | 0.0 /100 | #325 | Tragic 78.2% |