Zip Codes with the Highest Percentage of Population Employed in Agriculture, Fishing & Hunting in Rio Rancho, NM
RELATED REPORTS & OPTIONS
Agriculture, Fishing & Hunting
Rio Rancho
Compare Zip Codes
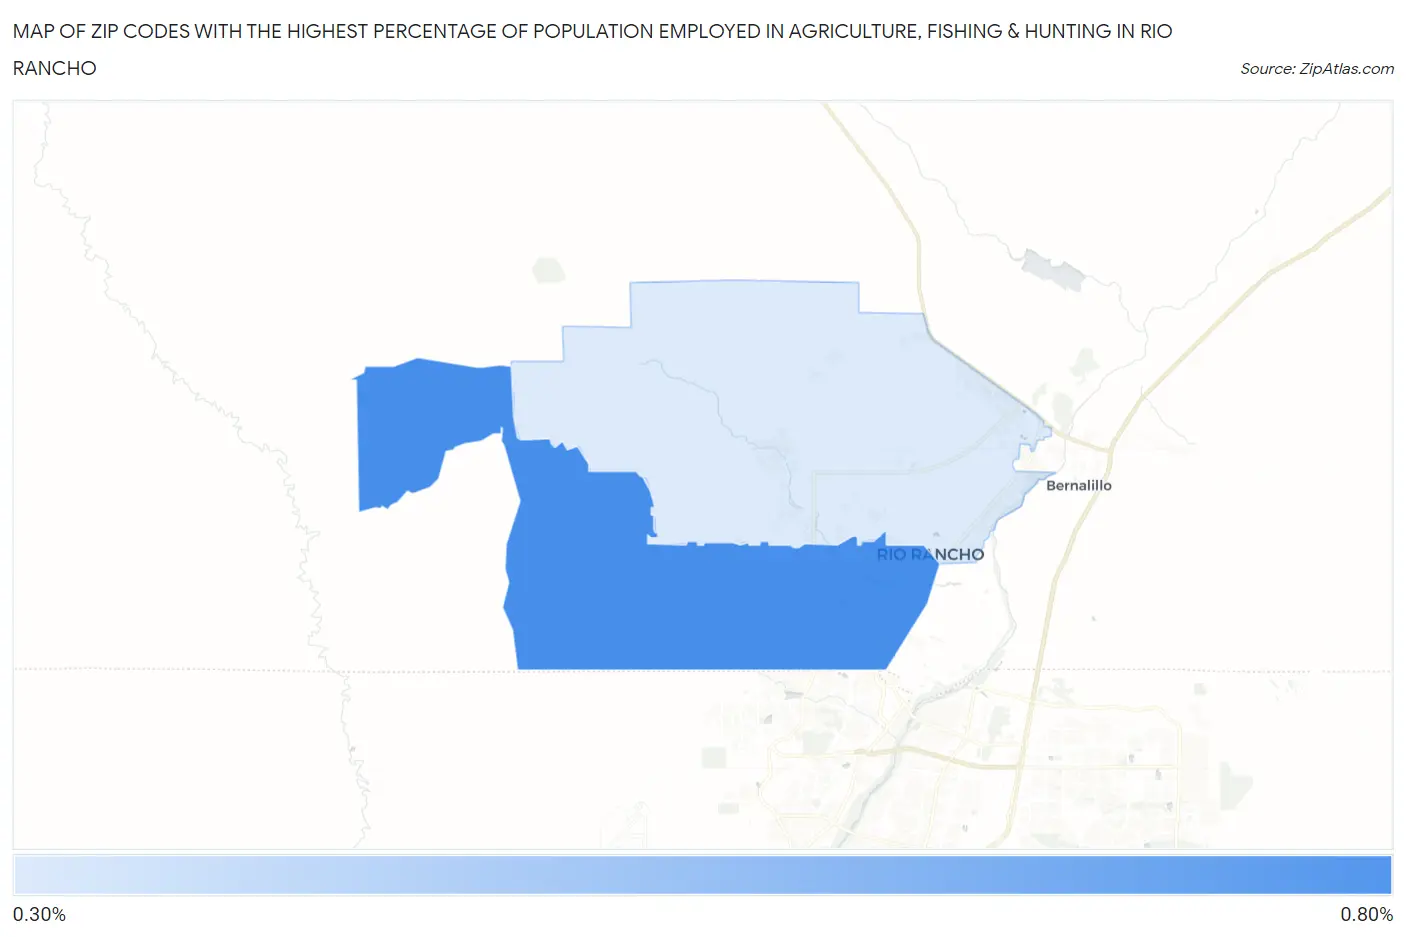
Map of Zip Codes with the Highest Percentage of Population Employed in Agriculture, Fishing & Hunting in Rio Rancho
0.35%
0.62%
Zip Codes with the Highest Percentage of Population Employed in Agriculture, Fishing & Hunting in Rio Rancho, NM
| Zip Code | % Employed | vs State | vs National | |
| 1. | 87124 | 0.62% | 2.0%(-1.34)#191 | 1.2%(-0.578)#18,341 |
| 2. | 87144 | 0.35% | 2.0%(-1.61)#205 | 1.2%(-0.854)#20,698 |
1
Common Questions
What are the Top Zip Codes with the Highest Percentage of Population Employed in Agriculture, Fishing & Hunting in Rio Rancho, NM?
Top Zip Codes with the Highest Percentage of Population Employed in Agriculture, Fishing & Hunting in Rio Rancho, NM are:
What zip code has the Highest Percentage of Population Employed in Agriculture, Fishing & Hunting in Rio Rancho, NM?
87124 has the Highest Percentage of Population Employed in Agriculture, Fishing & Hunting in Rio Rancho, NM with 0.62%.
What is the Percentage of Population Employed in Agriculture, Fishing & Hunting in Rio Rancho, NM?
Percentage of Population Employed in Agriculture, Fishing & Hunting in Rio Rancho is 0.50%.
What is the Percentage of Population Employed in Agriculture, Fishing & Hunting in New Mexico?
Percentage of Population Employed in Agriculture, Fishing & Hunting in New Mexico is 2.0%.
What is the Percentage of Population Employed in Agriculture, Fishing & Hunting in the United States?
Percentage of Population Employed in Agriculture, Fishing & Hunting in the United States is 1.2%.