Zip Codes with the Highest Percentage of Population Employed in Office & Administration in Rio Rancho, NM
RELATED REPORTS & OPTIONS
Office & Administration
Rio Rancho
Compare Zip Codes
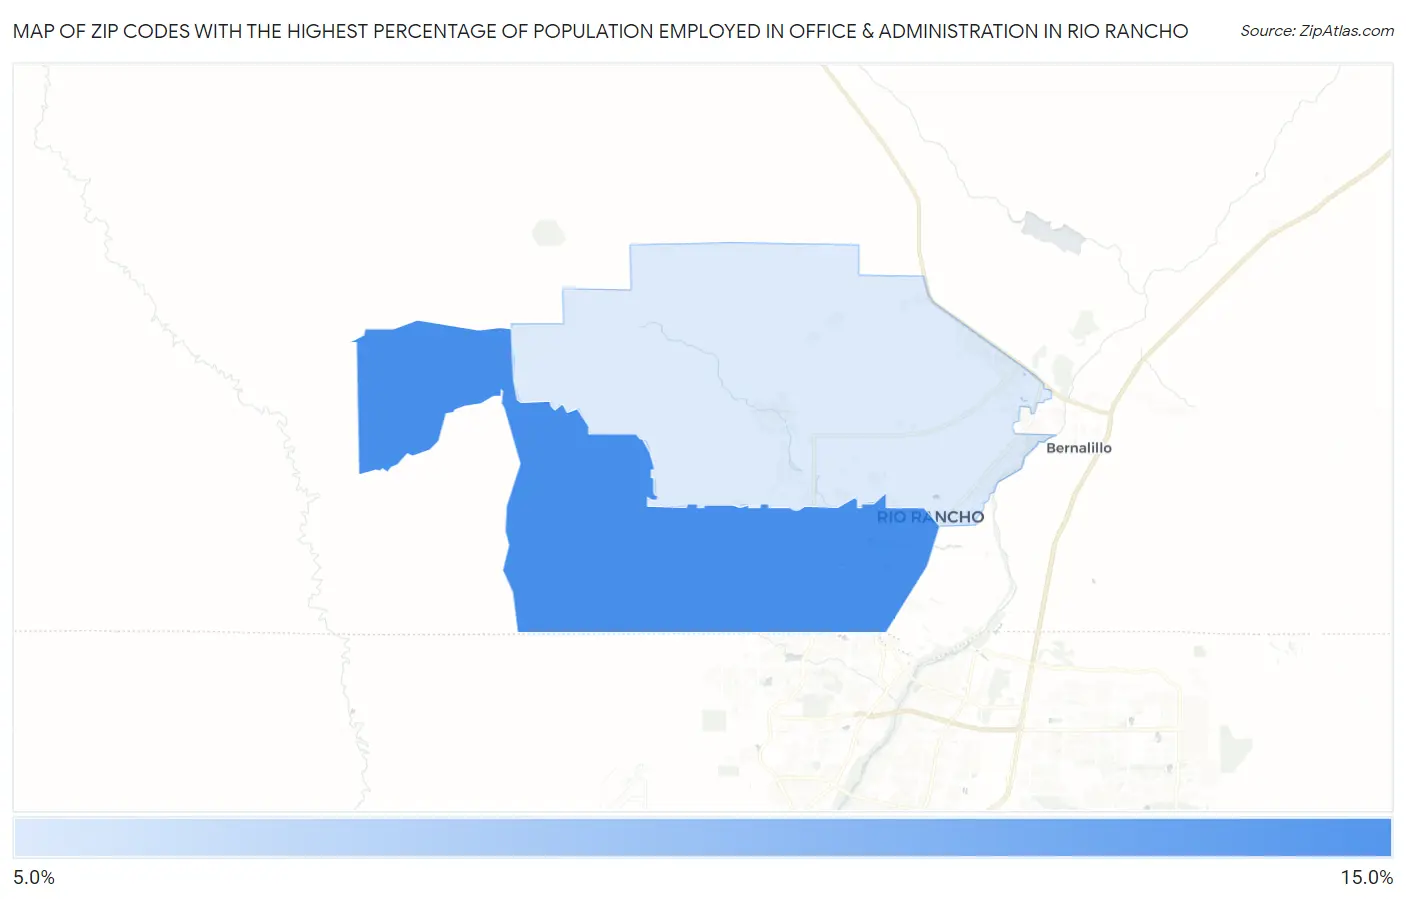
Map of Zip Codes with the Highest Percentage of Population Employed in Office & Administration in Rio Rancho
13.4%
14.3%
Zip Codes with the Highest Percentage of Population Employed in Office & Administration in Rio Rancho, NM
| Zip Code | % Employed | vs State | vs National | |
| 1. | 87124 | 14.3% | 11.2%(+3.18)#69 | 10.9%(+3.49)#5,459 |
| 2. | 87144 | 13.4% | 11.2%(+2.28)#80 | 10.9%(+2.59)#7,036 |
1
Common Questions
What are the Top Zip Codes with the Highest Percentage of Population Employed in Office & Administration in Rio Rancho, NM?
Top Zip Codes with the Highest Percentage of Population Employed in Office & Administration in Rio Rancho, NM are:
What zip code has the Highest Percentage of Population Employed in Office & Administration in Rio Rancho, NM?
87124 has the Highest Percentage of Population Employed in Office & Administration in Rio Rancho, NM with 14.3%.
What is the Percentage of Population Employed in Office & Administration in Rio Rancho, NM?
Percentage of Population Employed in Office & Administration in Rio Rancho is 14.1%.
What is the Percentage of Population Employed in Office & Administration in New Mexico?
Percentage of Population Employed in Office & Administration in New Mexico is 11.2%.
What is the Percentage of Population Employed in Office & Administration in the United States?
Percentage of Population Employed in Office & Administration in the United States is 10.9%.