Zip Codes with the Highest Percentage of Self-Employed / Not Incorporated in Lincoln, NE

RELATED REPORTS & OPTIONS

Self-Employed / Not Incorporated
Population
Families and Households
Female Fertility
Female Fertility (Unmarried)
Race (Community Size)
Race (Percentage)
Ancestry (Community Size)
AfghanAfricanAlaska NativeAlbanianAmericanApacheArabArgentineanArmenianAustralianAustrianBangladeshiBelgianBhutaneseBlackfeetBrazilianBritishBritish West IndianBulgarianBurmeseCanadianCelticCentral AmericanCentral American IndianCherokeeChileanChippewaChoctawColombianCosta RicanCreekCroatianCubanCzechCzechoslovakianDanishDominicanDutchEastern EuropeanEcuadorianEgyptianEnglishEthiopianEuropeanFilipinoFinnishFrenchFrench American IndianFrench CanadianGermanGerman RussianGhanaianGreekGuamanian / ChamorroGuatemalanHaitianHonduranHungarianIcelanderIndian (Asian)IndonesianIranianIraqiIrishIroquoisItalianJamaicanJapaneseJordanianKenyanKoreanLaotianLatvianLebaneseLithuanianLuxembourgerMalaysianMexicanMexican American IndianMongolianMoroccanNative HawaiianNavajoNicaraguanNigerianNorthern EuropeanNorwegianPakistaniPalestinianPanamanianPennsylvania GermanPeruvianPolishPortuguesePotawatomiPuerto RicanRomanianRussianSalvadoranSamoanScandinavianScotch-IrishScottishSerbianSiouxSlavicSlovakSomaliSouth AmericanSouth American IndianSpaniardSpanishSri LankanSubsaharan AfricanSudaneseSwedishSwissSyrianThaiTrinidadian and TobagonianTurkishUkrainianVenezuelanVietnameseWelshWest IndianYugoslavian
Ancestry (Percentage)
AfghanAfricanAlaska NativeAlbanianAmericanApacheArabArgentineanArmenianAustralianAustrianBangladeshiBelgianBhutaneseBlackfeetBrazilianBritishBritish West IndianBulgarianBurmeseCanadianCelticCentral AmericanCentral American IndianCherokeeChileanChippewaChoctawColombianCosta RicanCreekCroatianCubanCzechCzechoslovakianDanishDominicanDutchEastern EuropeanEcuadorianEgyptianEnglishEthiopianEuropeanFilipinoFinnishFrenchFrench American IndianFrench CanadianGermanGerman RussianGhanaianGreekGuamanian / ChamorroGuatemalanHaitianHonduranHungarianIcelanderIndian (Asian)IndonesianIranianIraqiIrishIroquoisItalianJamaicanJapaneseJordanianKenyanKoreanLaotianLatvianLebaneseLithuanianLuxembourgerMalaysianMexicanMexican American IndianMongolianMoroccanNative HawaiianNavajoNicaraguanNigerianNorthern EuropeanNorwegianPakistaniPalestinianPanamanianPennsylvania GermanPeruvianPolishPortuguesePotawatomiPuerto RicanRomanianRussianSalvadoranSamoanScandinavianScotch-IrishScottishSerbianSiouxSlavicSlovakSomaliSouth AmericanSouth American IndianSpaniardSpanishSri LankanSubsaharan AfricanSudaneseSwedishSwissSyrianThaiTrinidadian and TobagonianTurkishUkrainianVenezuelanVietnameseWelshWest IndianYugoslavian
Immigrant Origin (Total)
AfghanistanAfricaArgentinaAsiaAustraliaAustriaBangladeshBelarusBelgiumBosnia and HerzegovinaBrazilBurma / MyanmarCambodiaCameroonCanadaCaribbeanCentral AmericaChinaColombiaCosta RicaCubaDominican RepublicEastern AfricaEastern AsiaEastern EuropeEl SalvadorEnglandEthiopiaEuropeFranceGermanyGhanaGreeceGuatemalaHaitiHondurasHong KongHungaryIndiaIndonesiaIranIraqItalyJamaicaJapanJordanKazakhstanKenyaKoreaKuwaitLaosLatin AmericaLatviaLebanonLiberiaMalaysiaMexicoMiddle AfricaMoldovaMoroccoNepalNetherlandsNigeriaNorthern AfricaNorthern EuropeOceaniaPakistanPanamaPeruPhilippinesPolandRomaniaRussiaSaudi ArabiaScotlandSerbiaSomaliaSouth AmericaSouth Central AsiaSouth Eastern AsiaSouthern EuropeSpainSudanSwedenSyriaTaiwanThailandTrinidad and TobagoUgandaUkraineUzbekistanVenezuelaVietnamWestern AfricaWestern AsiaWestern EuropeZaire
Immigrant Origin (Percentage)
AfghanistanAfricaArgentinaAsiaAustraliaAustriaBangladeshBelarusBelgiumBosnia and HerzegovinaBrazilBurma / MyanmarCambodiaCameroonCanadaCaribbeanCentral AmericaChinaColombiaCosta RicaCubaDominican RepublicEastern AfricaEastern AsiaEastern EuropeEl SalvadorEnglandEthiopiaEuropeFranceGermanyGhanaGreeceGuatemalaHaitiHondurasHong KongHungaryIndiaIndonesiaIranIraqItalyJamaicaJapanJordanKazakhstanKenyaKoreaKuwaitLaosLatin AmericaLatviaLebanonLiberiaMalaysiaMexicoMiddle AfricaMoldovaMoroccoNepalNetherlandsNigeriaNorthern AfricaNorthern EuropeOceaniaPakistanPanamaPeruPhilippinesPolandRomaniaRussiaSaudi ArabiaScotlandSerbiaSomaliaSouth AmericaSouth Central AsiaSouth Eastern AsiaSouthern EuropeSpainSudanSwedenSyriaTaiwanThailandTrinidad and TobagoUgandaUkraineUzbekistanVenezuelaVietnamWestern AfricaWestern AsiaWestern EuropeZaire
Income
Income (Families)
Income (Households)
Poverty
Poverty (Families)
Unemployment
Employment Occupations
Employment Industries
Employer Class
Commute Time
Commute Means
School Enrollment
Education by Degree Field
Occupancy
Finances
Physical Characteristics
Lincoln
Compare Zip Codes
Comparison Subject

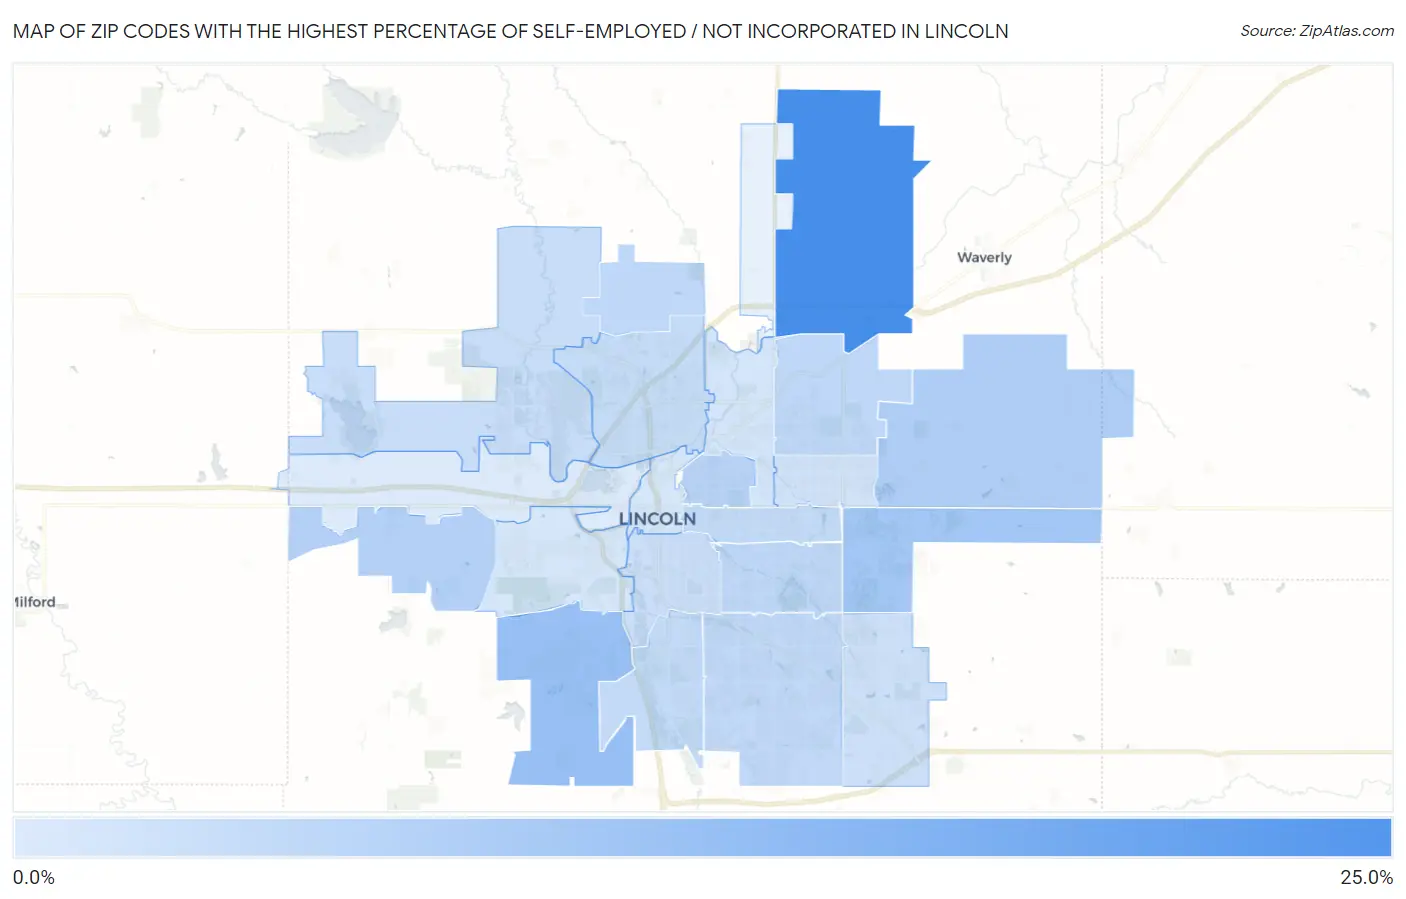
Map of Zip Codes with the Highest Percentage of Self-Employed / Not Incorporated in Lincoln

0.0%
25.0%
Zip Codes with the Highest Percentage of Self-Employed / Not Incorporated in Lincoln Map

Zip Codes with the Highest Percentage of Self-Employed / Not Incorporated in Lincoln, NE

Zip Code % Self-Employed / Not Incorporated vs State vs National
1.6851722.8%6.3%(+16.5)#805.8%(+17.0)#1,379
2.6852311.2%6.3%(+4.91)#2605.8%(+5.41)#5,971
3.685209.7%6.3%(+3.41)#3045.8%(+3.91)#7,730
4.685278.3%6.3%(+1.94)#3465.8%(+2.44)#10,129
5.685327.4%6.3%(+1.04)#3755.8%(+1.54)#12,171
6.685036.9%6.3%(+0.619)#3885.8%(+1.12)#13,225
7.685065.9%6.3%(-0.376)#4295.8%(+0.126)#16,259
8.685075.9%6.3%(-0.414)#4315.8%(+0.088)#16,378
9.685315.8%6.3%(-0.473)#4355.8%(+0.029)#16,566
10.685165.6%6.3%(-0.735)#4445.8%(-0.233)#17,472
11.685125.5%6.3%(-0.786)#4475.8%(-0.285)#17,672
12.685105.5%6.3%(-0.814)#4485.8%(-0.312)#17,766
13.685215.0%6.3%(-1.31)#4625.8%(-0.809)#19,645
14.685244.7%6.3%(-1.62)#4765.8%(-1.12)#20,827
15.685024.5%6.3%(-1.87)#4845.8%(-1.36)#21,776
16.685264.3%6.3%(-2.01)#4915.8%(-1.51)#22,294
17.685053.5%6.3%(-2.82)#5105.8%(-2.32)#25,006
18.685043.2%6.3%(-3.08)#5235.8%(-2.58)#25,769
19.685083.1%6.3%(-3.23)#5305.8%(-2.73)#26,150
20.685223.0%6.3%(-3.28)#5315.8%(-2.78)#26,284
21.685282.2%6.3%(-4.15)#5515.8%(-3.65)#28,007

Common Questions

What are the Top 10 Zip Codes with the Highest Percentage of Self-Employed / Not Incorporated in Lincoln, NE?
Top 10 Zip Codes with the Highest Percentage of Self-Employed / Not Incorporated in Lincoln, NE are:
#1
22.8%
#2
11.2%
#3
9.7%
#4
8.3%
#5
7.4%
#6
6.9%
#7
5.9%
#8
5.9%
#9
5.8%
#10
5.6%
What zip code has the Highest Percentage of Self-Employed / Not Incorporated in Lincoln, NE?
68517 has the Highest Percentage of Self-Employed / Not Incorporated in Lincoln, NE with 22.8%.
What is the Percentage of Self-Employed / Not Incorporated in Lincoln, NE?
Percentage of Self-Employed / Not Incorporated in Lincoln is 4.9%.
What is the Percentage of Self-Employed / Not Incorporated in Nebraska?
Percentage of Self-Employed / Not Incorporated in Nebraska is 6.3%.
What is the Percentage of Self-Employed / Not Incorporated in the United States?
Percentage of Self-Employed / Not Incorporated in the United States is 5.8%.