Zip Codes with the Highest Percentage of Population Employed in Architecture & Engineering in Blue Springs, MO
RELATED REPORTS & OPTIONS
Architecture & Engineering
Blue Springs
Compare Zip Codes
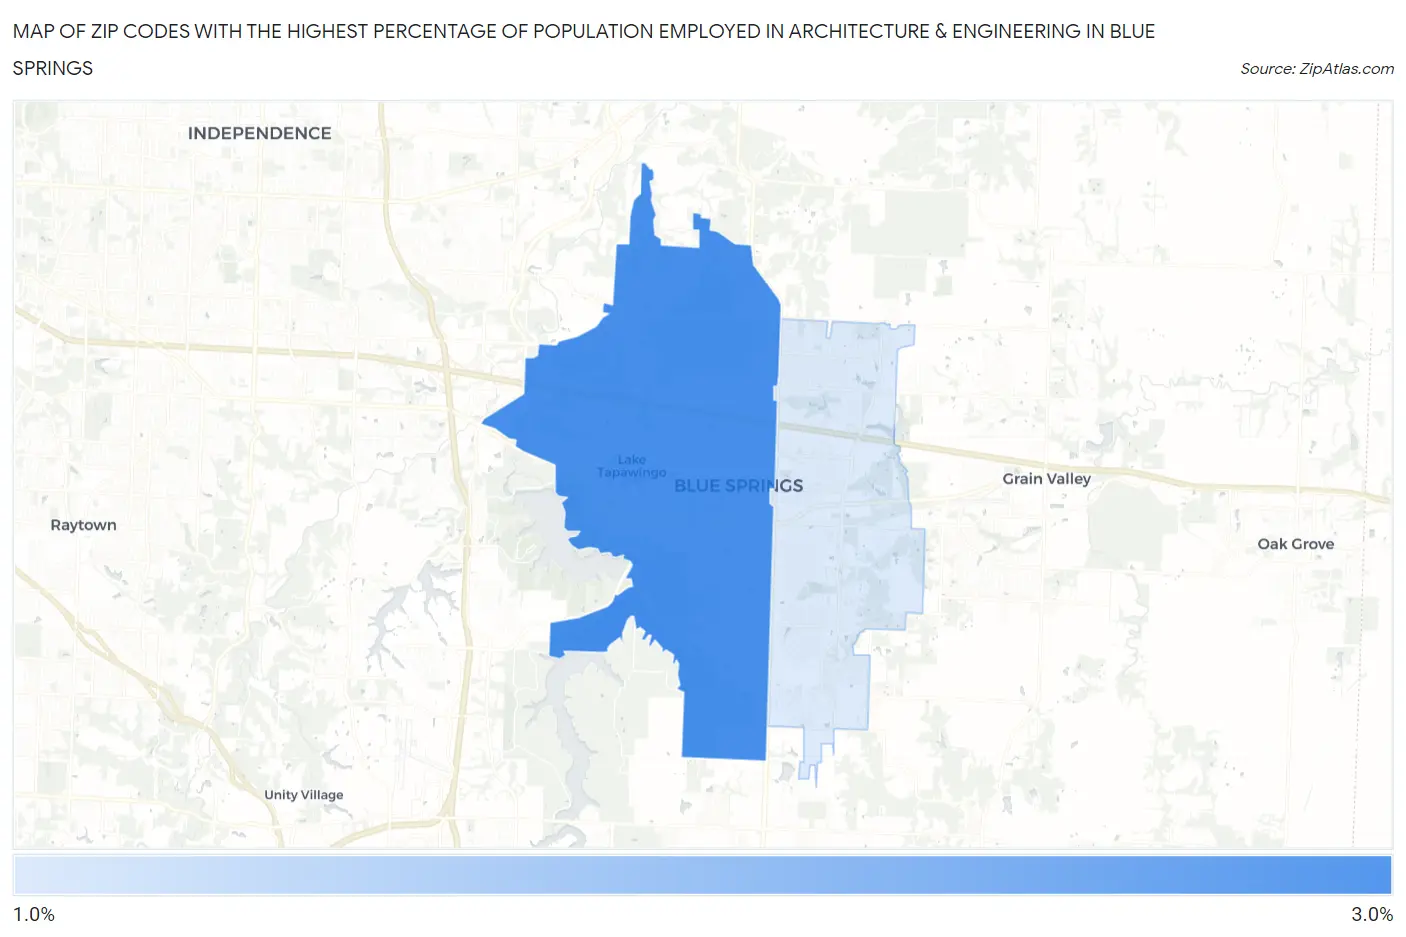
Map of Zip Codes with the Highest Percentage of Population Employed in Architecture & Engineering in Blue Springs
1.3%
2.7%
Zip Codes with the Highest Percentage of Population Employed in Architecture & Engineering in Blue Springs, MO
| Zip Code | % Employed | vs State | vs National | |
| 1. | 64015 | 2.7% | 1.7%(+1.04)#109 | 2.1%(+0.591)#6,000 |
| 2. | 64014 | 1.3% | 1.7%(-0.376)#285 | 2.1%(-0.821)#14,109 |
1
Common Questions
What are the Top Zip Codes with the Highest Percentage of Population Employed in Architecture & Engineering in Blue Springs, MO?
Top Zip Codes with the Highest Percentage of Population Employed in Architecture & Engineering in Blue Springs, MO are:
What zip code has the Highest Percentage of Population Employed in Architecture & Engineering in Blue Springs, MO?
64015 has the Highest Percentage of Population Employed in Architecture & Engineering in Blue Springs, MO with 2.7%.
What is the Percentage of Population Employed in Architecture & Engineering in Blue Springs, MO?
Percentage of Population Employed in Architecture & Engineering in Blue Springs is 2.1%.
What is the Percentage of Population Employed in Architecture & Engineering in Missouri?
Percentage of Population Employed in Architecture & Engineering in Missouri is 1.7%.
What is the Percentage of Population Employed in Architecture & Engineering in the United States?
Percentage of Population Employed in Architecture & Engineering in the United States is 2.1%.