Zip Codes with the Highest Percentage of Population Employed in Architecture & Engineering in Jefferson City, MO
RELATED REPORTS & OPTIONS
Architecture & Engineering
Jefferson City
Compare Zip Codes
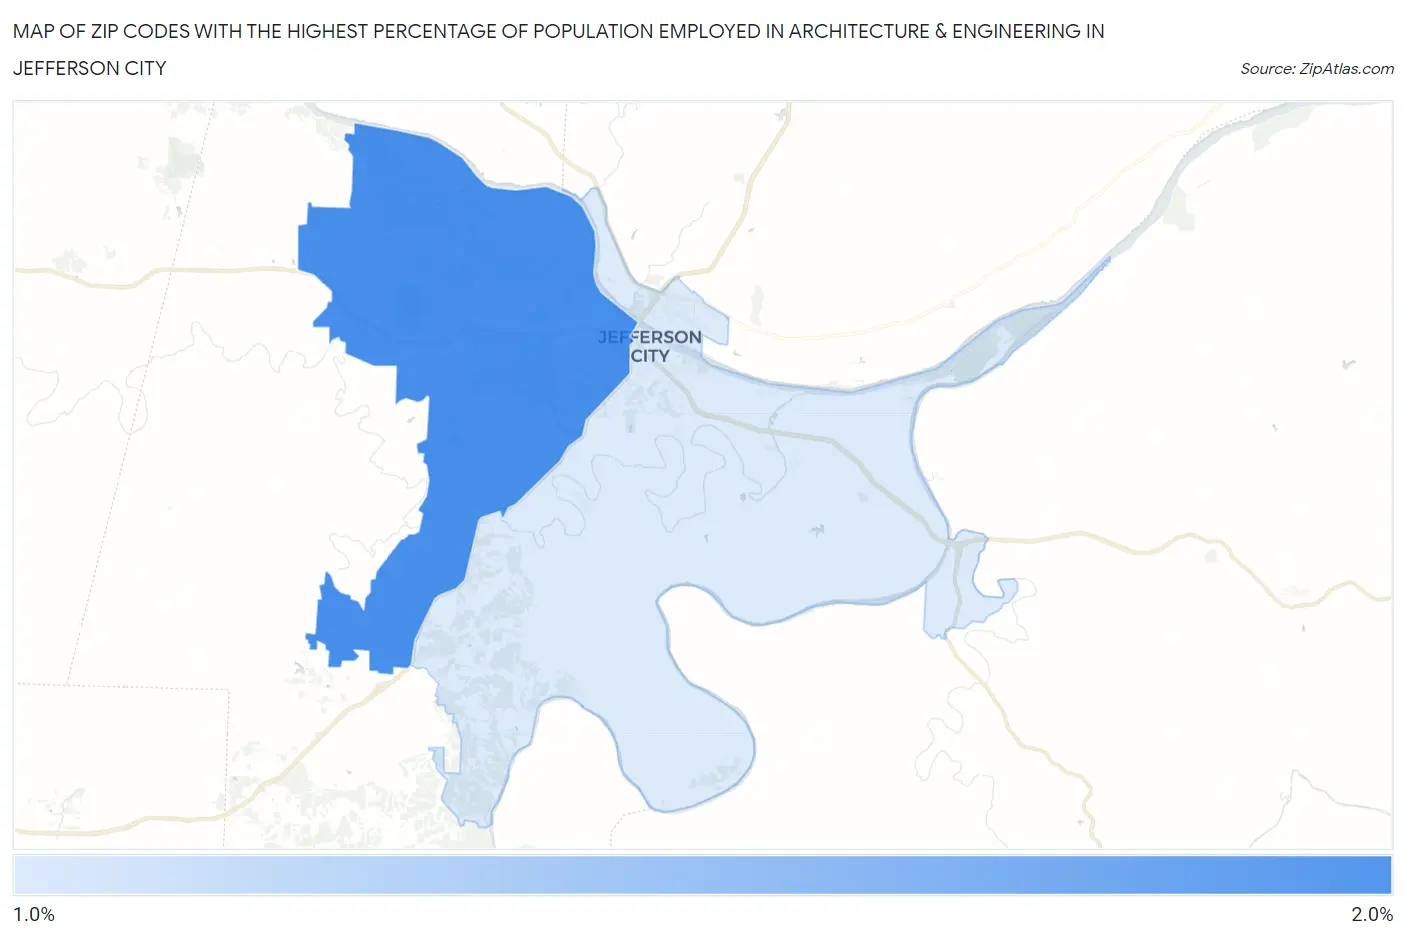
Map of Zip Codes with the Highest Percentage of Population Employed in Architecture & Engineering in Jefferson City
1.8%
1.9%
Zip Codes with the Highest Percentage of Population Employed in Architecture & Engineering in Jefferson City, MO
| Zip Code | % Employed | vs State | vs National | |
| 1. | 65109 | 1.9% | 1.7%(+0.187)#200 | 2.1%(-0.258)#10,304 |
| 2. | 65101 | 1.8% | 1.7%(+0.061)#216 | 2.1%(-0.383)#11,036 |
1
Common Questions
What are the Top Zip Codes with the Highest Percentage of Population Employed in Architecture & Engineering in Jefferson City, MO?
Top Zip Codes with the Highest Percentage of Population Employed in Architecture & Engineering in Jefferson City, MO are:
What zip code has the Highest Percentage of Population Employed in Architecture & Engineering in Jefferson City, MO?
65109 has the Highest Percentage of Population Employed in Architecture & Engineering in Jefferson City, MO with 1.9%.
What is the Percentage of Population Employed in Architecture & Engineering in Jefferson City, MO?
Percentage of Population Employed in Architecture & Engineering in Jefferson City is 1.6%.
What is the Percentage of Population Employed in Architecture & Engineering in Missouri?
Percentage of Population Employed in Architecture & Engineering in Missouri is 1.7%.
What is the Percentage of Population Employed in Architecture & Engineering in the United States?
Percentage of Population Employed in Architecture & Engineering in the United States is 2.1%.