Zip Codes with the Highest Percentage of Households With Two or more Vehicles in Hopkins, MN
RELATED REPORTS & OPTIONS
Households with 2 or more Cars
Hopkins
Compare Zip Codes
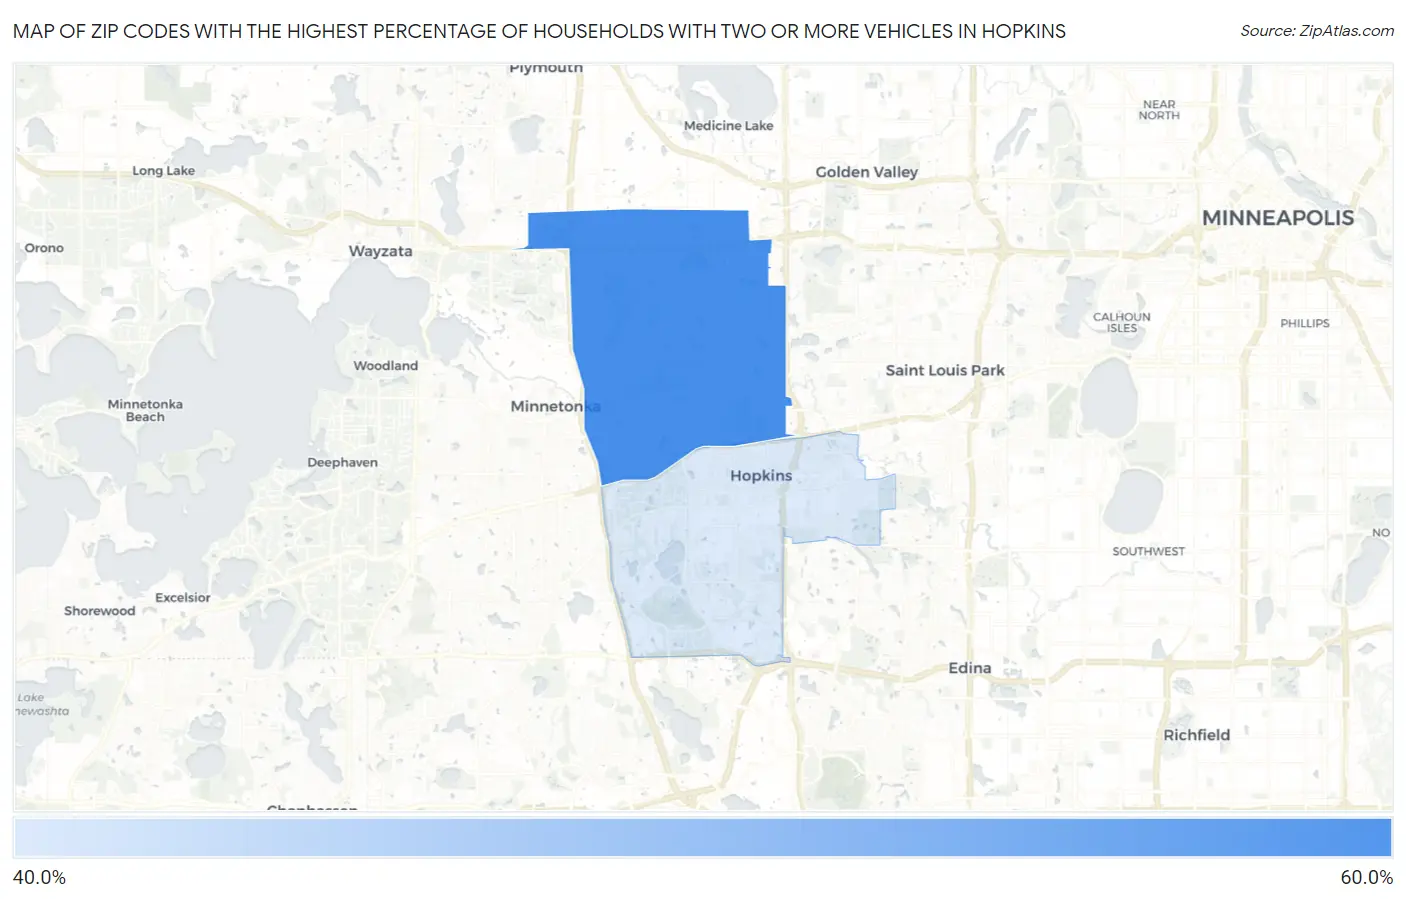
Map of Zip Codes with the Highest Percentage of Households With Two or more Vehicles in Hopkins
43.5%
56.4%
Zip Codes with the Highest Percentage of Households With Two or more Vehicles in Hopkins, MN
| Zip Code | Housholds With 2+ Cars | vs State | vs National | |
| 1. | 55305 | 56.4% | 63.4%(-7.00)#785 | 59.1%(-2.70)#25,129 |
| 2. | 55343 | 43.5% | 63.4%(-19.9)#845 | 59.1%(-15.6)#29,827 |
1
Common Questions
What are the Top Zip Codes with the Highest Percentage of Households With Two or more Vehicles in Hopkins, MN?
Top Zip Codes with the Highest Percentage of Households With Two or more Vehicles in Hopkins, MN are:
What zip code has the Highest Percentage of Households With Two or more Vehicles in Hopkins, MN?
55305 has the Highest Percentage of Households With Two or more Vehicles in Hopkins, MN with 56.4%.
What is the Percentage of Households With Two or more Vehicles in Hopkins, MN?
Percentage of Households With Two or more Vehicles in Hopkins is 39.6%.
What is the Percentage of Households With Two or more Vehicles in Minnesota?
Percentage of Households With Two or more Vehicles in Minnesota is 63.4%.
What is the Percentage of Households With Two or more Vehicles in the United States?
Percentage of Households With Two or more Vehicles in the United States is 59.1%.