Zip Codes with the Highest Percentage of Population Employed in Health Diagnosing & Treating in Cedar Rapids, IA
RELATED REPORTS & OPTIONS
Health Diagnosing & Treating
Cedar Rapids
Compare Zip Codes
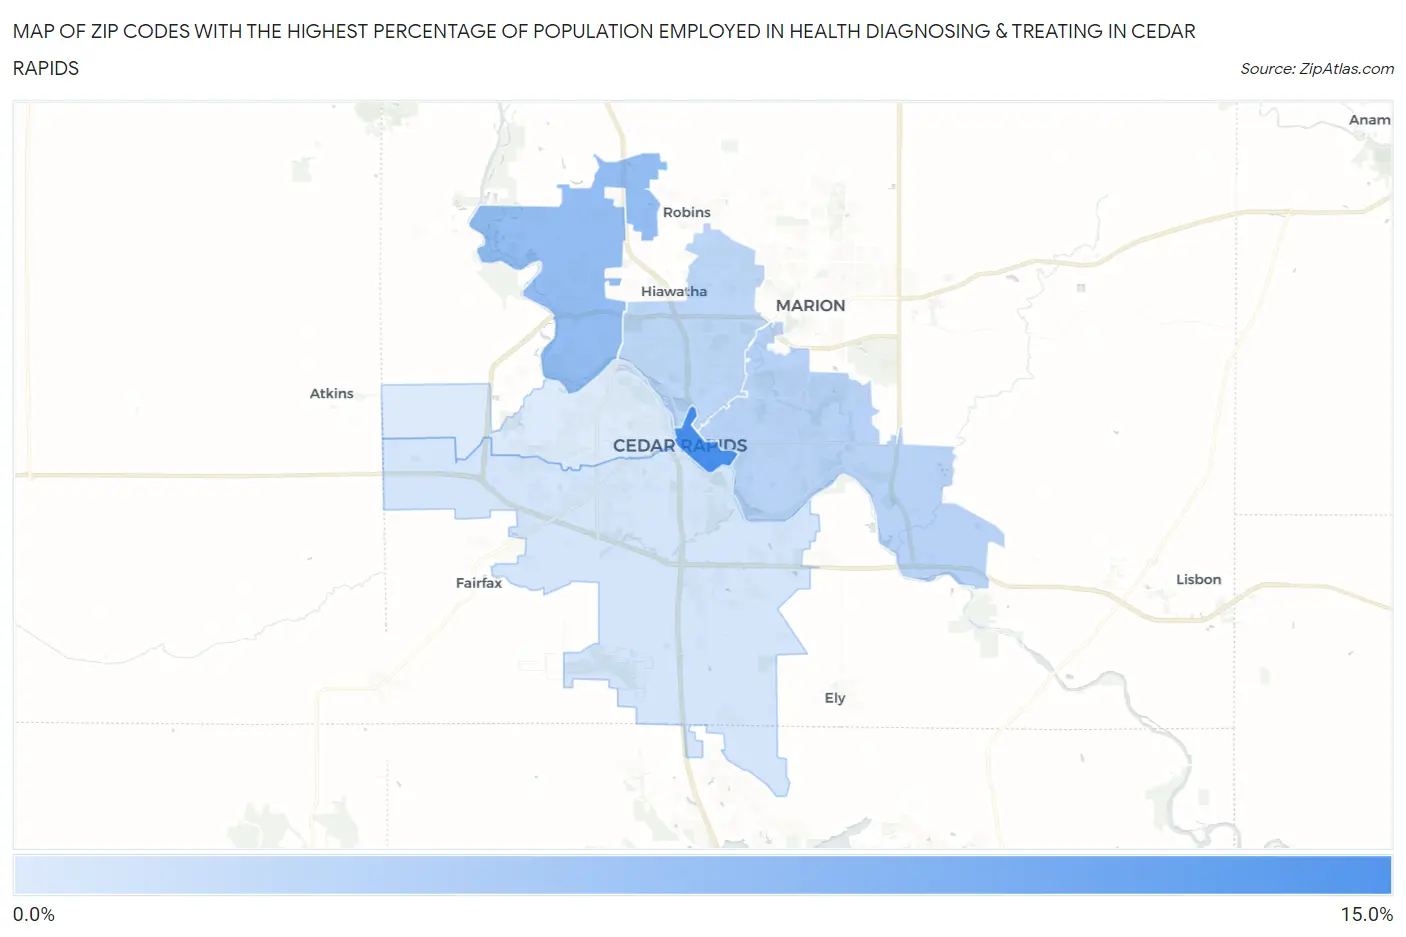
Map of Zip Codes with the Highest Percentage of Population Employed in Health Diagnosing & Treating in Cedar Rapids
4.3%
13.5%
Zip Codes with the Highest Percentage of Population Employed in Health Diagnosing & Treating in Cedar Rapids, IA
| Zip Code | % Employed | vs State | vs National | |
| 1. | 52401 | 13.5% | 6.2%(+7.37)#44 | 6.2%(+7.29)#1,560 |
| 2. | 52411 | 8.8% | 6.2%(+2.60)#171 | 6.2%(+2.52)#5,811 |
| 3. | 52403 | 6.5% | 6.2%(+0.353)#332 | 6.2%(+0.273)#11,966 |
| 4. | 52402 | 6.2% | 6.2%(-0.004)#364 | 6.2%(-0.084)#13,304 |
| 5. | 52404 | 4.8% | 6.2%(-1.37)#507 | 6.2%(-1.45)#18,499 |
| 6. | 52405 | 4.3% | 6.2%(-1.86)#569 | 6.2%(-1.94)#20,323 |
1
Common Questions
What are the Top 5 Zip Codes with the Highest Percentage of Population Employed in Health Diagnosing & Treating in Cedar Rapids, IA?
Top 5 Zip Codes with the Highest Percentage of Population Employed in Health Diagnosing & Treating in Cedar Rapids, IA are:
What zip code has the Highest Percentage of Population Employed in Health Diagnosing & Treating in Cedar Rapids, IA?
52401 has the Highest Percentage of Population Employed in Health Diagnosing & Treating in Cedar Rapids, IA with 13.5%.
What is the Percentage of Population Employed in Health Diagnosing & Treating in Cedar Rapids, IA?
Percentage of Population Employed in Health Diagnosing & Treating in Cedar Rapids is 5.7%.
What is the Percentage of Population Employed in Health Diagnosing & Treating in Iowa?
Percentage of Population Employed in Health Diagnosing & Treating in Iowa is 6.2%.
What is the Percentage of Population Employed in Health Diagnosing & Treating in the United States?
Percentage of Population Employed in Health Diagnosing & Treating in the United States is 6.2%.