Guamanian/Chamorro vs Moroccan Family Households with Children
COMPARE
Guamanian/Chamorro
Moroccan
Family Households with Children
Family Households with Children Comparison
Guamanians/Chamorros
Moroccans
29.7%
FAMILY HOUSEHOLDS WITH CHILDREN
100.0/ 100
METRIC RATING
24th/ 347
METRIC RANK
26.9%
FAMILY HOUSEHOLDS WITH CHILDREN
3.4/ 100
METRIC RATING
238th/ 347
METRIC RANK
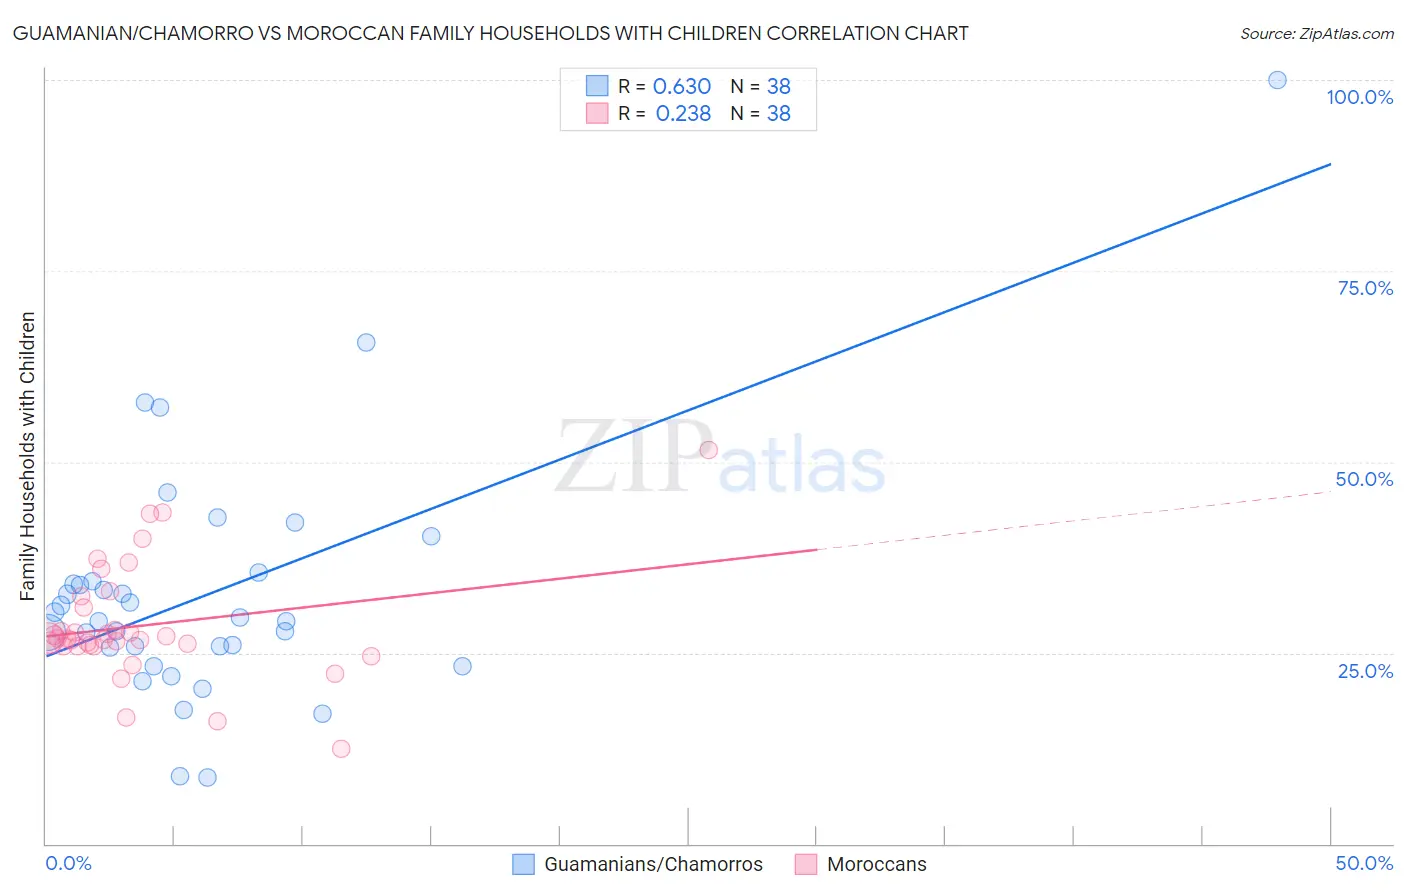
Guamanian/Chamorro vs Moroccan Family Households with Children Correlation Chart
The statistical analysis conducted on geographies consisting of 221,827,817 people shows a significant positive correlation between the proportion of Guamanians/Chamorros and percentage of family households with children in the United States with a correlation coefficient (R) of 0.630 and weighted average of 29.7%. Similarly, the statistical analysis conducted on geographies consisting of 201,690,181 people shows a weak positive correlation between the proportion of Moroccans and percentage of family households with children in the United States with a correlation coefficient (R) of 0.238 and weighted average of 26.9%, a difference of 10.3%.
Family Households with Children Correlation Summary
| Measurement | Guamanian/Chamorro | Moroccan |
| Minimum | 8.6% | 12.4% |
| Maximum | 100.0% | 51.6% |
| Range | 91.4% | 39.1% |
| Mean | 32.8% | 28.5% |
| Median | 29.4% | 26.9% |
| Interquartile 25% (IQ1) | 25.8% | 25.9% |
| Interquartile 75% (IQ3) | 34.4% | 31.0% |
| Interquartile Range (IQR) | 8.7% | 5.1% |
| Standard Deviation (Sample) | 16.3% | 7.5% |
| Standard Deviation (Population) | 16.1% | 7.4% |
Similar Demographics by Family Households with Children
Demographics Similar to Guamanians/Chamorros by Family Households with Children
In terms of family households with children, the demographic groups most similar to Guamanians/Chamorros are Mexican American Indian (29.7%, a difference of 0.10%), Immigrants from Latin America (29.7%, a difference of 0.10%), Malaysian (29.8%, a difference of 0.37%), Immigrants from Laos (29.8%, a difference of 0.41%), and Immigrants from El Salvador (29.8%, a difference of 0.45%).
| Demographics | Rating | Rank | Family Households with Children |
| Hispanics or Latinos | 100.0 /100 | #17 | Exceptional 29.9% |
| Salvadorans | 100.0 /100 | #18 | Exceptional 29.9% |
| Alaska Natives | 100.0 /100 | #19 | Exceptional 29.9% |
| Immigrants | El Salvador | 100.0 /100 | #20 | Exceptional 29.8% |
| Immigrants | Laos | 100.0 /100 | #21 | Exceptional 29.8% |
| Malaysians | 100.0 /100 | #22 | Exceptional 29.8% |
| Mexican American Indians | 100.0 /100 | #23 | Exceptional 29.7% |
| Guamanians/Chamorros | 100.0 /100 | #24 | Exceptional 29.7% |
| Immigrants | Latin America | 100.0 /100 | #25 | Exceptional 29.7% |
| Sri Lankans | 100.0 /100 | #26 | Exceptional 29.5% |
| Immigrants | Vietnam | 100.0 /100 | #27 | Exceptional 29.5% |
| Samoans | 100.0 /100 | #28 | Exceptional 29.5% |
| Bolivians | 100.0 /100 | #29 | Exceptional 29.5% |
| Yuman | 100.0 /100 | #30 | Exceptional 29.5% |
| Japanese | 100.0 /100 | #31 | Exceptional 29.4% |
Demographics Similar to Moroccans by Family Households with Children
In terms of family households with children, the demographic groups most similar to Moroccans are Immigrants from Netherlands (26.9%, a difference of 0.010%), Immigrants from Southern Europe (26.9%, a difference of 0.010%), Cape Verdean (26.9%, a difference of 0.020%), Immigrants from Bulgaria (26.9%, a difference of 0.020%), and Navajo (26.9%, a difference of 0.030%).
| Demographics | Rating | Rank | Family Households with Children |
| Luxembourgers | 5.5 /100 | #231 | Tragic 27.0% |
| Yugoslavians | 5.1 /100 | #232 | Tragic 27.0% |
| Immigrants | Italy | 5.0 /100 | #233 | Tragic 27.0% |
| Immigrants | Germany | 4.4 /100 | #234 | Tragic 27.0% |
| Immigrants | Morocco | 4.2 /100 | #235 | Tragic 27.0% |
| Cape Verdeans | 3.6 /100 | #236 | Tragic 26.9% |
| Immigrants | Netherlands | 3.5 /100 | #237 | Tragic 26.9% |
| Moroccans | 3.4 /100 | #238 | Tragic 26.9% |
| Immigrants | Southern Europe | 3.4 /100 | #239 | Tragic 26.9% |
| Immigrants | Bulgaria | 3.3 /100 | #240 | Tragic 26.9% |
| Navajo | 3.2 /100 | #241 | Tragic 26.9% |
| Immigrants | England | 3.2 /100 | #242 | Tragic 26.9% |
| Immigrants | Saudi Arabia | 2.9 /100 | #243 | Tragic 26.9% |
| Ukrainians | 2.9 /100 | #244 | Tragic 26.9% |
| Australians | 2.8 /100 | #245 | Tragic 26.9% |