Guamanian/Chamorro vs Swedish Family Households with Children
COMPARE
Guamanian/Chamorro
Swedish
Family Households with Children
Family Households with Children Comparison
Guamanians/Chamorros
Swedes
29.7%
FAMILY HOUSEHOLDS WITH CHILDREN
100.0/ 100
METRIC RATING
24th/ 347
METRIC RANK
27.4%
FAMILY HOUSEHOLDS WITH CHILDREN
36.9/ 100
METRIC RATING
193rd/ 347
METRIC RANK
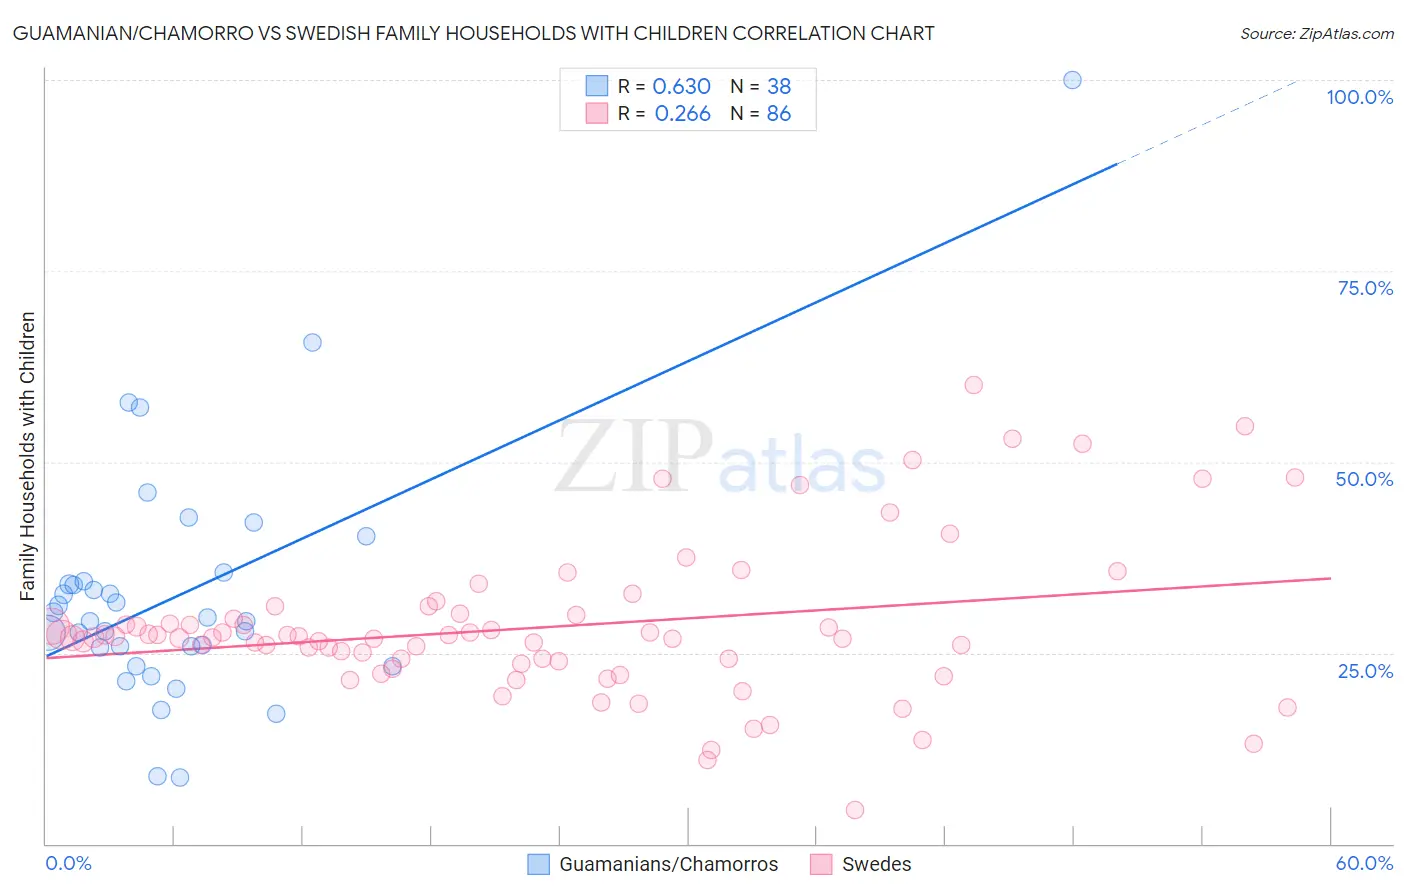
Guamanian/Chamorro vs Swedish Family Households with Children Correlation Chart
The statistical analysis conducted on geographies consisting of 221,827,817 people shows a significant positive correlation between the proportion of Guamanians/Chamorros and percentage of family households with children in the United States with a correlation coefficient (R) of 0.630 and weighted average of 29.7%. Similarly, the statistical analysis conducted on geographies consisting of 538,443,051 people shows a weak positive correlation between the proportion of Swedes and percentage of family households with children in the United States with a correlation coefficient (R) of 0.266 and weighted average of 27.4%, a difference of 8.6%.
Family Households with Children Correlation Summary
| Measurement | Guamanian/Chamorro | Swedish |
| Minimum | 8.6% | 4.4% |
| Maximum | 100.0% | 60.0% |
| Range | 91.4% | 55.6% |
| Mean | 32.8% | 28.4% |
| Median | 29.4% | 27.0% |
| Interquartile 25% (IQ1) | 25.8% | 23.8% |
| Interquartile 75% (IQ3) | 34.4% | 30.0% |
| Interquartile Range (IQR) | 8.7% | 6.2% |
| Standard Deviation (Sample) | 16.3% | 10.0% |
| Standard Deviation (Population) | 16.1% | 10.0% |
Similar Demographics by Family Households with Children
Demographics Similar to Guamanians/Chamorros by Family Households with Children
In terms of family households with children, the demographic groups most similar to Guamanians/Chamorros are Mexican American Indian (29.7%, a difference of 0.10%), Immigrants from Latin America (29.7%, a difference of 0.10%), Malaysian (29.8%, a difference of 0.37%), Immigrants from Laos (29.8%, a difference of 0.41%), and Immigrants from El Salvador (29.8%, a difference of 0.45%).
| Demographics | Rating | Rank | Family Households with Children |
| Hispanics or Latinos | 100.0 /100 | #17 | Exceptional 29.9% |
| Salvadorans | 100.0 /100 | #18 | Exceptional 29.9% |
| Alaska Natives | 100.0 /100 | #19 | Exceptional 29.9% |
| Immigrants | El Salvador | 100.0 /100 | #20 | Exceptional 29.8% |
| Immigrants | Laos | 100.0 /100 | #21 | Exceptional 29.8% |
| Malaysians | 100.0 /100 | #22 | Exceptional 29.8% |
| Mexican American Indians | 100.0 /100 | #23 | Exceptional 29.7% |
| Guamanians/Chamorros | 100.0 /100 | #24 | Exceptional 29.7% |
| Immigrants | Latin America | 100.0 /100 | #25 | Exceptional 29.7% |
| Sri Lankans | 100.0 /100 | #26 | Exceptional 29.5% |
| Immigrants | Vietnam | 100.0 /100 | #27 | Exceptional 29.5% |
| Samoans | 100.0 /100 | #28 | Exceptional 29.5% |
| Bolivians | 100.0 /100 | #29 | Exceptional 29.5% |
| Yuman | 100.0 /100 | #30 | Exceptional 29.5% |
| Japanese | 100.0 /100 | #31 | Exceptional 29.4% |
Demographics Similar to Swedes by Family Households with Children
In terms of family households with children, the demographic groups most similar to Swedes are Immigrants from Israel (27.4%, a difference of 0.020%), Immigrants from Uruguay (27.4%, a difference of 0.020%), Sudanese (27.4%, a difference of 0.020%), Pennsylvania German (27.4%, a difference of 0.020%), and Immigrants from Iran (27.4%, a difference of 0.020%).
| Demographics | Rating | Rank | Family Households with Children |
| Immigrants | Brazil | 40.6 /100 | #186 | Average 27.4% |
| Creek | 39.8 /100 | #187 | Fair 27.4% |
| Dutch | 38.8 /100 | #188 | Fair 27.4% |
| Immigrants | Israel | 37.9 /100 | #189 | Fair 27.4% |
| Immigrants | Uruguay | 37.7 /100 | #190 | Fair 27.4% |
| Sudanese | 37.6 /100 | #191 | Fair 27.4% |
| Pennsylvania Germans | 37.5 /100 | #192 | Fair 27.4% |
| Swedes | 36.9 /100 | #193 | Fair 27.4% |
| Immigrants | Iran | 36.1 /100 | #194 | Fair 27.4% |
| Crow | 35.7 /100 | #195 | Fair 27.4% |
| Cheyenne | 35.1 /100 | #196 | Fair 27.4% |
| Norwegians | 35.0 /100 | #197 | Fair 27.4% |
| Immigrants | Romania | 34.4 /100 | #198 | Fair 27.4% |
| English | 32.0 /100 | #199 | Fair 27.3% |
| Immigrants | Congo | 28.7 /100 | #200 | Fair 27.3% |