Guamanian/Chamorro vs Yaqui Family Households with Children

COMPARE

Guamanian/Chamorro
Race
Ancestry
AfghanAfricanAlaska NativeAlaskan AthabascanAlbanianAleutAlsatianAmericanApacheArabArapahoArgentineanArmenianAssyrian/Chaldean/SyriacAustralianAustrianBahamianBangladeshiBarbadianBasqueBelgianBelizeanBermudanBhutaneseBlackfeetBolivianBrazilianBritishBritish West IndianBulgarianBurmeseCajunCambodianCanadianCape VerdeanCarpatho RusynCelticCentral AmericanCentral American IndianCherokeeCheyenneChickasawChileanChineseChippewaChoctawColombianColvilleComancheCosta RicanCreeCreekCroatianCrowCubanCypriotCzechCzechoslovakianDanishDelawareDominicanDutchDutch West IndianEastern EuropeanEcuadorianEgyptianEnglishEstonianEthiopianEuropeanFijianFilipinoFinnishFrenchFrench American IndianFrench CanadianGermanGerman RussianGhanaianGreekGuamanian/ChamorroGuatemalanGuyaneseHaitianHmongHonduranHopiHoumaHungarianIcelanderIndian (Asian)IndonesianInupiatIranianIraqiIrishIroquoisIsraeliItalianJamaicanJapaneseJordanianKenyanKiowaKoreanLaotianLatvianLebaneseLiberianLithuanianLumbeeLuxembourgerMacedonianMalaysianMalteseMarshalleseMenomineeMexicanMexican American IndianMongolianMoroccanNative HawaiianNavajoNepaleseNew ZealanderNicaraguanNigerianNorthern EuropeanNorwegianOkinawanOsageOttawaPaiutePakistaniPalestinianPanamanianParaguayanPennsylvania GermanPeruvianPimaPolishPortuguesePotawatomiPuebloPuerto RicanPuget Sound SalishRomanianRussianSalvadoranSamoanScandinavianScotch-IrishScottishSeminoleSenegaleseSerbianShoshoneSierra LeoneanSiouxSlavicSlovakSloveneSomaliSouth AfricanSouth AmericanSouth American IndianSoviet UnionSpaniardSpanishSpanish AmericanSpanish American IndianSri LankanSubsaharan AfricanSudaneseSwedishSwissSyrianTaiwaneseThaiTlingit-HaidaTohono O'OdhamTonganTrinidadian and TobagonianTsimshianTurkishU.S. Virgin IslanderUgandanUkrainianUruguayanUteVenezuelanVietnameseWelshWest IndianYakamaYugoslavianYumanYup'ikZimbabwean
Immigration
NonimmigrantsImmigrantsAfghanistanAfricaAlbaniaArgentinaArmeniaAsiaAustraliaAustriaBahamasBangladeshBarbadosBelarusBelgiumBelizeBoliviaBosnia and HerzegovinaBrazilBulgariaBurma/MyanmarCabo VerdeCambodiaCameroonCanadaCaribbeanCentral AmericaChileChinaColombiaCongoCosta RicaCroatiaCubaCzechoslovakiaDenmarkDominicaDominican RepublicEastern AfricaEastern AsiaEastern EuropeEcuadorEgyptEl SalvadorEnglandEritreaEthiopiaEuropeFijiFranceGermanyGhanaGreeceGrenadaGuatemalaGuyanaHaitiHondurasHong KongHungaryIndiaIndonesiaIranIraqIrelandIsraelItalyJamaicaJapanJordanKazakhstanKenyaKoreaKuwaitLaosLatin AmericaLatviaLebanonLiberiaLithuaniaMalaysiaMexicoMicronesiaMiddle AfricaMoldovaMoroccoNepalNetherlandsNicaraguaNigeriaNorth AmericaNorth MacedoniaNorthern AfricaNorthern EuropeNorwayOceaniaPakistanPanamaPeruPhilippinesPolandPortugalRomaniaRussiaSaudi ArabiaScotlandSenegalSerbiaSierra LeoneSingaporeSomaliaSouth AfricaSouth AmericaSouth Central AsiaSouth Eastern AsiaSouthern EuropeSpainSri LankaSt. Vincent and the GrenadinesSudanSwedenSwitzerlandSyriaTaiwanThailandTrinidad and TobagoTurkeyUgandaUkraineUruguayUzbekistanVenezuelaVietnamWest IndiesWestern AfricaWestern AsiaWestern EuropeYemenZaireZimbabweAzores
Yaqui
Race
Ancestry
AfghanAfricanAlaska NativeAlaskan AthabascanAlbanianAleutAlsatianAmericanApacheArabArapahoArgentineanArmenianAssyrian/Chaldean/SyriacAustralianAustrianBahamianBangladeshiBarbadianBasqueBelgianBelizeanBermudanBhutaneseBlackfeetBolivianBrazilianBritishBritish West IndianBulgarianBurmeseCajunCambodianCanadianCape VerdeanCarpatho RusynCelticCentral AmericanCentral American IndianCherokeeCheyenneChickasawChileanChineseChippewaChoctawColombianColvilleComancheCosta RicanCreeCreekCroatianCrowCubanCypriotCzechCzechoslovakianDanishDelawareDominicanDutchDutch West IndianEastern EuropeanEcuadorianEgyptianEnglishEstonianEthiopianEuropeanFijianFilipinoFinnishFrenchFrench American IndianFrench CanadianGermanGerman RussianGhanaianGreekGuatemalanGuyaneseHaitianHmongHonduranHopiHoumaHungarianIcelanderIndian (Asian)IndonesianInupiatIranianIraqiIrishIroquoisIsraeliItalianJamaicanJapaneseJordanianKenyanKiowaKoreanLaotianLatvianLebaneseLiberianLithuanianLumbeeLuxembourgerMacedonianMalaysianMalteseMarshalleseMenomineeMexicanMexican American IndianMongolianMoroccanNative HawaiianNavajoNepaleseNew ZealanderNicaraguanNigerianNorthern EuropeanNorwegianOkinawanOsageOttawaPaiutePakistaniPalestinianPanamanianParaguayanPennsylvania GermanPeruvianPimaPolishPortuguesePotawatomiPuebloPuerto RicanPuget Sound SalishRomanianRussianSalvadoranSamoanScandinavianScotch-IrishScottishSeminoleSenegaleseSerbianShoshoneSierra LeoneanSiouxSlavicSlovakSloveneSomaliSouth AfricanSouth AmericanSouth American IndianSoviet UnionSpaniardSpanishSpanish AmericanSpanish American IndianSri LankanSubsaharan AfricanSudaneseSwedishSwissSyrianTaiwaneseThaiTlingit-HaidaTohono O'OdhamTonganTrinidadian and TobagonianTsimshianTurkishU.S. Virgin IslanderUgandanUkrainianUruguayanUteVenezuelanVietnameseWelshWest IndianYakamaYaquiYugoslavianYumanYup'ikZimbabwean
Immigration
NonimmigrantsImmigrantsAfghanistanAfricaAlbaniaArgentinaArmeniaAsiaAustraliaAustriaBahamasBangladeshBarbadosBelarusBelgiumBelizeBoliviaBosnia and HerzegovinaBrazilBulgariaBurma/MyanmarCabo VerdeCambodiaCameroonCanadaCaribbeanCentral AmericaChileChinaColombiaCongoCosta RicaCroatiaCubaCzechoslovakiaDenmarkDominicaDominican RepublicEastern AfricaEastern AsiaEastern EuropeEcuadorEgyptEl SalvadorEnglandEritreaEthiopiaEuropeFijiFranceGermanyGhanaGreeceGrenadaGuatemalaGuyanaHaitiHondurasHong KongHungaryIndiaIndonesiaIranIraqIrelandIsraelItalyJamaicaJapanJordanKazakhstanKenyaKoreaKuwaitLaosLatin AmericaLatviaLebanonLiberiaLithuaniaMalaysiaMexicoMicronesiaMiddle AfricaMoldovaMoroccoNepalNetherlandsNicaraguaNigeriaNorth AmericaNorth MacedoniaNorthern AfricaNorthern EuropeNorwayOceaniaPakistanPanamaPeruPhilippinesPolandPortugalRomaniaRussiaSaudi ArabiaScotlandSenegalSerbiaSierra LeoneSingaporeSomaliaSouth AfricaSouth AmericaSouth Central AsiaSouth Eastern AsiaSouthern EuropeSpainSri LankaSt. Vincent and the GrenadinesSudanSwedenSwitzerlandSyriaTaiwanThailandTrinidad and TobagoTurkeyUgandaUkraineUruguayUzbekistanVenezuelaVietnamWest IndiesWestern AfricaWestern AsiaWestern EuropeYemenZaireZimbabweAzores
Family Households with Children
Income
Poverty
Unemployment
Labor Participation
Family Structure
Vehicle Availability
Education Level
Disability

Family Households with Children Comparison

Guamanians/Chamorros

Yaqui

Exceptional
Exceptional
29.7%
FAMILY HOUSEHOLDS WITH CHILDREN
100.0/ 100
METRIC RATING
24th/ 347
METRIC RANK
29.1%
FAMILY HOUSEHOLDS WITH CHILDREN
100.0/ 100
METRIC RATING
39th/ 347
METRIC RANK

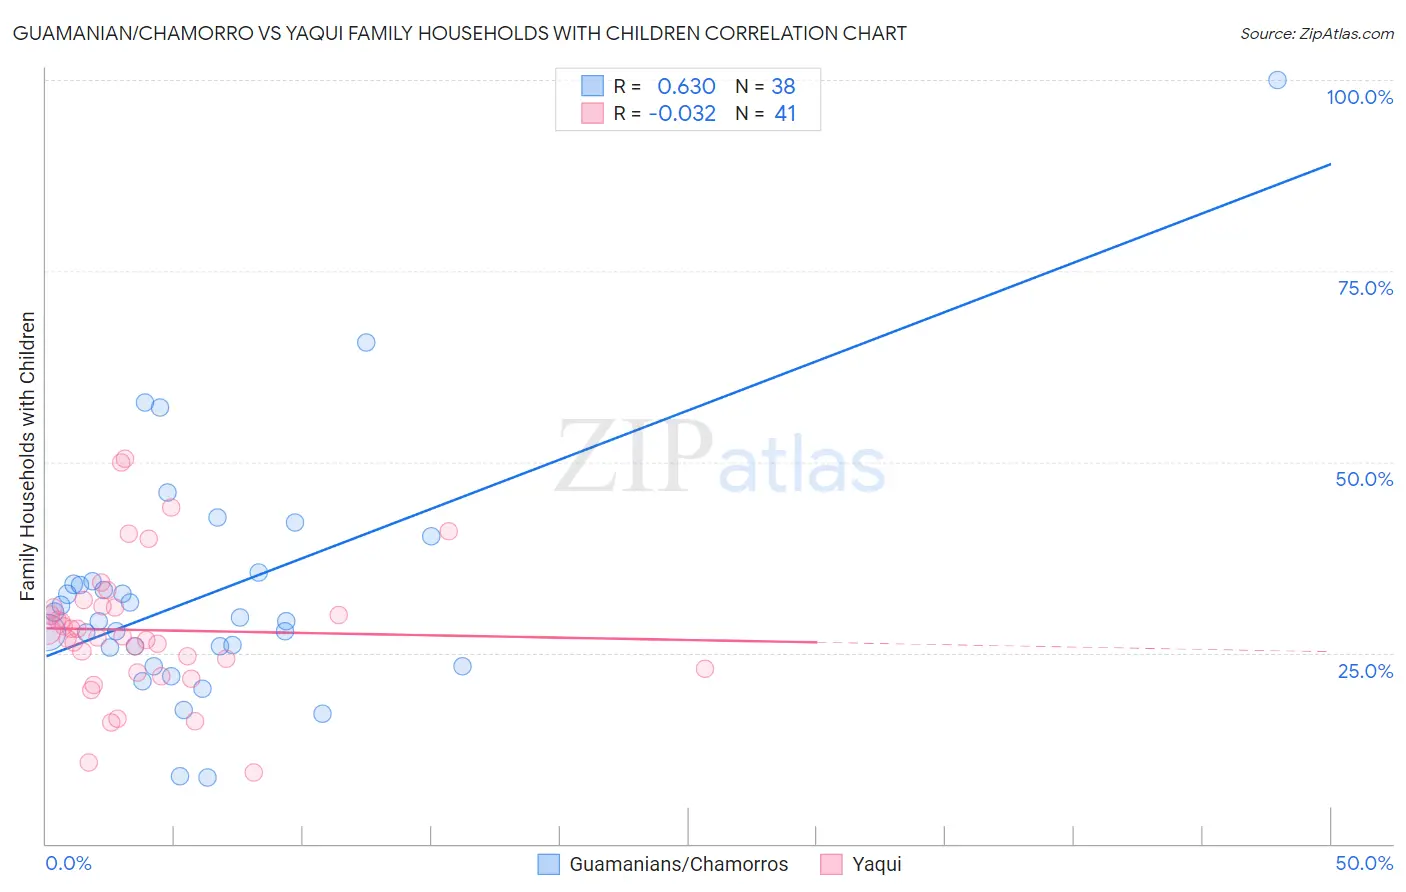
Guamanian/Chamorro vs Yaqui Family Households with Children Correlation Chart

The statistical analysis conducted on geographies consisting of 221,827,817 people shows a significant positive correlation between the proportion of Guamanians/Chamorros and percentage of family households with children in the United States with a correlation coefficient (R) of 0.630 and weighted average of 29.7%. Similarly, the statistical analysis conducted on geographies consisting of 107,712,127 people shows no correlation between the proportion of Yaqui and percentage of family households with children in the United States with a correlation coefficient (R) of -0.032 and weighted average of 29.1%, a difference of 2.0%.
Guamanian/Chamorro vs Yaqui Family Households with Children

Family Households with Children Correlation Summary

MeasurementGuamanian/ChamorroYaqui
Minimum8.6%9.4%
Maximum100.0%50.5%
Range91.4%41.1%
Mean32.8%28.0%
Median29.4%27.2%
Interquartile 25% (IQ1)25.8%22.7%
Interquartile 75% (IQ3)34.4%31.0%
Interquartile Range (IQR)8.7%8.3%
Standard Deviation (Sample)16.3%8.9%
Standard Deviation (Population)16.1%8.8%

Demographics Similar to Guamanians/Chamorros and Yaqui by Family Households with Children

In terms of family households with children, the demographic groups most similar to Guamanians/Chamorros are Mexican American Indian (29.7%, a difference of 0.10%), Immigrants from Latin America (29.7%, a difference of 0.10%), Malaysian (29.8%, a difference of 0.37%), Immigrants from Laos (29.8%, a difference of 0.41%), and Sri Lankan (29.5%, a difference of 0.54%). Similarly, the demographic groups most similar to Yaqui are Central American (29.1%, a difference of 0.010%), Immigrants from South Eastern Asia (29.1%, a difference of 0.10%), Korean (29.2%, a difference of 0.15%), Immigrants from Cameroon (29.2%, a difference of 0.29%), and Immigrants from Venezuela (29.3%, a difference of 0.56%).
DemographicsRating | RankFamily Households with Children
Immigrants | Laos
100.0
/100
|
#21
Exceptional
29.8%
Malaysians
100.0
/100
|
#22
Exceptional
29.8%
Mexican American Indians
100.0
/100
|
#23
Exceptional
29.7%
Guamanians/Chamorros
100.0
/100
|
#24
Exceptional
29.7%
Immigrants | Latin America
100.0
/100
|
#25
Exceptional
29.7%
Sri Lankans
100.0
/100
|
#26
Exceptional
29.5%
Immigrants | Vietnam
100.0
/100
|
#27
Exceptional
29.5%
Samoans
100.0
/100
|
#28
Exceptional
29.5%
Bolivians
100.0
/100
|
#29
Exceptional
29.5%
Yuman
100.0
/100
|
#30
Exceptional
29.5%
Japanese
100.0
/100
|
#31
Exceptional
29.4%
Immigrants | Yemen
100.0
/100
|
#32
Exceptional
29.4%
Venezuelans
100.0
/100
|
#33
Exceptional
29.4%
Immigrants | Bolivia
100.0
/100
|
#34
Exceptional
29.3%
Immigrants | Sierra Leone
100.0
/100
|
#35
Exceptional
29.3%
Immigrants | Venezuela
100.0
/100
|
#36
Exceptional
29.3%
Immigrants | Cameroon
100.0
/100
|
#37
Exceptional
29.2%
Koreans
100.0
/100
|
#38
Exceptional
29.2%
Yaqui
100.0
/100
|
#39
Exceptional
29.1%
Central Americans
100.0
/100
|
#40
Exceptional
29.1%
Immigrants | South Eastern Asia
100.0
/100
|
#41
Exceptional
29.1%