Guamanian/Chamorro vs Immigrants from Croatia Family Households with Children
COMPARE
Guamanian/Chamorro
Immigrants from Croatia
Family Households with Children
Family Households with Children Comparison
Guamanians/Chamorros
Immigrants from Croatia
29.7%
FAMILY HOUSEHOLDS WITH CHILDREN
100.0/ 100
METRIC RATING
24th/ 347
METRIC RANK
25.7%
FAMILY HOUSEHOLDS WITH CHILDREN
0.0/ 100
METRIC RATING
335th/ 347
METRIC RANK
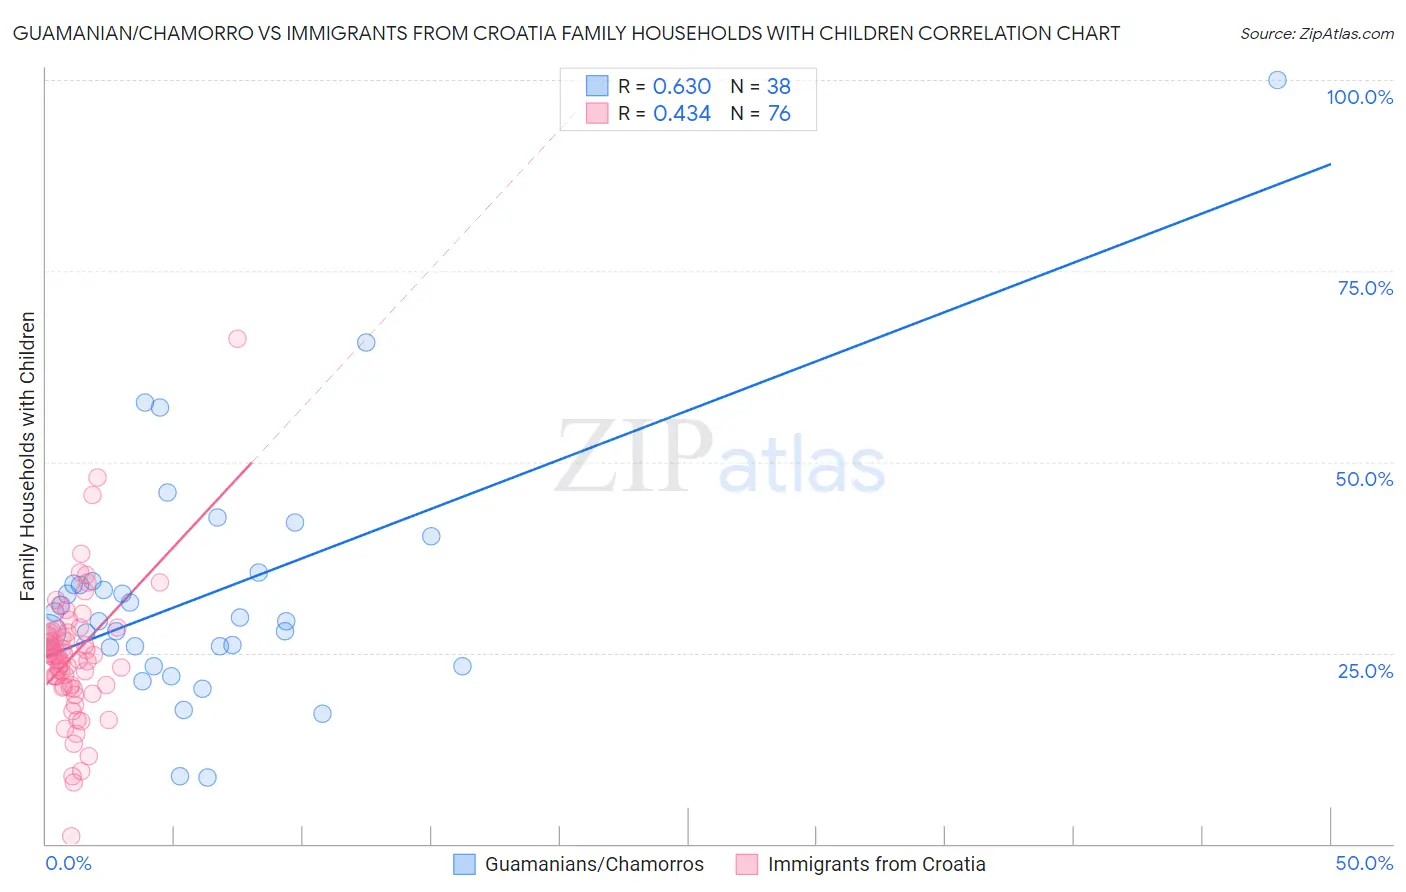
Guamanian/Chamorro vs Immigrants from Croatia Family Households with Children Correlation Chart
The statistical analysis conducted on geographies consisting of 221,827,817 people shows a significant positive correlation between the proportion of Guamanians/Chamorros and percentage of family households with children in the United States with a correlation coefficient (R) of 0.630 and weighted average of 29.7%. Similarly, the statistical analysis conducted on geographies consisting of 132,550,122 people shows a moderate positive correlation between the proportion of Immigrants from Croatia and percentage of family households with children in the United States with a correlation coefficient (R) of 0.434 and weighted average of 25.7%, a difference of 15.6%.
Family Households with Children Correlation Summary
| Measurement | Guamanian/Chamorro | Immigrants from Croatia |
| Minimum | 8.6% | 0.93% |
| Maximum | 100.0% | 66.1% |
| Range | 91.4% | 65.1% |
| Mean | 32.8% | 24.7% |
| Median | 29.4% | 24.6% |
| Interquartile 25% (IQ1) | 25.8% | 20.7% |
| Interquartile 75% (IQ3) | 34.4% | 27.7% |
| Interquartile Range (IQR) | 8.7% | 7.0% |
| Standard Deviation (Sample) | 16.3% | 8.9% |
| Standard Deviation (Population) | 16.1% | 8.9% |
Similar Demographics by Family Households with Children
Demographics Similar to Guamanians/Chamorros by Family Households with Children
In terms of family households with children, the demographic groups most similar to Guamanians/Chamorros are Mexican American Indian (29.7%, a difference of 0.10%), Immigrants from Latin America (29.7%, a difference of 0.10%), Malaysian (29.8%, a difference of 0.37%), Immigrants from Laos (29.8%, a difference of 0.41%), and Immigrants from El Salvador (29.8%, a difference of 0.45%).
| Demographics | Rating | Rank | Family Households with Children |
| Hispanics or Latinos | 100.0 /100 | #17 | Exceptional 29.9% |
| Salvadorans | 100.0 /100 | #18 | Exceptional 29.9% |
| Alaska Natives | 100.0 /100 | #19 | Exceptional 29.9% |
| Immigrants | El Salvador | 100.0 /100 | #20 | Exceptional 29.8% |
| Immigrants | Laos | 100.0 /100 | #21 | Exceptional 29.8% |
| Malaysians | 100.0 /100 | #22 | Exceptional 29.8% |
| Mexican American Indians | 100.0 /100 | #23 | Exceptional 29.7% |
| Guamanians/Chamorros | 100.0 /100 | #24 | Exceptional 29.7% |
| Immigrants | Latin America | 100.0 /100 | #25 | Exceptional 29.7% |
| Sri Lankans | 100.0 /100 | #26 | Exceptional 29.5% |
| Immigrants | Vietnam | 100.0 /100 | #27 | Exceptional 29.5% |
| Samoans | 100.0 /100 | #28 | Exceptional 29.5% |
| Bolivians | 100.0 /100 | #29 | Exceptional 29.5% |
| Yuman | 100.0 /100 | #30 | Exceptional 29.5% |
| Japanese | 100.0 /100 | #31 | Exceptional 29.4% |
Demographics Similar to Immigrants from Croatia by Family Households with Children
In terms of family households with children, the demographic groups most similar to Immigrants from Croatia are Slovak (25.7%, a difference of 0.010%), Immigrants from West Indies (25.7%, a difference of 0.10%), Immigrants from Switzerland (25.7%, a difference of 0.16%), Immigrants from Austria (25.8%, a difference of 0.24%), and Slovene (25.8%, a difference of 0.47%).
| Demographics | Rating | Rank | Family Households with Children |
| Immigrants | Albania | 0.0 /100 | #328 | Tragic 25.9% |
| Cypriots | 0.0 /100 | #329 | Tragic 25.9% |
| Immigrants | Latvia | 0.0 /100 | #330 | Tragic 25.9% |
| Slovenes | 0.0 /100 | #331 | Tragic 25.8% |
| Immigrants | Austria | 0.0 /100 | #332 | Tragic 25.8% |
| Immigrants | Switzerland | 0.0 /100 | #333 | Tragic 25.7% |
| Slovaks | 0.0 /100 | #334 | Tragic 25.7% |
| Immigrants | Croatia | 0.0 /100 | #335 | Tragic 25.7% |
| Immigrants | West Indies | 0.0 /100 | #336 | Tragic 25.7% |
| Puerto Ricans | 0.0 /100 | #337 | Tragic 25.6% |
| Arapaho | 0.0 /100 | #338 | Tragic 25.6% |
| Immigrants | St. Vincent and the Grenadines | 0.0 /100 | #339 | Tragic 25.6% |
| Immigrants | Armenia | 0.0 /100 | #340 | Tragic 25.6% |
| Immigrants | Serbia | 0.0 /100 | #341 | Tragic 25.5% |
| Alsatians | 0.0 /100 | #342 | Tragic 25.3% |