Guamanian/Chamorro vs Blackfeet Family Households with Children
COMPARE
Guamanian/Chamorro
Blackfeet
Family Households with Children
Family Households with Children Comparison
Guamanians/Chamorros
Blackfeet
29.7%
FAMILY HOUSEHOLDS WITH CHILDREN
100.0/ 100
METRIC RATING
24th/ 347
METRIC RANK
27.5%
FAMILY HOUSEHOLDS WITH CHILDREN
54.3/ 100
METRIC RATING
171st/ 347
METRIC RANK
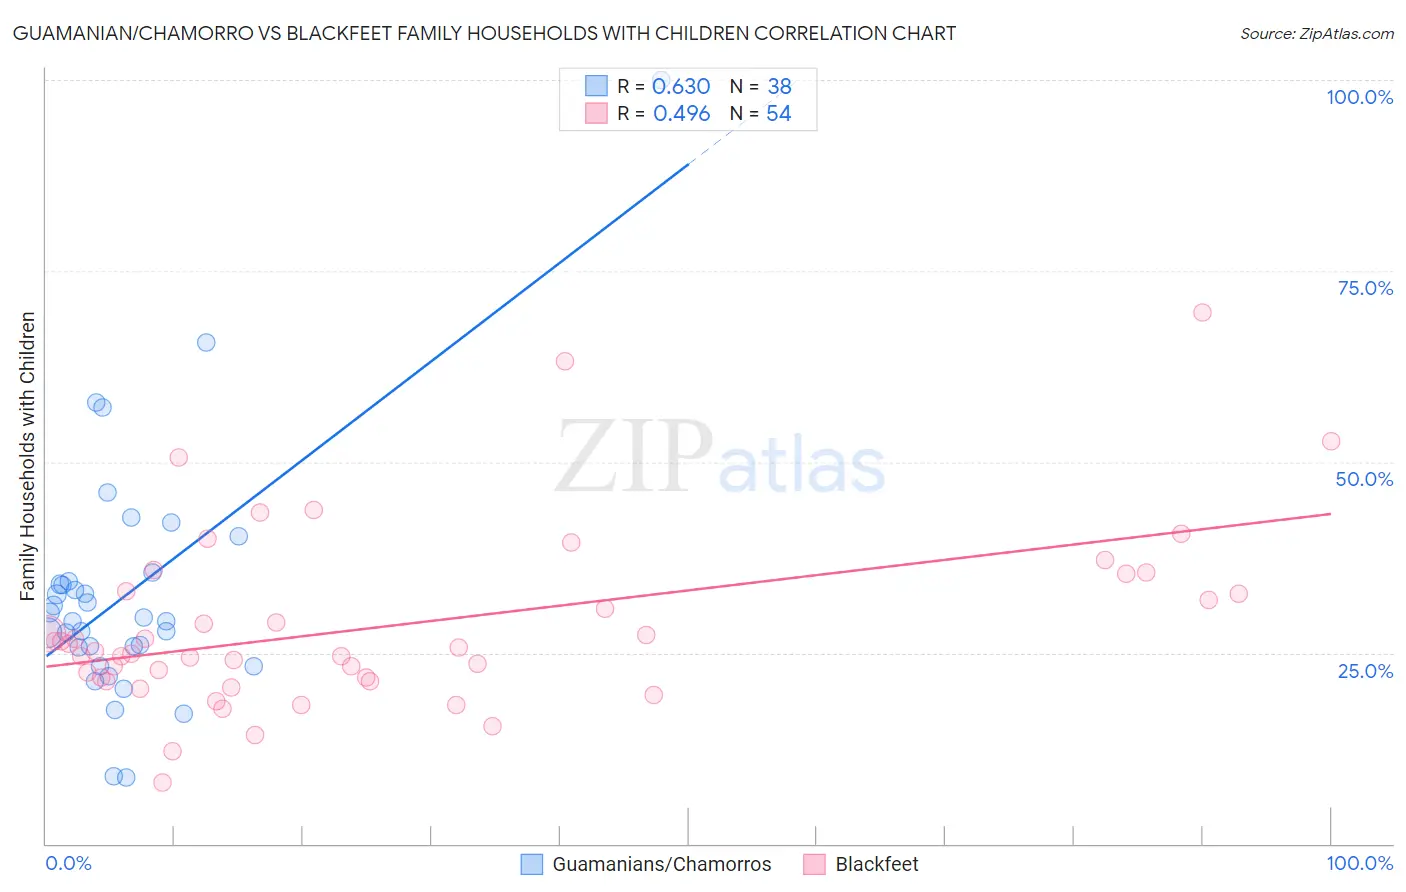
Guamanian/Chamorro vs Blackfeet Family Households with Children Correlation Chart
The statistical analysis conducted on geographies consisting of 221,827,817 people shows a significant positive correlation between the proportion of Guamanians/Chamorros and percentage of family households with children in the United States with a correlation coefficient (R) of 0.630 and weighted average of 29.7%. Similarly, the statistical analysis conducted on geographies consisting of 309,442,274 people shows a moderate positive correlation between the proportion of Blackfeet and percentage of family households with children in the United States with a correlation coefficient (R) of 0.496 and weighted average of 27.5%, a difference of 8.1%.
Family Households with Children Correlation Summary
| Measurement | Guamanian/Chamorro | Blackfeet |
| Minimum | 8.6% | 8.0% |
| Maximum | 100.0% | 69.5% |
| Range | 91.4% | 61.5% |
| Mean | 32.8% | 28.6% |
| Median | 29.4% | 25.4% |
| Interquartile 25% (IQ1) | 25.8% | 21.7% |
| Interquartile 75% (IQ3) | 34.4% | 33.1% |
| Interquartile Range (IQR) | 8.7% | 11.4% |
| Standard Deviation (Sample) | 16.3% | 11.7% |
| Standard Deviation (Population) | 16.1% | 11.6% |
Similar Demographics by Family Households with Children
Demographics Similar to Guamanians/Chamorros by Family Households with Children
In terms of family households with children, the demographic groups most similar to Guamanians/Chamorros are Mexican American Indian (29.7%, a difference of 0.10%), Immigrants from Latin America (29.7%, a difference of 0.10%), Malaysian (29.8%, a difference of 0.37%), Immigrants from Laos (29.8%, a difference of 0.41%), and Immigrants from El Salvador (29.8%, a difference of 0.45%).
| Demographics | Rating | Rank | Family Households with Children |
| Hispanics or Latinos | 100.0 /100 | #17 | Exceptional 29.9% |
| Salvadorans | 100.0 /100 | #18 | Exceptional 29.9% |
| Alaska Natives | 100.0 /100 | #19 | Exceptional 29.9% |
| Immigrants | El Salvador | 100.0 /100 | #20 | Exceptional 29.8% |
| Immigrants | Laos | 100.0 /100 | #21 | Exceptional 29.8% |
| Malaysians | 100.0 /100 | #22 | Exceptional 29.8% |
| Mexican American Indians | 100.0 /100 | #23 | Exceptional 29.7% |
| Guamanians/Chamorros | 100.0 /100 | #24 | Exceptional 29.7% |
| Immigrants | Latin America | 100.0 /100 | #25 | Exceptional 29.7% |
| Sri Lankans | 100.0 /100 | #26 | Exceptional 29.5% |
| Immigrants | Vietnam | 100.0 /100 | #27 | Exceptional 29.5% |
| Samoans | 100.0 /100 | #28 | Exceptional 29.5% |
| Bolivians | 100.0 /100 | #29 | Exceptional 29.5% |
| Yuman | 100.0 /100 | #30 | Exceptional 29.5% |
| Japanese | 100.0 /100 | #31 | Exceptional 29.4% |
Demographics Similar to Blackfeet by Family Households with Children
In terms of family households with children, the demographic groups most similar to Blackfeet are Israeli (27.5%, a difference of 0.010%), Cherokee (27.5%, a difference of 0.050%), Immigrants from Argentina (27.5%, a difference of 0.050%), Seminole (27.5%, a difference of 0.060%), and White/Caucasian (27.4%, a difference of 0.090%).
| Demographics | Rating | Rank | Family Households with Children |
| Immigrants | Hong Kong | 64.9 /100 | #164 | Good 27.5% |
| Immigrants | South Africa | 61.3 /100 | #165 | Good 27.5% |
| Immigrants | Nonimmigrants | 61.2 /100 | #166 | Good 27.5% |
| Dominicans | 61.1 /100 | #167 | Good 27.5% |
| Immigrants | Kuwait | 60.9 /100 | #168 | Good 27.5% |
| Seminole | 56.9 /100 | #169 | Average 27.5% |
| Cherokee | 56.7 /100 | #170 | Average 27.5% |
| Blackfeet | 54.3 /100 | #171 | Average 27.5% |
| Israelis | 53.9 /100 | #172 | Average 27.5% |
| Immigrants | Argentina | 52.2 /100 | #173 | Average 27.5% |
| Whites/Caucasians | 50.0 /100 | #174 | Average 27.4% |
| British | 49.9 /100 | #175 | Average 27.4% |
| Immigrants | China | 49.6 /100 | #176 | Average 27.4% |
| Ugandans | 49.2 /100 | #177 | Average 27.4% |
| Spanish Americans | 48.9 /100 | #178 | Average 27.4% |