Guamanian/Chamorro vs Immigrants from Liberia Family Households with Children
COMPARE
Guamanian/Chamorro
Immigrants from Liberia
Family Households with Children
Family Households with Children Comparison
Guamanians/Chamorros
Immigrants from Liberia
29.7%
FAMILY HOUSEHOLDS WITH CHILDREN
100.0/ 100
METRIC RATING
24th/ 347
METRIC RANK
28.2%
FAMILY HOUSEHOLDS WITH CHILDREN
99.4/ 100
METRIC RATING
91st/ 347
METRIC RANK
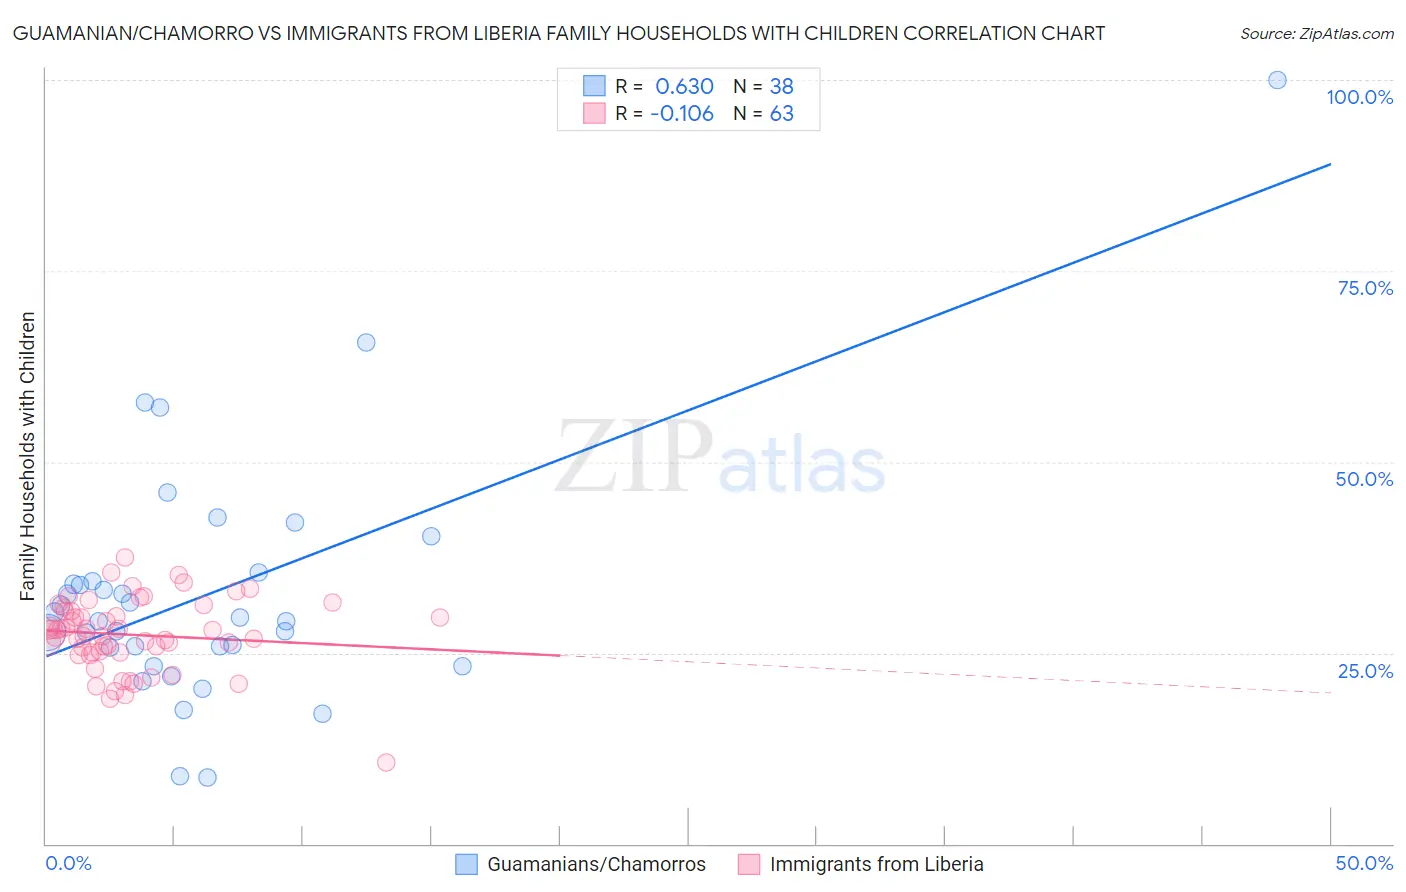
Guamanian/Chamorro vs Immigrants from Liberia Family Households with Children Correlation Chart
The statistical analysis conducted on geographies consisting of 221,827,817 people shows a significant positive correlation between the proportion of Guamanians/Chamorros and percentage of family households with children in the United States with a correlation coefficient (R) of 0.630 and weighted average of 29.7%. Similarly, the statistical analysis conducted on geographies consisting of 135,222,977 people shows a poor negative correlation between the proportion of Immigrants from Liberia and percentage of family households with children in the United States with a correlation coefficient (R) of -0.106 and weighted average of 28.2%, a difference of 5.2%.
Family Households with Children Correlation Summary
| Measurement | Guamanian/Chamorro | Immigrants from Liberia |
| Minimum | 8.6% | 10.6% |
| Maximum | 100.0% | 37.5% |
| Range | 91.4% | 26.9% |
| Mean | 32.8% | 27.4% |
| Median | 29.4% | 28.0% |
| Interquartile 25% (IQ1) | 25.8% | 25.1% |
| Interquartile 75% (IQ3) | 34.4% | 30.4% |
| Interquartile Range (IQR) | 8.7% | 5.4% |
| Standard Deviation (Sample) | 16.3% | 4.7% |
| Standard Deviation (Population) | 16.1% | 4.7% |
Similar Demographics by Family Households with Children
Demographics Similar to Guamanians/Chamorros by Family Households with Children
In terms of family households with children, the demographic groups most similar to Guamanians/Chamorros are Mexican American Indian (29.7%, a difference of 0.10%), Immigrants from Latin America (29.7%, a difference of 0.10%), Malaysian (29.8%, a difference of 0.37%), Immigrants from Laos (29.8%, a difference of 0.41%), and Immigrants from El Salvador (29.8%, a difference of 0.45%).
| Demographics | Rating | Rank | Family Households with Children |
| Hispanics or Latinos | 100.0 /100 | #17 | Exceptional 29.9% |
| Salvadorans | 100.0 /100 | #18 | Exceptional 29.9% |
| Alaska Natives | 100.0 /100 | #19 | Exceptional 29.9% |
| Immigrants | El Salvador | 100.0 /100 | #20 | Exceptional 29.8% |
| Immigrants | Laos | 100.0 /100 | #21 | Exceptional 29.8% |
| Malaysians | 100.0 /100 | #22 | Exceptional 29.8% |
| Mexican American Indians | 100.0 /100 | #23 | Exceptional 29.7% |
| Guamanians/Chamorros | 100.0 /100 | #24 | Exceptional 29.7% |
| Immigrants | Latin America | 100.0 /100 | #25 | Exceptional 29.7% |
| Sri Lankans | 100.0 /100 | #26 | Exceptional 29.5% |
| Immigrants | Vietnam | 100.0 /100 | #27 | Exceptional 29.5% |
| Samoans | 100.0 /100 | #28 | Exceptional 29.5% |
| Bolivians | 100.0 /100 | #29 | Exceptional 29.5% |
| Yuman | 100.0 /100 | #30 | Exceptional 29.5% |
| Japanese | 100.0 /100 | #31 | Exceptional 29.4% |
Demographics Similar to Immigrants from Liberia by Family Households with Children
In terms of family households with children, the demographic groups most similar to Immigrants from Liberia are Chickasaw (28.2%, a difference of 0.020%), Immigrants from Thailand (28.2%, a difference of 0.050%), Panamanian (28.2%, a difference of 0.13%), Liberian (28.3%, a difference of 0.16%), and Immigrants from Costa Rica (28.3%, a difference of 0.16%).
| Demographics | Rating | Rank | Family Households with Children |
| Costa Ricans | 99.8 /100 | #84 | Exceptional 28.4% |
| Immigrants | Syria | 99.8 /100 | #85 | Exceptional 28.4% |
| Immigrants | Western Africa | 99.6 /100 | #86 | Exceptional 28.3% |
| Colombians | 99.6 /100 | #87 | Exceptional 28.3% |
| Liberians | 99.6 /100 | #88 | Exceptional 28.3% |
| Immigrants | Costa Rica | 99.6 /100 | #89 | Exceptional 28.3% |
| Immigrants | Thailand | 99.5 /100 | #90 | Exceptional 28.2% |
| Immigrants | Liberia | 99.4 /100 | #91 | Exceptional 28.2% |
| Chickasaw | 99.4 /100 | #92 | Exceptional 28.2% |
| Panamanians | 99.3 /100 | #93 | Exceptional 28.2% |
| Immigrants | Colombia | 99.2 /100 | #94 | Exceptional 28.2% |
| Immigrants | Nicaragua | 99.1 /100 | #95 | Exceptional 28.2% |
| Ute | 99.1 /100 | #96 | Exceptional 28.2% |
| Chileans | 98.9 /100 | #97 | Exceptional 28.1% |
| Immigrants | Kenya | 98.9 /100 | #98 | Exceptional 28.1% |