Guamanian/Chamorro vs Pakistani Family Households with Children
COMPARE
Guamanian/Chamorro
Pakistani
Family Households with Children
Family Households with Children Comparison
Guamanians/Chamorros
Pakistanis
29.7%
FAMILY HOUSEHOLDS WITH CHILDREN
100.0/ 100
METRIC RATING
24th/ 347
METRIC RANK
27.9%
FAMILY HOUSEHOLDS WITH CHILDREN
96.0/ 100
METRIC RATING
116th/ 347
METRIC RANK
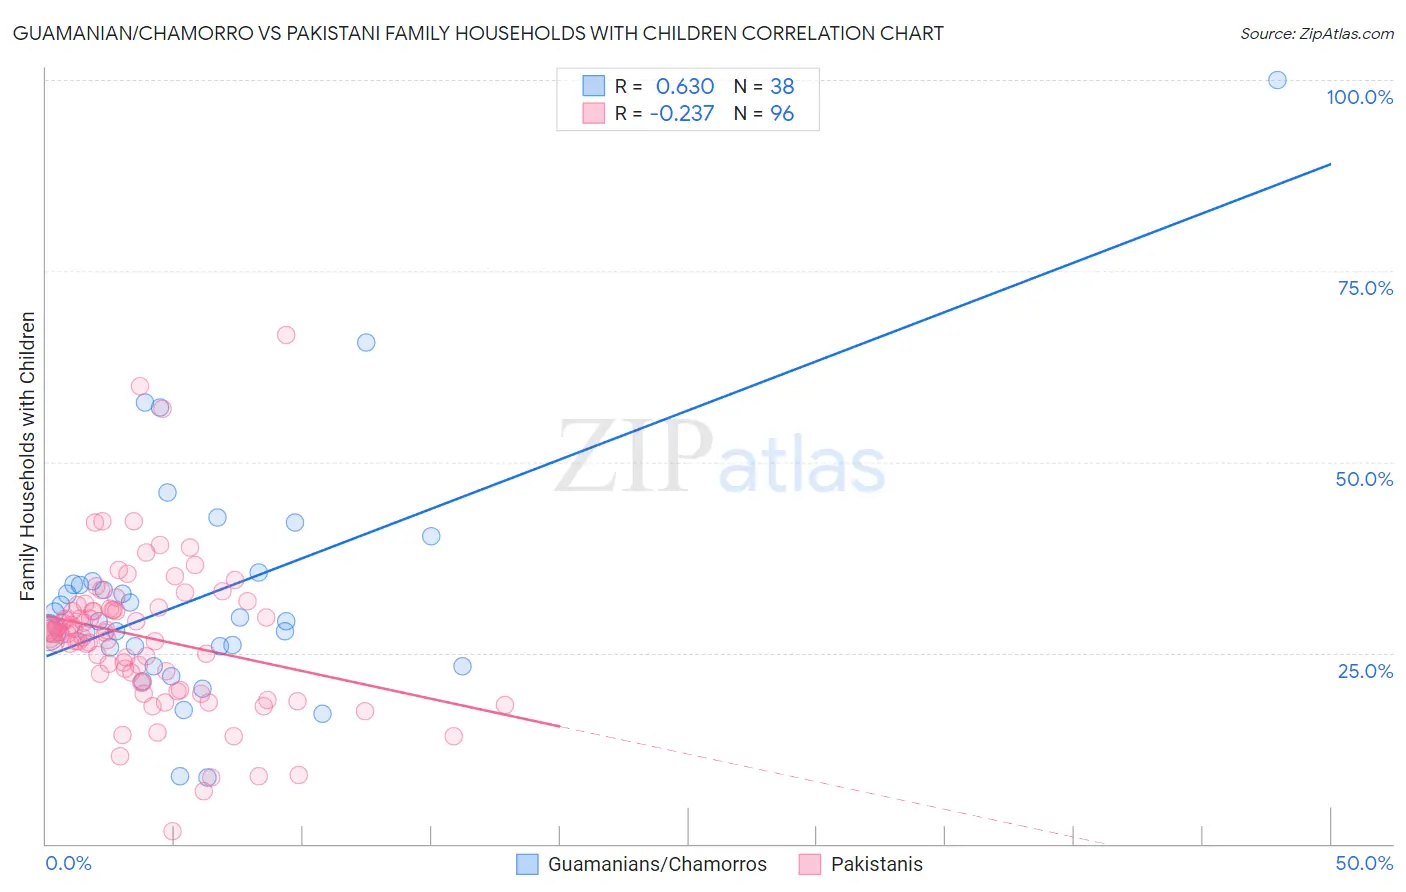
Guamanian/Chamorro vs Pakistani Family Households with Children Correlation Chart
The statistical analysis conducted on geographies consisting of 221,827,817 people shows a significant positive correlation between the proportion of Guamanians/Chamorros and percentage of family households with children in the United States with a correlation coefficient (R) of 0.630 and weighted average of 29.7%. Similarly, the statistical analysis conducted on geographies consisting of 335,080,458 people shows a weak negative correlation between the proportion of Pakistanis and percentage of family households with children in the United States with a correlation coefficient (R) of -0.237 and weighted average of 27.9%, a difference of 6.4%.
Family Households with Children Correlation Summary
| Measurement | Guamanian/Chamorro | Pakistani |
| Minimum | 8.6% | 1.7% |
| Maximum | 100.0% | 66.6% |
| Range | 91.4% | 64.9% |
| Mean | 32.8% | 27.1% |
| Median | 29.4% | 27.7% |
| Interquartile 25% (IQ1) | 25.8% | 21.8% |
| Interquartile 75% (IQ3) | 34.4% | 30.7% |
| Interquartile Range (IQR) | 8.7% | 9.0% |
| Standard Deviation (Sample) | 16.3% | 9.9% |
| Standard Deviation (Population) | 16.1% | 9.9% |
Similar Demographics by Family Households with Children
Demographics Similar to Guamanians/Chamorros by Family Households with Children
In terms of family households with children, the demographic groups most similar to Guamanians/Chamorros are Mexican American Indian (29.7%, a difference of 0.10%), Immigrants from Latin America (29.7%, a difference of 0.10%), Malaysian (29.8%, a difference of 0.37%), Immigrants from Laos (29.8%, a difference of 0.41%), and Immigrants from El Salvador (29.8%, a difference of 0.45%).
| Demographics | Rating | Rank | Family Households with Children |
| Hispanics or Latinos | 100.0 /100 | #17 | Exceptional 29.9% |
| Salvadorans | 100.0 /100 | #18 | Exceptional 29.9% |
| Alaska Natives | 100.0 /100 | #19 | Exceptional 29.9% |
| Immigrants | El Salvador | 100.0 /100 | #20 | Exceptional 29.8% |
| Immigrants | Laos | 100.0 /100 | #21 | Exceptional 29.8% |
| Malaysians | 100.0 /100 | #22 | Exceptional 29.8% |
| Mexican American Indians | 100.0 /100 | #23 | Exceptional 29.7% |
| Guamanians/Chamorros | 100.0 /100 | #24 | Exceptional 29.7% |
| Immigrants | Latin America | 100.0 /100 | #25 | Exceptional 29.7% |
| Sri Lankans | 100.0 /100 | #26 | Exceptional 29.5% |
| Immigrants | Vietnam | 100.0 /100 | #27 | Exceptional 29.5% |
| Samoans | 100.0 /100 | #28 | Exceptional 29.5% |
| Bolivians | 100.0 /100 | #29 | Exceptional 29.5% |
| Yuman | 100.0 /100 | #30 | Exceptional 29.5% |
| Japanese | 100.0 /100 | #31 | Exceptional 29.4% |
Demographics Similar to Pakistanis by Family Households with Children
In terms of family households with children, the demographic groups most similar to Pakistanis are Immigrants from Malaysia (27.9%, a difference of 0.010%), Central American Indian (27.9%, a difference of 0.010%), Zimbabwean (27.9%, a difference of 0.050%), European (27.9%, a difference of 0.080%), and Immigrants from Africa (28.0%, a difference of 0.13%).
| Demographics | Rating | Rank | Family Households with Children |
| Tohono O'odham | 97.6 /100 | #109 | Exceptional 28.0% |
| Spaniards | 97.4 /100 | #110 | Exceptional 28.0% |
| Scandinavians | 97.1 /100 | #111 | Exceptional 28.0% |
| Immigrants | Middle Africa | 97.0 /100 | #112 | Exceptional 28.0% |
| Arabs | 97.0 /100 | #113 | Exceptional 28.0% |
| South American Indians | 96.9 /100 | #114 | Exceptional 28.0% |
| Immigrants | Africa | 96.8 /100 | #115 | Exceptional 28.0% |
| Pakistanis | 96.0 /100 | #116 | Exceptional 27.9% |
| Immigrants | Malaysia | 95.9 /100 | #117 | Exceptional 27.9% |
| Central American Indians | 95.9 /100 | #118 | Exceptional 27.9% |
| Zimbabweans | 95.6 /100 | #119 | Exceptional 27.9% |
| Europeans | 95.4 /100 | #120 | Exceptional 27.9% |
| Immigrants | Western Asia | 93.6 /100 | #121 | Exceptional 27.9% |
| Immigrants | Zimbabwe | 92.8 /100 | #122 | Exceptional 27.8% |
| Immigrants | Northern Africa | 91.8 /100 | #123 | Exceptional 27.8% |