Guamanian/Chamorro vs Taiwanese Family Households with Children
COMPARE
Guamanian/Chamorro
Taiwanese
Family Households with Children
Family Households with Children Comparison
Guamanians/Chamorros
Taiwanese
29.7%
FAMILY HOUSEHOLDS WITH CHILDREN
100.0/ 100
METRIC RATING
24th/ 347
METRIC RANK
26.7%
FAMILY HOUSEHOLDS WITH CHILDREN
0.9/ 100
METRIC RATING
264th/ 347
METRIC RANK
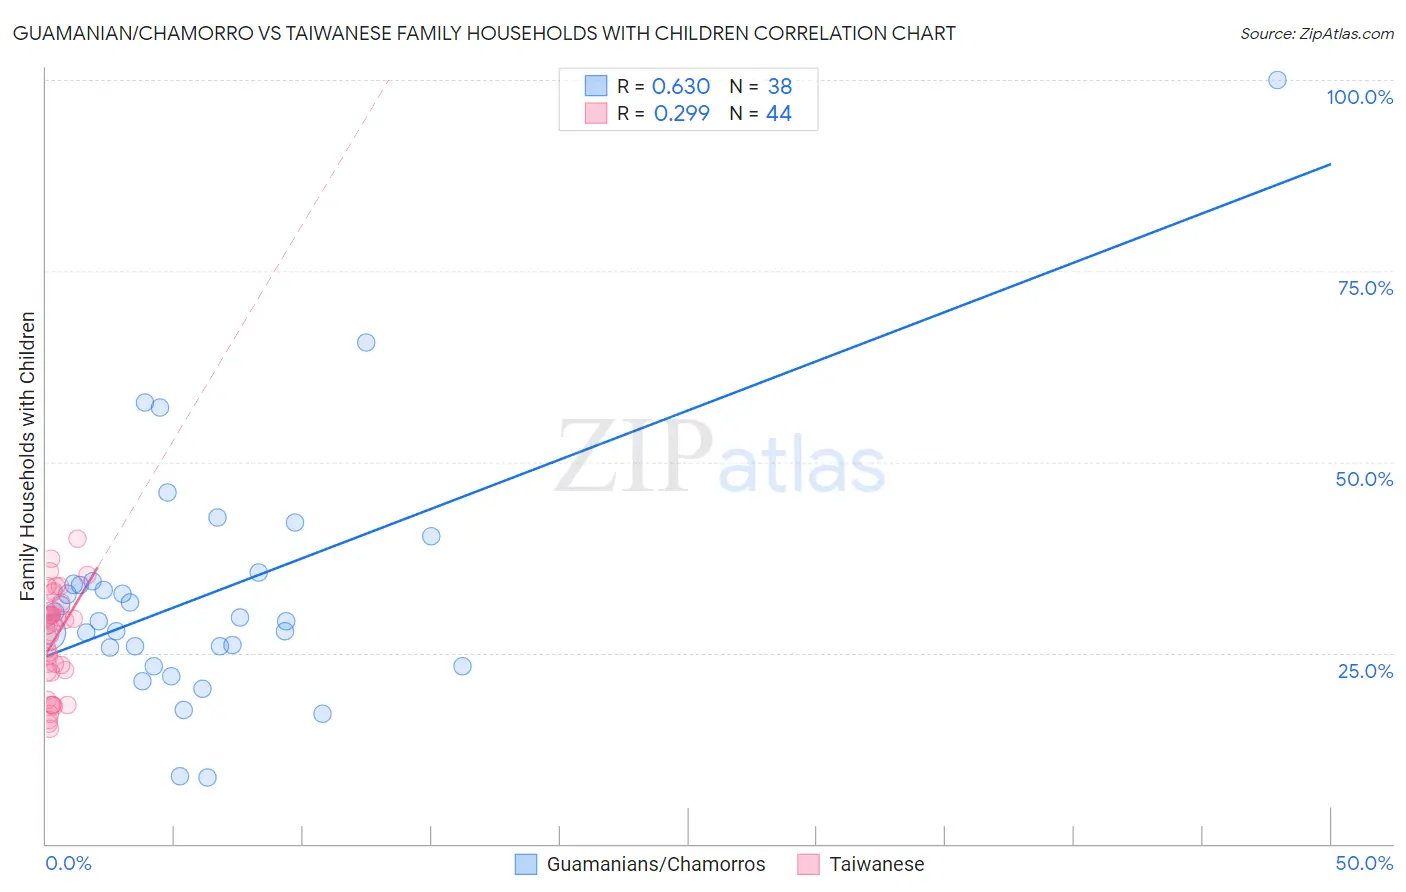
Guamanian/Chamorro vs Taiwanese Family Households with Children Correlation Chart
The statistical analysis conducted on geographies consisting of 221,827,817 people shows a significant positive correlation between the proportion of Guamanians/Chamorros and percentage of family households with children in the United States with a correlation coefficient (R) of 0.630 and weighted average of 29.7%. Similarly, the statistical analysis conducted on geographies consisting of 31,709,765 people shows a weak positive correlation between the proportion of Taiwanese and percentage of family households with children in the United States with a correlation coefficient (R) of 0.299 and weighted average of 26.7%, a difference of 11.1%.
Family Households with Children Correlation Summary
| Measurement | Guamanian/Chamorro | Taiwanese |
| Minimum | 8.6% | 15.0% |
| Maximum | 100.0% | 39.9% |
| Range | 91.4% | 24.9% |
| Mean | 32.8% | 26.7% |
| Median | 29.4% | 28.5% |
| Interquartile 25% (IQ1) | 25.8% | 22.5% |
| Interquartile 75% (IQ3) | 34.4% | 30.5% |
| Interquartile Range (IQR) | 8.7% | 8.0% |
| Standard Deviation (Sample) | 16.3% | 6.4% |
| Standard Deviation (Population) | 16.1% | 6.4% |
Similar Demographics by Family Households with Children
Demographics Similar to Guamanians/Chamorros by Family Households with Children
In terms of family households with children, the demographic groups most similar to Guamanians/Chamorros are Mexican American Indian (29.7%, a difference of 0.10%), Immigrants from Latin America (29.7%, a difference of 0.10%), Malaysian (29.8%, a difference of 0.37%), Immigrants from Laos (29.8%, a difference of 0.41%), and Immigrants from El Salvador (29.8%, a difference of 0.45%).
| Demographics | Rating | Rank | Family Households with Children |
| Hispanics or Latinos | 100.0 /100 | #17 | Exceptional 29.9% |
| Salvadorans | 100.0 /100 | #18 | Exceptional 29.9% |
| Alaska Natives | 100.0 /100 | #19 | Exceptional 29.9% |
| Immigrants | El Salvador | 100.0 /100 | #20 | Exceptional 29.8% |
| Immigrants | Laos | 100.0 /100 | #21 | Exceptional 29.8% |
| Malaysians | 100.0 /100 | #22 | Exceptional 29.8% |
| Mexican American Indians | 100.0 /100 | #23 | Exceptional 29.7% |
| Guamanians/Chamorros | 100.0 /100 | #24 | Exceptional 29.7% |
| Immigrants | Latin America | 100.0 /100 | #25 | Exceptional 29.7% |
| Sri Lankans | 100.0 /100 | #26 | Exceptional 29.5% |
| Immigrants | Vietnam | 100.0 /100 | #27 | Exceptional 29.5% |
| Samoans | 100.0 /100 | #28 | Exceptional 29.5% |
| Bolivians | 100.0 /100 | #29 | Exceptional 29.5% |
| Yuman | 100.0 /100 | #30 | Exceptional 29.5% |
| Japanese | 100.0 /100 | #31 | Exceptional 29.4% |
Demographics Similar to Taiwanese by Family Households with Children
In terms of family households with children, the demographic groups most similar to Taiwanese are Chippewa (26.7%, a difference of 0.010%), Maltese (26.7%, a difference of 0.010%), Immigrants from Uzbekistan (26.7%, a difference of 0.010%), Immigrants from Belgium (26.7%, a difference of 0.020%), and Immigrants from North Macedonia (26.7%, a difference of 0.030%).
| Demographics | Rating | Rank | Family Households with Children |
| Slavs | 1.3 /100 | #257 | Tragic 26.8% |
| Immigrants | Cuba | 1.3 /100 | #258 | Tragic 26.8% |
| Immigrants | Lithuania | 1.2 /100 | #259 | Tragic 26.8% |
| Immigrants | Jamaica | 1.2 /100 | #260 | Tragic 26.8% |
| Immigrants | Belarus | 1.1 /100 | #261 | Tragic 26.8% |
| Immigrants | Russia | 1.0 /100 | #262 | Tragic 26.8% |
| Immigrants | North Macedonia | 1.0 /100 | #263 | Tragic 26.7% |
| Taiwanese | 0.9 /100 | #264 | Tragic 26.7% |
| Chippewa | 0.9 /100 | #265 | Tragic 26.7% |
| Maltese | 0.9 /100 | #266 | Tragic 26.7% |
| Immigrants | Uzbekistan | 0.9 /100 | #267 | Tragic 26.7% |
| Immigrants | Belgium | 0.9 /100 | #268 | Tragic 26.7% |
| Immigrants | Denmark | 0.8 /100 | #269 | Tragic 26.7% |
| Immigrants | Zaire | 0.7 /100 | #270 | Tragic 26.7% |
| French | 0.7 /100 | #271 | Tragic 26.7% |