Guamanian/Chamorro vs Turkish Disability Age 18 to 34
COMPARE
Guamanian/Chamorro
Turkish
Disability Age 18 to 34
Disability Age 18 to 34 Comparison
Guamanians/Chamorros
Turks
7.2%
DISABILITY AGE 18 TO 34
0.8/ 100
METRIC RATING
248th/ 347
METRIC RANK
6.2%
DISABILITY AGE 18 TO 34
97.8/ 100
METRIC RATING
89th/ 347
METRIC RANK
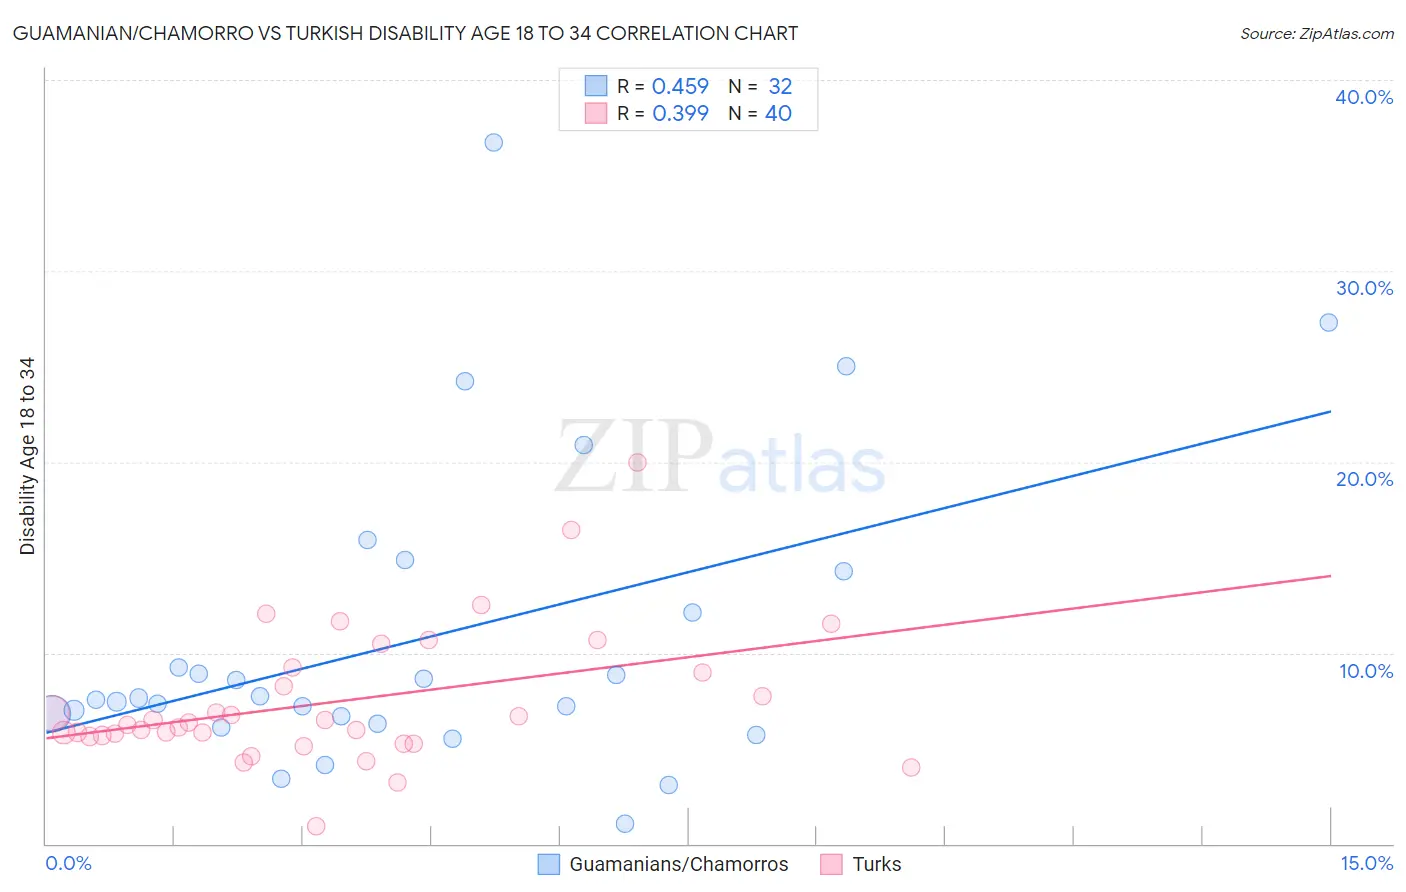
Guamanian/Chamorro vs Turkish Disability Age 18 to 34 Correlation Chart
The statistical analysis conducted on geographies consisting of 221,642,972 people shows a moderate positive correlation between the proportion of Guamanians/Chamorros and percentage of population with a disability between the ages 18 and 35 in the United States with a correlation coefficient (R) of 0.459 and weighted average of 7.2%. Similarly, the statistical analysis conducted on geographies consisting of 271,484,805 people shows a mild positive correlation between the proportion of Turks and percentage of population with a disability between the ages 18 and 35 in the United States with a correlation coefficient (R) of 0.399 and weighted average of 6.2%, a difference of 16.1%.
Disability Age 18 to 34 Correlation Summary
| Measurement | Guamanian/Chamorro | Turkish |
| Minimum | 1.0% | 0.89% |
| Maximum | 36.7% | 20.0% |
| Range | 35.7% | 19.1% |
| Mean | 10.7% | 7.4% |
| Median | 7.6% | 6.3% |
| Interquartile 25% (IQ1) | 6.5% | 5.6% |
| Interquartile 75% (IQ3) | 13.2% | 9.1% |
| Interquartile Range (IQR) | 6.7% | 3.5% |
| Standard Deviation (Sample) | 8.0% | 3.6% |
| Standard Deviation (Population) | 7.9% | 3.6% |
Similar Demographics by Disability Age 18 to 34
Demographics Similar to Guamanians/Chamorros by Disability Age 18 to 34
In terms of disability age 18 to 34, the demographic groups most similar to Guamanians/Chamorros are Yugoslavian (7.2%, a difference of 0.040%), Malaysian (7.2%, a difference of 0.10%), Immigrants from Liberia (7.1%, a difference of 0.18%), Hungarian (7.1%, a difference of 0.20%), and Immigrants from Zaire (7.1%, a difference of 0.31%).
| Demographics | Rating | Rank | Disability Age 18 to 34 |
| Nepalese | 1.1 /100 | #241 | Tragic 7.1% |
| Immigrants | Congo | 1.1 /100 | #242 | Tragic 7.1% |
| Icelanders | 1.0 /100 | #243 | Tragic 7.1% |
| Immigrants | Zaire | 0.9 /100 | #244 | Tragic 7.1% |
| Hungarians | 0.9 /100 | #245 | Tragic 7.1% |
| Immigrants | Liberia | 0.8 /100 | #246 | Tragic 7.1% |
| Yugoslavians | 0.8 /100 | #247 | Tragic 7.2% |
| Guamanians/Chamorros | 0.8 /100 | #248 | Tragic 7.2% |
| Malaysians | 0.7 /100 | #249 | Tragic 7.2% |
| Fijians | 0.6 /100 | #250 | Tragic 7.2% |
| Spaniards | 0.6 /100 | #251 | Tragic 7.2% |
| Poles | 0.6 /100 | #252 | Tragic 7.2% |
| Croatians | 0.5 /100 | #253 | Tragic 7.2% |
| Indonesians | 0.4 /100 | #254 | Tragic 7.2% |
| Immigrants | Germany | 0.4 /100 | #255 | Tragic 7.2% |
Demographics Similar to Turks by Disability Age 18 to 34
In terms of disability age 18 to 34, the demographic groups most similar to Turks are Immigrants from Vietnam (6.2%, a difference of 0.040%), Cambodian (6.2%, a difference of 0.060%), Immigrants from Eastern Europe (6.2%, a difference of 0.090%), Immigrants from Philippines (6.2%, a difference of 0.11%), and Jordanian (6.2%, a difference of 0.16%).
| Demographics | Rating | Rank | Disability Age 18 to 34 |
| Immigrants | Northern Africa | 98.4 /100 | #82 | Exceptional 6.1% |
| Barbadians | 98.3 /100 | #83 | Exceptional 6.1% |
| Israelis | 98.3 /100 | #84 | Exceptional 6.1% |
| Immigrants | Ireland | 98.2 /100 | #85 | Exceptional 6.1% |
| Immigrants | Kuwait | 98.0 /100 | #86 | Exceptional 6.2% |
| Immigrants | Eastern Europe | 97.9 /100 | #87 | Exceptional 6.2% |
| Cambodians | 97.8 /100 | #88 | Exceptional 6.2% |
| Turks | 97.8 /100 | #89 | Exceptional 6.2% |
| Immigrants | Vietnam | 97.7 /100 | #90 | Exceptional 6.2% |
| Immigrants | Philippines | 97.6 /100 | #91 | Exceptional 6.2% |
| Jordanians | 97.6 /100 | #92 | Exceptional 6.2% |
| Immigrants | Immigrants | 97.6 /100 | #93 | Exceptional 6.2% |
| Immigrants | Kazakhstan | 97.5 /100 | #94 | Exceptional 6.2% |
| Central Americans | 97.5 /100 | #95 | Exceptional 6.2% |
| Immigrants | Uruguay | 97.4 /100 | #96 | Exceptional 6.2% |