Guamanian/Chamorro vs Peruvian Disability Age 18 to 34
COMPARE
Guamanian/Chamorro
Peruvian
Disability Age 18 to 34
Disability Age 18 to 34 Comparison
Guamanians/Chamorros
Peruvians
7.2%
DISABILITY AGE 18 TO 34
0.8/ 100
METRIC RATING
248th/ 347
METRIC RANK
6.0%
DISABILITY AGE 18 TO 34
99.6/ 100
METRIC RATING
62nd/ 347
METRIC RANK
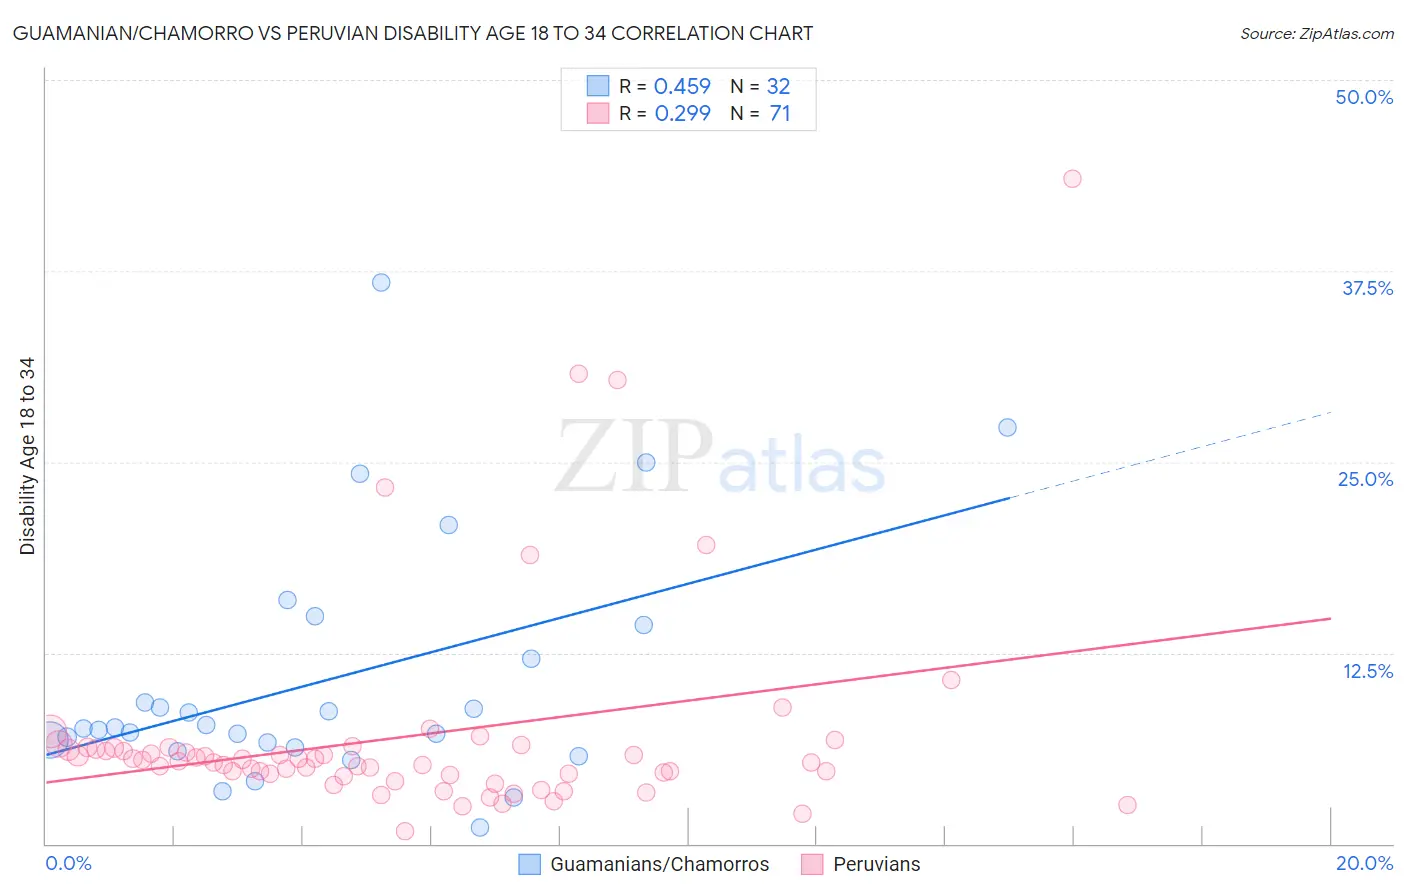
Guamanian/Chamorro vs Peruvian Disability Age 18 to 34 Correlation Chart
The statistical analysis conducted on geographies consisting of 221,642,972 people shows a moderate positive correlation between the proportion of Guamanians/Chamorros and percentage of population with a disability between the ages 18 and 35 in the United States with a correlation coefficient (R) of 0.459 and weighted average of 7.2%. Similarly, the statistical analysis conducted on geographies consisting of 362,638,552 people shows a weak positive correlation between the proportion of Peruvians and percentage of population with a disability between the ages 18 and 35 in the United States with a correlation coefficient (R) of 0.299 and weighted average of 6.0%, a difference of 19.8%.
Disability Age 18 to 34 Correlation Summary
| Measurement | Guamanian/Chamorro | Peruvian |
| Minimum | 1.0% | 0.85% |
| Maximum | 36.7% | 43.5% |
| Range | 35.7% | 42.7% |
| Mean | 10.7% | 7.0% |
| Median | 7.6% | 5.4% |
| Interquartile 25% (IQ1) | 6.5% | 4.5% |
| Interquartile 75% (IQ3) | 13.2% | 6.3% |
| Interquartile Range (IQR) | 6.7% | 1.8% |
| Standard Deviation (Sample) | 8.0% | 7.0% |
| Standard Deviation (Population) | 7.9% | 6.9% |
Similar Demographics by Disability Age 18 to 34
Demographics Similar to Guamanians/Chamorros by Disability Age 18 to 34
In terms of disability age 18 to 34, the demographic groups most similar to Guamanians/Chamorros are Yugoslavian (7.2%, a difference of 0.040%), Malaysian (7.2%, a difference of 0.10%), Immigrants from Liberia (7.1%, a difference of 0.18%), Hungarian (7.1%, a difference of 0.20%), and Immigrants from Zaire (7.1%, a difference of 0.31%).
| Demographics | Rating | Rank | Disability Age 18 to 34 |
| Nepalese | 1.1 /100 | #241 | Tragic 7.1% |
| Immigrants | Congo | 1.1 /100 | #242 | Tragic 7.1% |
| Icelanders | 1.0 /100 | #243 | Tragic 7.1% |
| Immigrants | Zaire | 0.9 /100 | #244 | Tragic 7.1% |
| Hungarians | 0.9 /100 | #245 | Tragic 7.1% |
| Immigrants | Liberia | 0.8 /100 | #246 | Tragic 7.1% |
| Yugoslavians | 0.8 /100 | #247 | Tragic 7.2% |
| Guamanians/Chamorros | 0.8 /100 | #248 | Tragic 7.2% |
| Malaysians | 0.7 /100 | #249 | Tragic 7.2% |
| Fijians | 0.6 /100 | #250 | Tragic 7.2% |
| Spaniards | 0.6 /100 | #251 | Tragic 7.2% |
| Poles | 0.6 /100 | #252 | Tragic 7.2% |
| Croatians | 0.5 /100 | #253 | Tragic 7.2% |
| Indonesians | 0.4 /100 | #254 | Tragic 7.2% |
| Immigrants | Germany | 0.4 /100 | #255 | Tragic 7.2% |
Demographics Similar to Peruvians by Disability Age 18 to 34
In terms of disability age 18 to 34, the demographic groups most similar to Peruvians are British West Indian (6.0%, a difference of 0.030%), Salvadoran (6.0%, a difference of 0.050%), Taiwanese (6.0%, a difference of 0.070%), Trinidadian and Tobagonian (6.0%, a difference of 0.21%), and Immigrants from Sri Lanka (6.0%, a difference of 0.28%).
| Demographics | Rating | Rank | Disability Age 18 to 34 |
| Immigrants | Spain | 99.7 /100 | #55 | Exceptional 5.9% |
| Paraguayans | 99.7 /100 | #56 | Exceptional 5.9% |
| Immigrants | Haiti | 99.7 /100 | #57 | Exceptional 5.9% |
| Immigrants | Serbia | 99.7 /100 | #58 | Exceptional 5.9% |
| Immigrants | Caribbean | 99.6 /100 | #59 | Exceptional 6.0% |
| Immigrants | Sri Lanka | 99.6 /100 | #60 | Exceptional 6.0% |
| British West Indians | 99.6 /100 | #61 | Exceptional 6.0% |
| Peruvians | 99.6 /100 | #62 | Exceptional 6.0% |
| Salvadorans | 99.6 /100 | #63 | Exceptional 6.0% |
| Taiwanese | 99.6 /100 | #64 | Exceptional 6.0% |
| Trinidadians and Tobagonians | 99.5 /100 | #65 | Exceptional 6.0% |
| Burmese | 99.5 /100 | #66 | Exceptional 6.0% |
| Immigrants | North Macedonia | 99.5 /100 | #67 | Exceptional 6.0% |
| Immigrants | Poland | 99.5 /100 | #68 | Exceptional 6.0% |
| Immigrants | West Indies | 99.4 /100 | #69 | Exceptional 6.0% |