Guamanian/Chamorro vs Jamaican Disability Age 18 to 34
COMPARE
Guamanian/Chamorro
Jamaican
Disability Age 18 to 34
Disability Age 18 to 34 Comparison
Guamanians/Chamorros
Jamaicans
7.2%
DISABILITY AGE 18 TO 34
0.8/ 100
METRIC RATING
248th/ 347
METRIC RANK
6.4%
DISABILITY AGE 18 TO 34
86.8/ 100
METRIC RATING
141st/ 347
METRIC RANK
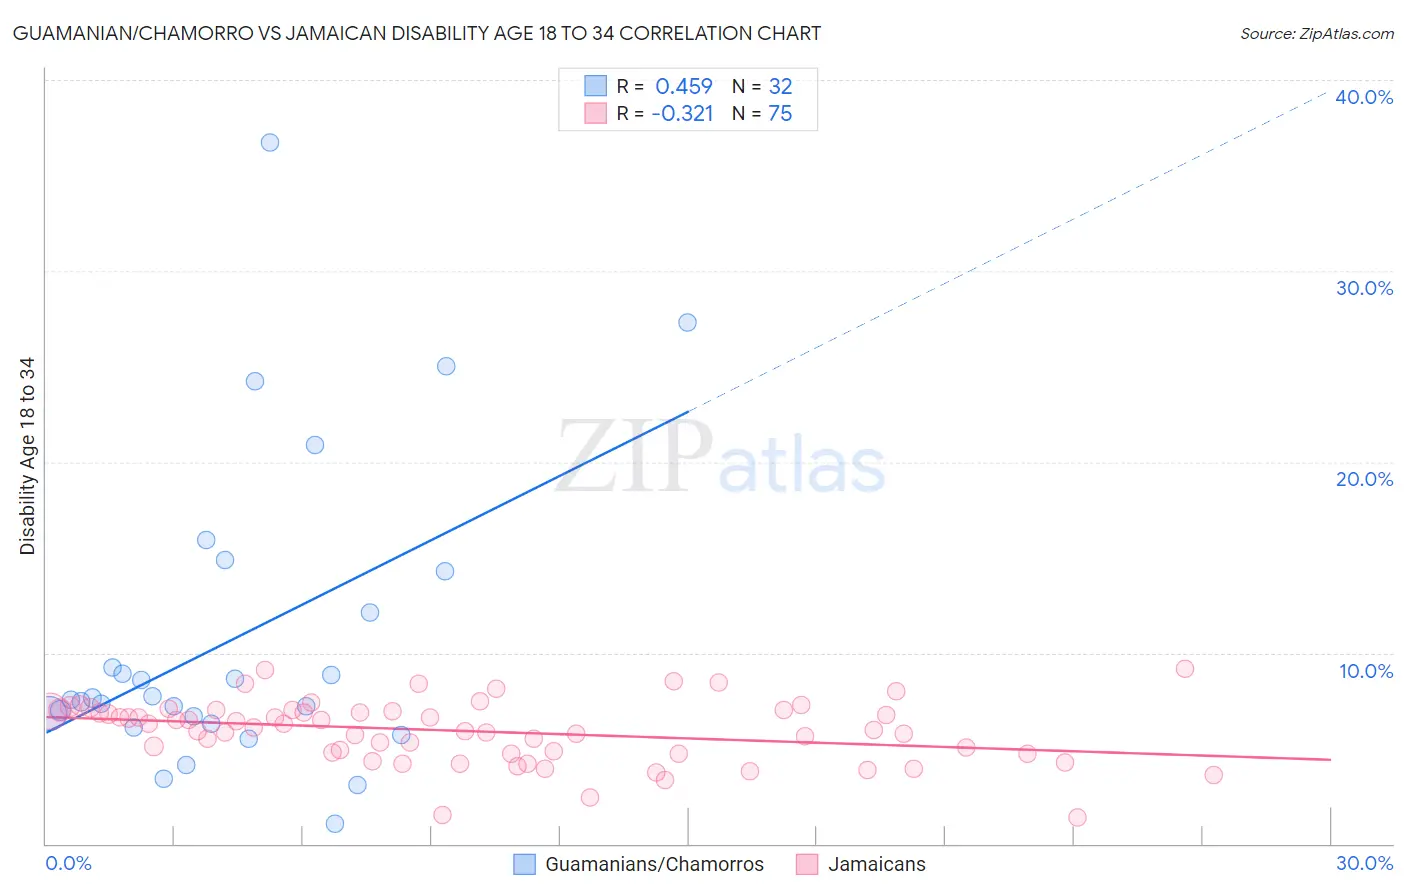
Guamanian/Chamorro vs Jamaican Disability Age 18 to 34 Correlation Chart
The statistical analysis conducted on geographies consisting of 221,642,972 people shows a moderate positive correlation between the proportion of Guamanians/Chamorros and percentage of population with a disability between the ages 18 and 35 in the United States with a correlation coefficient (R) of 0.459 and weighted average of 7.2%. Similarly, the statistical analysis conducted on geographies consisting of 367,393,519 people shows a mild negative correlation between the proportion of Jamaicans and percentage of population with a disability between the ages 18 and 35 in the United States with a correlation coefficient (R) of -0.321 and weighted average of 6.4%, a difference of 12.1%.
Disability Age 18 to 34 Correlation Summary
| Measurement | Guamanian/Chamorro | Jamaican |
| Minimum | 1.0% | 1.4% |
| Maximum | 36.7% | 9.2% |
| Range | 35.7% | 7.8% |
| Mean | 10.7% | 5.9% |
| Median | 7.6% | 6.1% |
| Interquartile 25% (IQ1) | 6.5% | 4.7% |
| Interquartile 75% (IQ3) | 13.2% | 7.0% |
| Interquartile Range (IQR) | 6.7% | 2.2% |
| Standard Deviation (Sample) | 8.0% | 1.6% |
| Standard Deviation (Population) | 7.9% | 1.6% |
Similar Demographics by Disability Age 18 to 34
Demographics Similar to Guamanians/Chamorros by Disability Age 18 to 34
In terms of disability age 18 to 34, the demographic groups most similar to Guamanians/Chamorros are Yugoslavian (7.2%, a difference of 0.040%), Malaysian (7.2%, a difference of 0.10%), Immigrants from Liberia (7.1%, a difference of 0.18%), Hungarian (7.1%, a difference of 0.20%), and Immigrants from Zaire (7.1%, a difference of 0.31%).
| Demographics | Rating | Rank | Disability Age 18 to 34 |
| Nepalese | 1.1 /100 | #241 | Tragic 7.1% |
| Immigrants | Congo | 1.1 /100 | #242 | Tragic 7.1% |
| Icelanders | 1.0 /100 | #243 | Tragic 7.1% |
| Immigrants | Zaire | 0.9 /100 | #244 | Tragic 7.1% |
| Hungarians | 0.9 /100 | #245 | Tragic 7.1% |
| Immigrants | Liberia | 0.8 /100 | #246 | Tragic 7.1% |
| Yugoslavians | 0.8 /100 | #247 | Tragic 7.2% |
| Guamanians/Chamorros | 0.8 /100 | #248 | Tragic 7.2% |
| Malaysians | 0.7 /100 | #249 | Tragic 7.2% |
| Fijians | 0.6 /100 | #250 | Tragic 7.2% |
| Spaniards | 0.6 /100 | #251 | Tragic 7.2% |
| Poles | 0.6 /100 | #252 | Tragic 7.2% |
| Croatians | 0.5 /100 | #253 | Tragic 7.2% |
| Indonesians | 0.4 /100 | #254 | Tragic 7.2% |
| Immigrants | Germany | 0.4 /100 | #255 | Tragic 7.2% |
Demographics Similar to Jamaicans by Disability Age 18 to 34
In terms of disability age 18 to 34, the demographic groups most similar to Jamaicans are South American Indian (6.4%, a difference of 0.030%), Immigrants from Latvia (6.4%, a difference of 0.050%), Immigrants from Fiji (6.4%, a difference of 0.090%), Immigrants from Belize (6.4%, a difference of 0.11%), and Immigrants from Honduras (6.4%, a difference of 0.16%).
| Demographics | Rating | Rank | Disability Age 18 to 34 |
| Immigrants | Europe | 88.8 /100 | #134 | Excellent 6.4% |
| Palestinians | 88.5 /100 | #135 | Excellent 6.4% |
| Immigrants | Sweden | 88.5 /100 | #136 | Excellent 6.4% |
| Immigrants | Honduras | 87.7 /100 | #137 | Excellent 6.4% |
| Spanish American Indians | 87.7 /100 | #138 | Excellent 6.4% |
| Immigrants | Belize | 87.4 /100 | #139 | Excellent 6.4% |
| Immigrants | Fiji | 87.3 /100 | #140 | Excellent 6.4% |
| Jamaicans | 86.8 /100 | #141 | Excellent 6.4% |
| South American Indians | 86.5 /100 | #142 | Excellent 6.4% |
| Immigrants | Latvia | 86.4 /100 | #143 | Excellent 6.4% |
| Albanians | 85.3 /100 | #144 | Excellent 6.4% |
| Moroccans | 85.2 /100 | #145 | Excellent 6.4% |
| Belizeans | 84.9 /100 | #146 | Excellent 6.4% |
| Immigrants | South Africa | 83.7 /100 | #147 | Excellent 6.4% |
| Immigrants | Belgium | 83.5 /100 | #148 | Excellent 6.4% |