White/Caucasian Disability Age 18 to 34
COMPARE
White/Caucasian
Select to Compare
Disability Age 18 to 34
White/Caucasian Disability Age 18 to 34
7.6%
DISABILITY | AGE 18 TO 34
0.0/ 100
METRIC RATING
288th/ 347
METRIC RANK
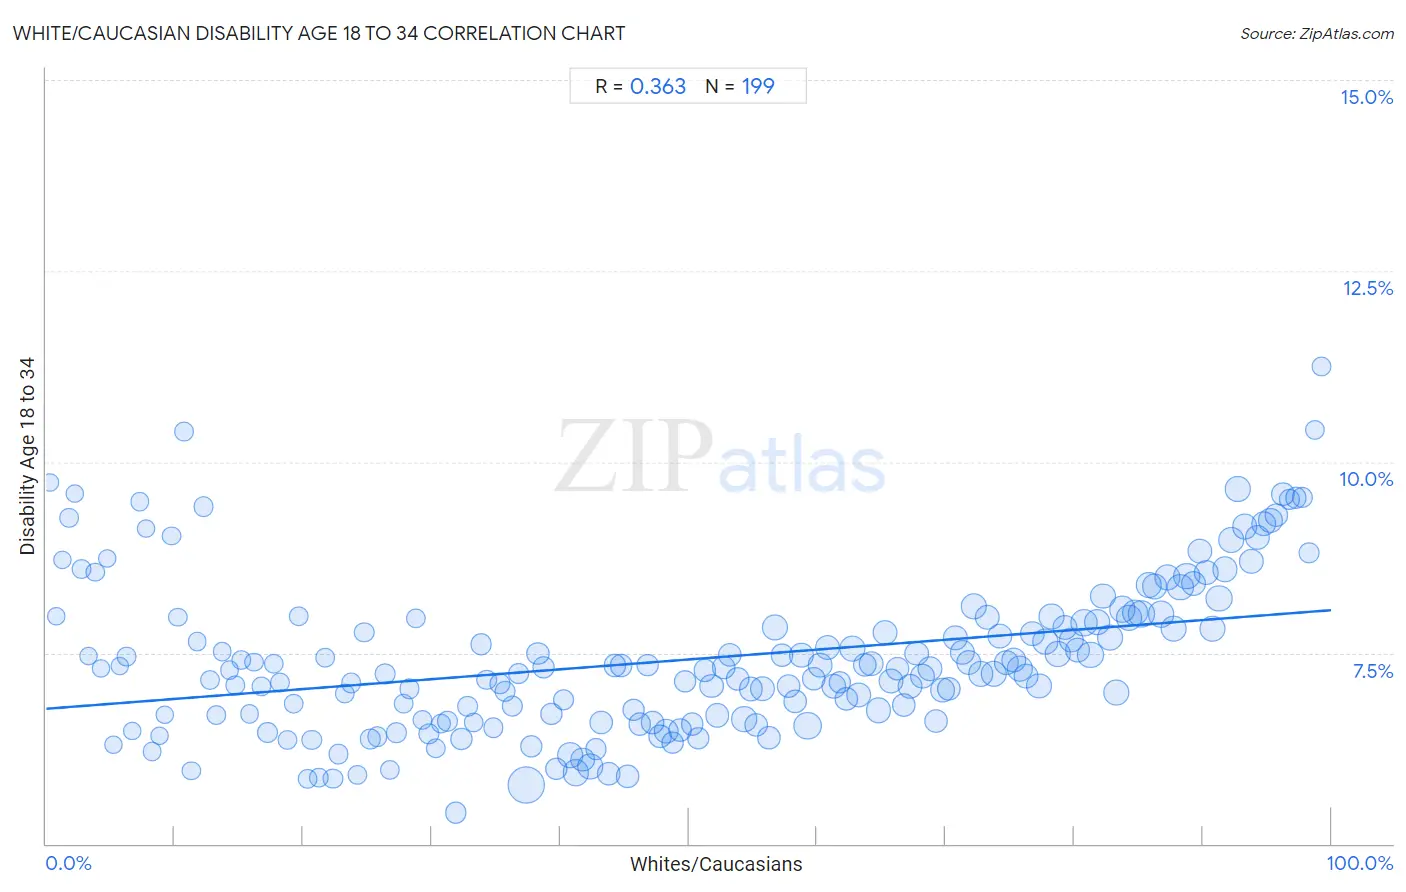
White/Caucasian Disability Age 18 to 34 Correlation Chart
The statistical analysis conducted on geographies consisting of 575,670,082 people shows a mild positive correlation between the proportion of Whites/Caucasians and percentage of population with a disability between the ages 18 and 35 in the United States with a correlation coefficient (R) of 0.363 and weighted average of 7.6%. On average, for every 1% (one percent) increase in Whites/Caucasians within a typical geography, there is an increase of 0.013% in percentage of population with a disability between the ages 18 and 35.
It is essential to understand that the correlation between the percentage of Whites/Caucasians and percentage of population with a disability between the ages 18 and 35 does not imply a direct cause-and-effect relationship. It remains uncertain whether the presence of Whites/Caucasians influences an upward or downward trend in the level of percentage of population with a disability between the ages 18 and 35 within an area, or if Whites/Caucasians simply ended up residing in those areas with higher or lower levels of percentage of population with a disability between the ages 18 and 35 due to other factors.
Demographics Similar to Whites/Caucasians by Disability Age 18 to 34
In terms of disability age 18 to 34, the demographic groups most similar to Whites/Caucasians are Norwegian (7.6%, a difference of 0.090%), Nonimmigrants (7.6%, a difference of 0.12%), Slovak (7.7%, a difference of 0.21%), Irish (7.7%, a difference of 0.26%), and Celtic (7.6%, a difference of 0.37%).
| Demographics | Rating | Rank | Disability Age 18 to 34 |
| Paiute | 0.0 /100 | #281 | Tragic 7.5% |
| Spanish | 0.0 /100 | #282 | Tragic 7.5% |
| Danes | 0.0 /100 | #283 | Tragic 7.5% |
| Hopi | 0.0 /100 | #284 | Tragic 7.5% |
| Swedes | 0.0 /100 | #285 | Tragic 7.5% |
| Celtics | 0.0 /100 | #286 | Tragic 7.6% |
| Norwegians | 0.0 /100 | #287 | Tragic 7.6% |
| Whites/Caucasians | 0.0 /100 | #288 | Tragic 7.6% |
| Nonimmigrants | 0.0 /100 | #289 | Tragic 7.6% |
| Slovaks | 0.0 /100 | #290 | Tragic 7.7% |
| Irish | 0.0 /100 | #291 | Tragic 7.7% |
| Blacks/African Americans | 0.0 /100 | #292 | Tragic 7.7% |
| Scandinavians | 0.0 /100 | #293 | Tragic 7.7% |
| Immigrants from Cabo Verde | 0.0 /100 | #294 | Tragic 7.7% |
| Tlingit-Haida | 0.0 /100 | #295 | Tragic 7.7% |
White/Caucasian Disability Age 18 to 34 Correlation Summary
| Measurement | White/Caucasian Data | Disability Age 18 to 34 Data |
| Minimum | 0.32% | 5.4% |
| Maximum | 99.2% | 11.2% |
| Range | 98.9% | 5.8% |
| Mean | 49.8% | 7.4% |
| Median | 49.7% | 7.3% |
| Interquartile 25% (IQ1) | 24.8% | 6.6% |
| Interquartile 75% (IQ3) | 74.8% | 8.0% |
| Interquartile Range (IQR) | 50.0% | 1.3% |
| Standard Deviation (Sample) | 28.8% | 1.0% |
| Standard Deviation (Population) | 28.7% | 1.0% |
Correlation Details
| White/Caucasian Percentile | Sample Size | Disability Age 18 to 34 |
[ 0.0% - 0.5% ] 0.32% | 56,546 | 9.7% |
[ 0.5% - 1.0% ] 0.80% | 66,556 | 8.0% |
[ 1.0% - 1.5% ] 1.26% | 171,685 | 8.7% |
[ 1.5% - 2.0% ] 1.77% | 462,769 | 9.3% |
[ 2.0% - 2.5% ] 2.21% | 306,016 | 9.6% |
[ 2.5% - 3.0% ] 2.76% | 528,815 | 8.6% |
[ 3.0% - 3.5% ] 3.26% | 342,706 | 7.5% |
[ 3.5% - 4.0% ] 3.79% | 514,895 | 8.6% |
[ 4.0% - 4.5% ] 4.25% | 458,644 | 7.3% |
[ 4.5% - 5.0% ] 4.75% | 429,364 | 8.7% |
[ 5.0% - 5.5% ] 5.23% | 425,544 | 6.3% |
[ 5.5% - 6.0% ] 5.75% | 356,799 | 7.3% |
[ 6.0% - 6.5% ] 6.27% | 432,289 | 7.5% |
[ 6.5% - 7.0% ] 6.68% | 424,158 | 6.5% |
[ 7.0% - 7.5% ] 7.30% | 349,895 | 9.5% |
[ 7.5% - 8.0% ] 7.78% | 337,742 | 9.1% |
[ 8.0% - 8.5% ] 8.24% | 572,586 | 6.2% |
[ 8.5% - 9.0% ] 8.81% | 657,825 | 6.4% |
[ 9.0% - 9.5% ] 9.25% | 380,330 | 6.7% |
[ 9.5% - 10.0% ] 9.74% | 485,588 | 9.0% |
[ 10.0% - 10.5% ] 10.22% | 434,586 | 8.0% |
[ 10.5% - 11.0% ] 10.73% | 507,707 | 10.4% |
[ 11.0% - 11.5% ] 11.28% | 721,591 | 6.0% |
[ 11.5% - 12.0% ] 11.75% | 471,783 | 7.6% |
[ 12.0% - 12.5% ] 12.21% | 1,174,027 | 9.4% |
[ 12.5% - 13.0% ] 12.75% | 903,914 | 7.1% |
[ 13.0% - 13.5% ] 13.27% | 790,345 | 6.7% |
[ 13.5% - 14.0% ] 13.70% | 430,660 | 7.5% |
[ 14.0% - 14.5% ] 14.27% | 708,254 | 7.3% |
[ 14.5% - 15.0% ] 14.70% | 503,263 | 7.1% |
[ 15.0% - 15.5% ] 15.17% | 873,652 | 7.4% |
[ 15.5% - 16.0% ] 15.81% | 704,529 | 6.7% |
[ 16.0% - 16.5% ] 16.15% | 534,027 | 7.4% |
[ 16.5% - 17.0% ] 16.76% | 680,684 | 7.1% |
[ 17.0% - 17.5% ] 17.25% | 1,693,095 | 6.5% |
[ 17.5% - 18.0% ] 17.71% | 875,820 | 7.4% |
[ 18.0% - 18.5% ] 18.21% | 908,805 | 7.1% |
[ 18.5% - 19.0% ] 18.75% | 945,529 | 6.4% |
[ 19.0% - 19.5% ] 19.26% | 996,875 | 6.8% |
[ 19.5% - 20.0% ] 19.69% | 905,786 | 8.0% |
[ 20.0% - 20.5% ] 20.31% | 757,174 | 5.9% |
[ 20.5% - 21.0% ] 20.67% | 989,789 | 6.4% |
[ 21.0% - 21.5% ] 21.23% | 741,011 | 5.9% |
[ 21.5% - 22.0% ] 21.70% | 679,402 | 7.4% |
[ 22.0% - 22.5% ] 22.31% | 1,087,451 | 5.9% |
[ 22.5% - 23.0% ] 22.71% | 1,273,845 | 6.2% |
[ 23.0% - 23.5% ] 23.23% | 1,184,672 | 7.0% |
[ 23.5% - 24.0% ] 23.75% | 1,057,249 | 7.1% |
[ 24.0% - 24.5% ] 24.24% | 1,080,581 | 5.9% |
[ 24.5% - 25.0% ] 24.75% | 1,120,533 | 7.8% |
[ 25.0% - 25.5% ] 25.23% | 1,374,905 | 6.4% |
[ 25.5% - 26.0% ] 25.75% | 1,159,025 | 6.4% |
[ 26.0% - 26.5% ] 26.33% | 1,577,597 | 7.2% |
[ 26.5% - 27.0% ] 26.74% | 1,045,529 | 6.0% |
[ 27.0% - 27.5% ] 27.26% | 1,462,884 | 6.5% |
[ 27.5% - 28.0% ] 27.81% | 1,018,165 | 6.8% |
[ 28.0% - 28.5% ] 28.27% | 1,648,793 | 7.0% |
[ 28.5% - 29.0% ] 28.77% | 1,406,834 | 8.0% |
[ 29.0% - 29.5% ] 29.28% | 988,483 | 6.6% |
[ 29.5% - 30.0% ] 29.74% | 1,618,088 | 6.4% |
[ 30.0% - 30.5% ] 30.32% | 1,517,674 | 6.3% |
[ 30.5% - 31.0% ] 30.75% | 1,170,062 | 6.6% |
[ 31.0% - 31.5% ] 31.24% | 1,701,358 | 6.6% |
[ 31.5% - 32.0% ] 31.87% | 2,365,302 | 5.4% |
[ 32.0% - 32.5% ] 32.29% | 2,333,098 | 6.4% |
[ 32.5% - 33.0% ] 32.77% | 1,596,784 | 6.8% |
[ 33.0% - 33.5% ] 33.27% | 939,654 | 6.6% |
[ 33.5% - 34.0% ] 33.82% | 1,878,597 | 7.6% |
[ 34.0% - 34.5% ] 34.27% | 1,160,916 | 7.1% |
[ 34.5% - 35.0% ] 34.79% | 1,423,116 | 6.5% |
[ 35.0% - 35.5% ] 35.27% | 1,815,328 | 7.1% |
[ 35.5% - 36.0% ] 35.74% | 1,655,994 | 7.0% |
[ 36.0% - 36.5% ] 36.25% | 1,966,067 | 6.8% |
[ 36.5% - 37.0% ] 36.75% | 2,000,402 | 7.2% |
[ 37.0% - 37.5% ] 37.37% | 12,669,027 | 5.8% |
[ 37.5% - 38.0% ] 37.71% | 2,480,147 | 6.3% |
[ 38.0% - 38.5% ] 38.25% | 2,878,799 | 7.5% |
[ 38.5% - 39.0% ] 38.72% | 2,807,165 | 7.3% |
[ 39.0% - 39.5% ] 39.28% | 2,408,486 | 6.7% |
[ 39.5% - 40.0% ] 39.72% | 2,512,842 | 6.0% |
[ 40.0% - 40.5% ] 40.24% | 1,992,200 | 6.9% |
[ 40.5% - 41.0% ] 40.78% | 4,859,788 | 6.2% |
[ 41.0% - 41.5% ] 41.21% | 5,704,689 | 5.9% |
[ 41.5% - 42.0% ] 41.77% | 4,016,482 | 6.1% |
[ 42.0% - 42.5% ] 42.32% | 4,846,335 | 6.0% |
[ 42.5% - 43.0% ] 42.76% | 2,117,044 | 6.2% |
[ 43.0% - 43.5% ] 43.19% | 3,448,789 | 6.6% |
[ 43.5% - 44.0% ] 43.79% | 3,465,567 | 5.9% |
[ 44.0% - 44.5% ] 44.24% | 2,766,463 | 7.3% |
[ 44.5% - 45.0% ] 44.74% | 2,712,445 | 7.3% |
[ 45.0% - 45.5% ] 45.27% | 3,307,423 | 5.9% |
[ 45.5% - 46.0% ] 45.71% | 2,779,916 | 6.8% |
[ 46.0% - 46.5% ] 46.21% | 2,955,454 | 6.6% |
[ 46.5% - 47.0% ] 46.77% | 2,387,655 | 7.3% |
[ 47.0% - 47.5% ] 47.21% | 3,333,136 | 6.6% |
[ 47.5% - 48.0% ] 47.75% | 3,326,783 | 6.4% |
[ 48.0% - 48.5% ] 48.24% | 4,290,952 | 6.5% |
[ 48.5% - 49.0% ] 48.73% | 2,392,786 | 6.3% |
[ 49.0% - 49.5% ] 49.29% | 3,322,694 | 6.5% |
[ 49.5% - 50.0% ] 49.74% | 2,462,441 | 7.1% |
[ 50.0% - 50.5% ] 50.26% | 2,935,513 | 6.6% |
[ 50.5% - 51.0% ] 50.75% | 3,210,246 | 6.4% |
[ 51.0% - 51.5% ] 51.23% | 2,794,111 | 7.3% |
[ 51.5% - 52.0% ] 51.79% | 3,773,941 | 7.1% |
[ 52.0% - 52.5% ] 52.20% | 3,786,245 | 6.7% |
[ 52.5% - 53.0% ] 52.76% | 3,447,975 | 7.3% |
[ 53.0% - 53.5% ] 53.23% | 3,647,877 | 7.5% |
[ 53.5% - 54.0% ] 53.78% | 3,211,160 | 7.2% |
[ 54.0% - 54.5% ] 54.32% | 4,565,436 | 6.6% |
[ 54.5% - 55.0% ] 54.82% | 3,902,234 | 7.0% |
[ 55.0% - 55.5% ] 55.28% | 3,491,741 | 6.6% |
[ 55.5% - 56.0% ] 55.75% | 4,318,669 | 7.0% |
[ 56.0% - 56.5% ] 56.24% | 3,119,319 | 6.4% |
[ 56.5% - 57.0% ] 56.71% | 5,191,823 | 7.8% |
[ 57.0% - 57.5% ] 57.25% | 3,192,641 | 7.5% |
[ 57.5% - 58.0% ] 57.74% | 3,630,656 | 7.1% |
[ 58.0% - 58.5% ] 58.26% | 3,203,272 | 6.9% |
[ 58.5% - 59.0% ] 58.75% | 4,004,063 | 7.5% |
[ 59.0% - 59.5% ] 59.26% | 6,611,525 | 6.5% |
[ 59.5% - 60.0% ] 59.75% | 3,425,808 | 7.2% |
[ 60.0% - 60.5% ] 60.24% | 4,083,897 | 7.3% |
[ 60.5% - 61.0% ] 60.76% | 4,255,608 | 7.6% |
[ 61.0% - 61.5% ] 61.31% | 4,248,564 | 7.1% |
[ 61.5% - 62.0% ] 61.77% | 2,832,136 | 7.1% |
[ 62.0% - 62.5% ] 62.23% | 3,264,288 | 6.9% |
[ 62.5% - 63.0% ] 62.76% | 5,266,676 | 7.6% |
[ 63.0% - 63.5% ] 63.24% | 4,332,959 | 7.0% |
[ 63.5% - 64.0% ] 63.73% | 3,637,368 | 7.3% |
[ 64.0% - 64.5% ] 64.23% | 4,334,210 | 7.4% |
[ 64.5% - 65.0% ] 64.76% | 4,640,328 | 6.7% |
[ 65.0% - 65.5% ] 65.30% | 4,193,294 | 7.8% |
[ 65.5% - 66.0% ] 65.73% | 4,568,843 | 7.1% |
[ 66.0% - 66.5% ] 66.26% | 3,457,411 | 7.3% |
[ 66.5% - 67.0% ] 66.78% | 3,333,654 | 6.8% |
[ 67.0% - 67.5% ] 67.25% | 4,201,783 | 7.1% |
[ 67.5% - 68.0% ] 67.75% | 3,674,187 | 7.5% |
[ 68.0% - 68.5% ] 68.23% | 4,325,753 | 7.2% |
[ 68.5% - 69.0% ] 68.77% | 4,319,405 | 7.3% |
[ 69.0% - 69.5% ] 69.23% | 3,702,218 | 6.6% |
[ 69.5% - 70.0% ] 69.76% | 4,156,641 | 7.0% |
[ 70.0% - 70.5% ] 70.24% | 3,285,328 | 7.0% |
[ 70.5% - 71.0% ] 70.73% | 3,805,851 | 7.7% |
[ 71.0% - 71.5% ] 71.27% | 4,477,123 | 7.5% |
[ 71.5% - 72.0% ] 71.76% | 4,281,140 | 7.4% |
[ 72.0% - 72.5% ] 72.22% | 5,009,991 | 8.1% |
[ 72.5% - 73.0% ] 72.72% | 4,918,655 | 7.2% |
[ 73.0% - 73.5% ] 73.26% | 4,555,881 | 8.0% |
[ 73.5% - 74.0% ] 73.74% | 5,078,860 | 7.2% |
[ 74.0% - 74.5% ] 74.24% | 4,480,271 | 7.7% |
[ 74.5% - 75.0% ] 74.75% | 4,042,423 | 7.4% |
[ 75.0% - 75.5% ] 75.27% | 4,237,170 | 7.4% |
[ 75.5% - 76.0% ] 75.73% | 5,302,080 | 7.3% |
[ 76.0% - 76.5% ] 76.24% | 4,481,532 | 7.2% |
[ 76.5% - 77.0% ] 76.75% | 4,414,704 | 7.7% |
[ 77.0% - 77.5% ] 77.25% | 4,767,801 | 7.1% |
[ 77.5% - 78.0% ] 77.75% | 4,697,885 | 7.6% |
[ 78.0% - 78.5% ] 78.26% | 4,723,574 | 8.0% |
[ 78.5% - 79.0% ] 78.74% | 4,754,865 | 7.5% |
[ 79.0% - 79.5% ] 79.24% | 4,360,713 | 7.8% |
[ 79.5% - 80.0% ] 79.75% | 4,191,628 | 7.7% |
[ 80.0% - 80.5% ] 80.25% | 4,144,314 | 7.5% |
[ 80.5% - 81.0% ] 80.75% | 5,573,724 | 7.9% |
[ 81.0% - 81.5% ] 81.26% | 5,292,393 | 7.5% |
[ 81.5% - 82.0% ] 81.77% | 5,608,110 | 7.9% |
[ 82.0% - 82.5% ] 82.25% | 4,490,340 | 8.2% |
[ 82.5% - 83.0% ] 82.75% | 4,991,948 | 7.7% |
[ 83.0% - 83.5% ] 83.25% | 5,047,023 | 7.0% |
[ 83.5% - 84.0% ] 83.75% | 5,353,268 | 8.1% |
[ 84.0% - 84.5% ] 84.25% | 4,667,120 | 8.0% |
[ 84.5% - 85.0% ] 84.75% | 4,967,819 | 8.0% |
[ 85.0% - 85.5% ] 85.23% | 5,693,200 | 8.0% |
[ 85.5% - 86.0% ] 85.76% | 5,078,299 | 8.4% |
[ 86.0% - 86.5% ] 86.25% | 4,806,071 | 8.4% |
[ 86.5% - 87.0% ] 86.74% | 5,320,061 | 8.0% |
[ 87.0% - 87.5% ] 87.26% | 5,222,663 | 8.5% |
[ 87.5% - 88.0% ] 87.75% | 5,226,502 | 7.8% |
[ 88.0% - 88.5% ] 88.26% | 5,465,345 | 8.4% |
[ 88.5% - 89.0% ] 88.75% | 5,283,006 | 8.5% |
[ 89.0% - 89.5% ] 89.25% | 4,585,819 | 8.4% |
[ 89.5% - 90.0% ] 89.74% | 4,454,305 | 8.8% |
[ 90.0% - 90.5% ] 90.25% | 4,210,346 | 8.5% |
[ 90.5% - 91.0% ] 90.76% | 5,147,344 | 7.8% |
[ 91.0% - 91.5% ] 91.25% | 5,510,657 | 8.2% |
[ 91.5% - 92.0% ] 91.75% | 4,330,307 | 8.6% |
[ 92.0% - 92.5% ] 92.24% | 5,133,382 | 9.0% |
[ 92.5% - 93.0% ] 92.75% | 4,738,174 | 9.6% |
[ 93.0% - 93.5% ] 93.24% | 4,650,193 | 9.2% |
[ 93.5% - 94.0% ] 93.75% | 4,096,072 | 8.7% |
[ 94.0% - 94.5% ] 94.26% | 4,340,764 | 9.0% |
[ 94.5% - 95.0% ] 94.75% | 4,294,050 | 9.2% |
[ 95.0% - 95.5% ] 95.26% | 3,667,309 | 9.2% |
[ 95.5% - 96.0% ] 95.76% | 3,262,706 | 9.3% |
[ 96.0% - 96.5% ] 96.25% | 2,857,867 | 9.6% |
[ 96.5% - 97.0% ] 96.75% | 2,513,449 | 9.5% |
[ 97.0% - 97.5% ] 97.25% | 2,160,206 | 9.5% |
[ 97.5% - 98.0% ] 97.73% | 1,876,996 | 9.5% |
[ 98.0% - 98.5% ] 98.25% | 1,314,315 | 8.8% |
[ 98.5% - 99.0% ] 98.72% | 998,159 | 10.4% |
[ 99.0% - 99.5% ] 99.24% | 567,949 | 11.2% |