Guamanian/Chamorro vs Cuban Disability Age 18 to 34
COMPARE
Guamanian/Chamorro
Cuban
Disability Age 18 to 34
Disability Age 18 to 34 Comparison
Guamanians/Chamorros
Cubans
7.2%
DISABILITY AGE 18 TO 34
0.8/ 100
METRIC RATING
248th/ 347
METRIC RANK
5.7%
DISABILITY AGE 18 TO 34
100.0/ 100
METRIC RATING
23rd/ 347
METRIC RANK
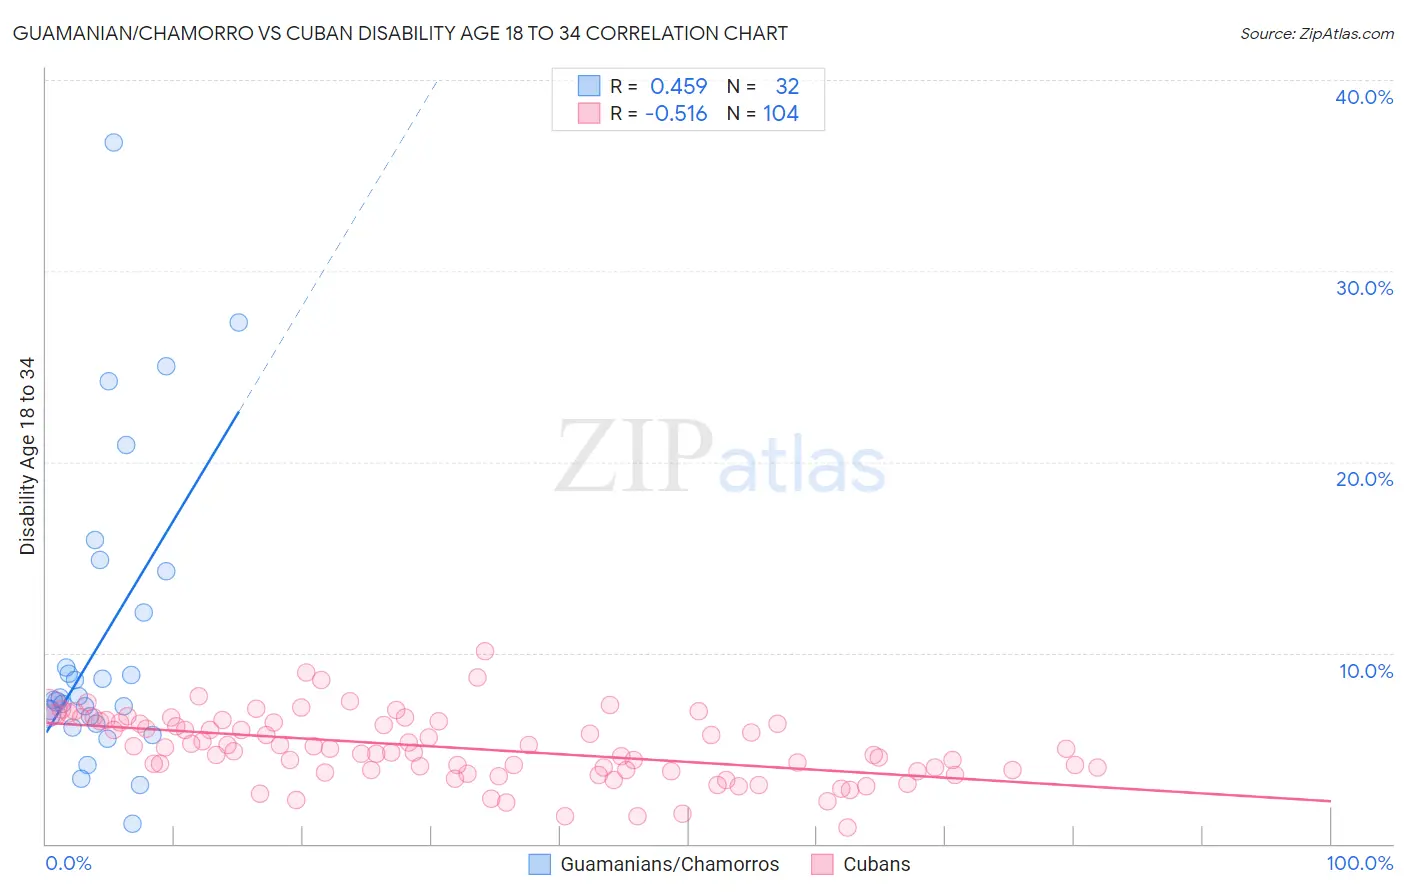
Guamanian/Chamorro vs Cuban Disability Age 18 to 34 Correlation Chart
The statistical analysis conducted on geographies consisting of 221,642,972 people shows a moderate positive correlation between the proportion of Guamanians/Chamorros and percentage of population with a disability between the ages 18 and 35 in the United States with a correlation coefficient (R) of 0.459 and weighted average of 7.2%. Similarly, the statistical analysis conducted on geographies consisting of 448,003,598 people shows a substantial negative correlation between the proportion of Cubans and percentage of population with a disability between the ages 18 and 35 in the United States with a correlation coefficient (R) of -0.516 and weighted average of 5.7%, a difference of 25.4%.
Disability Age 18 to 34 Correlation Summary
| Measurement | Guamanian/Chamorro | Cuban |
| Minimum | 1.0% | 0.83% |
| Maximum | 36.7% | 10.1% |
| Range | 35.7% | 9.2% |
| Mean | 10.7% | 5.0% |
| Median | 7.6% | 5.0% |
| Interquartile 25% (IQ1) | 6.5% | 3.8% |
| Interquartile 75% (IQ3) | 13.2% | 6.4% |
| Interquartile Range (IQR) | 6.7% | 2.6% |
| Standard Deviation (Sample) | 8.0% | 1.8% |
| Standard Deviation (Population) | 7.9% | 1.8% |
Similar Demographics by Disability Age 18 to 34
Demographics Similar to Guamanians/Chamorros by Disability Age 18 to 34
In terms of disability age 18 to 34, the demographic groups most similar to Guamanians/Chamorros are Yugoslavian (7.2%, a difference of 0.040%), Malaysian (7.2%, a difference of 0.10%), Immigrants from Liberia (7.1%, a difference of 0.18%), Hungarian (7.1%, a difference of 0.20%), and Immigrants from Zaire (7.1%, a difference of 0.31%).
| Demographics | Rating | Rank | Disability Age 18 to 34 |
| Nepalese | 1.1 /100 | #241 | Tragic 7.1% |
| Immigrants | Congo | 1.1 /100 | #242 | Tragic 7.1% |
| Icelanders | 1.0 /100 | #243 | Tragic 7.1% |
| Immigrants | Zaire | 0.9 /100 | #244 | Tragic 7.1% |
| Hungarians | 0.9 /100 | #245 | Tragic 7.1% |
| Immigrants | Liberia | 0.8 /100 | #246 | Tragic 7.1% |
| Yugoslavians | 0.8 /100 | #247 | Tragic 7.2% |
| Guamanians/Chamorros | 0.8 /100 | #248 | Tragic 7.2% |
| Malaysians | 0.7 /100 | #249 | Tragic 7.2% |
| Fijians | 0.6 /100 | #250 | Tragic 7.2% |
| Spaniards | 0.6 /100 | #251 | Tragic 7.2% |
| Poles | 0.6 /100 | #252 | Tragic 7.2% |
| Croatians | 0.5 /100 | #253 | Tragic 7.2% |
| Indonesians | 0.4 /100 | #254 | Tragic 7.2% |
| Immigrants | Germany | 0.4 /100 | #255 | Tragic 7.2% |
Demographics Similar to Cubans by Disability Age 18 to 34
In terms of disability age 18 to 34, the demographic groups most similar to Cubans are Immigrants from Argentina (5.7%, a difference of 0.10%), Immigrants from Singapore (5.7%, a difference of 0.14%), Immigrants from Colombia (5.7%, a difference of 0.29%), Immigrants from Venezuela (5.7%, a difference of 0.40%), and Soviet Union (5.7%, a difference of 0.49%).
| Demographics | Rating | Rank | Disability Age 18 to 34 |
| Immigrants | Israel | 100.0 /100 | #16 | Exceptional 5.6% |
| Immigrants | Eastern Asia | 100.0 /100 | #17 | Exceptional 5.6% |
| Immigrants | Bolivia | 100.0 /100 | #18 | Exceptional 5.6% |
| Thais | 100.0 /100 | #19 | Exceptional 5.6% |
| Immigrants | Bangladesh | 100.0 /100 | #20 | Exceptional 5.6% |
| Immigrants | South Central Asia | 100.0 /100 | #21 | Exceptional 5.7% |
| Immigrants | Nicaragua | 100.0 /100 | #22 | Exceptional 5.7% |
| Cubans | 100.0 /100 | #23 | Exceptional 5.7% |
| Immigrants | Argentina | 100.0 /100 | #24 | Exceptional 5.7% |
| Immigrants | Singapore | 100.0 /100 | #25 | Exceptional 5.7% |
| Immigrants | Colombia | 100.0 /100 | #26 | Exceptional 5.7% |
| Immigrants | Venezuela | 99.9 /100 | #27 | Exceptional 5.7% |
| Soviet Union | 99.9 /100 | #28 | Exceptional 5.7% |
| Immigrants | Ecuador | 99.9 /100 | #29 | Exceptional 5.7% |
| Immigrants | Pakistan | 99.9 /100 | #30 | Exceptional 5.8% |