Guamanian/Chamorro vs Immigrants from Central America Disability Age 18 to 34
COMPARE
Guamanian/Chamorro
Immigrants from Central America
Disability Age 18 to 34
Disability Age 18 to 34 Comparison
Guamanians/Chamorros
Immigrants from Central America
7.2%
DISABILITY AGE 18 TO 34
0.8/ 100
METRIC RATING
248th/ 347
METRIC RANK
6.5%
DISABILITY AGE 18 TO 34
76.8/ 100
METRIC RATING
154th/ 347
METRIC RANK
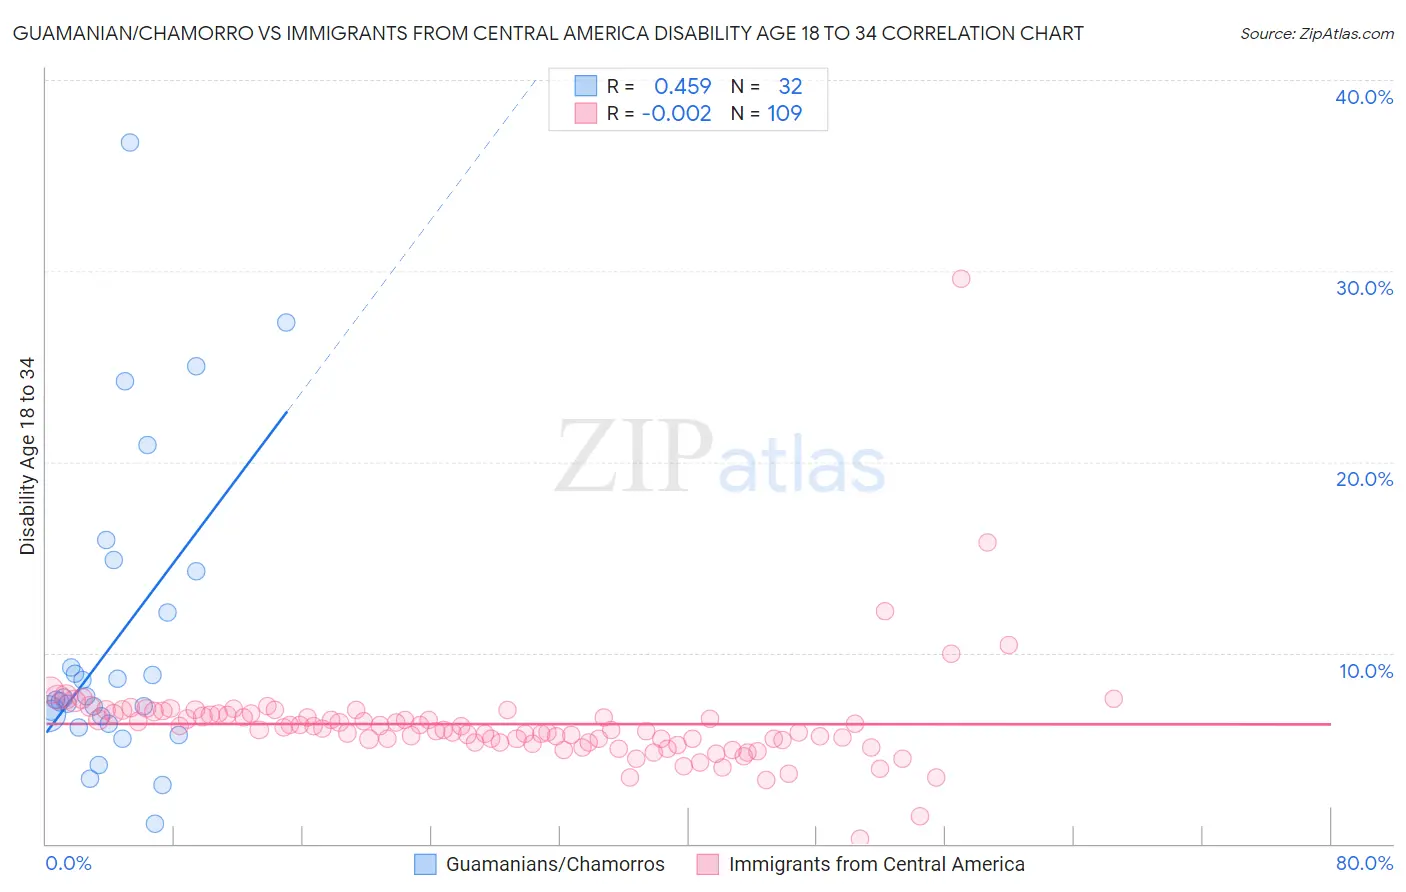
Guamanian/Chamorro vs Immigrants from Central America Disability Age 18 to 34 Correlation Chart
The statistical analysis conducted on geographies consisting of 221,642,972 people shows a moderate positive correlation between the proportion of Guamanians/Chamorros and percentage of population with a disability between the ages 18 and 35 in the United States with a correlation coefficient (R) of 0.459 and weighted average of 7.2%. Similarly, the statistical analysis conducted on geographies consisting of 533,089,991 people shows no correlation between the proportion of Immigrants from Central America and percentage of population with a disability between the ages 18 and 35 in the United States with a correlation coefficient (R) of -0.002 and weighted average of 6.5%, a difference of 10.7%.
Disability Age 18 to 34 Correlation Summary
| Measurement | Guamanian/Chamorro | Immigrants from Central America |
| Minimum | 1.0% | 0.28% |
| Maximum | 36.7% | 29.6% |
| Range | 35.7% | 29.3% |
| Mean | 10.7% | 6.3% |
| Median | 7.6% | 6.0% |
| Interquartile 25% (IQ1) | 6.5% | 5.3% |
| Interquartile 75% (IQ3) | 13.2% | 6.8% |
| Interquartile Range (IQR) | 6.7% | 1.5% |
| Standard Deviation (Sample) | 8.0% | 2.8% |
| Standard Deviation (Population) | 7.9% | 2.8% |
Similar Demographics by Disability Age 18 to 34
Demographics Similar to Guamanians/Chamorros by Disability Age 18 to 34
In terms of disability age 18 to 34, the demographic groups most similar to Guamanians/Chamorros are Yugoslavian (7.2%, a difference of 0.040%), Malaysian (7.2%, a difference of 0.10%), Immigrants from Liberia (7.1%, a difference of 0.18%), Hungarian (7.1%, a difference of 0.20%), and Immigrants from Zaire (7.1%, a difference of 0.31%).
| Demographics | Rating | Rank | Disability Age 18 to 34 |
| Nepalese | 1.1 /100 | #241 | Tragic 7.1% |
| Immigrants | Congo | 1.1 /100 | #242 | Tragic 7.1% |
| Icelanders | 1.0 /100 | #243 | Tragic 7.1% |
| Immigrants | Zaire | 0.9 /100 | #244 | Tragic 7.1% |
| Hungarians | 0.9 /100 | #245 | Tragic 7.1% |
| Immigrants | Liberia | 0.8 /100 | #246 | Tragic 7.1% |
| Yugoslavians | 0.8 /100 | #247 | Tragic 7.2% |
| Guamanians/Chamorros | 0.8 /100 | #248 | Tragic 7.2% |
| Malaysians | 0.7 /100 | #249 | Tragic 7.2% |
| Fijians | 0.6 /100 | #250 | Tragic 7.2% |
| Spaniards | 0.6 /100 | #251 | Tragic 7.2% |
| Poles | 0.6 /100 | #252 | Tragic 7.2% |
| Croatians | 0.5 /100 | #253 | Tragic 7.2% |
| Indonesians | 0.4 /100 | #254 | Tragic 7.2% |
| Immigrants | Germany | 0.4 /100 | #255 | Tragic 7.2% |
Demographics Similar to Immigrants from Central America by Disability Age 18 to 34
In terms of disability age 18 to 34, the demographic groups most similar to Immigrants from Central America are Inupiat (6.5%, a difference of 0.0%), Immigrants from Eritrea (6.5%, a difference of 0.060%), Immigrants from Panama (6.5%, a difference of 0.14%), Bulgarian (6.5%, a difference of 0.16%), and Immigrants from Sierra Leone (6.5%, a difference of 0.17%).
| Demographics | Rating | Rank | Disability Age 18 to 34 |
| Immigrants | South Africa | 83.7 /100 | #147 | Excellent 6.4% |
| Immigrants | Belgium | 83.5 /100 | #148 | Excellent 6.4% |
| Hondurans | 83.1 /100 | #149 | Excellent 6.4% |
| Immigrants | Dominican Republic | 82.7 /100 | #150 | Excellent 6.4% |
| Tongans | 81.9 /100 | #151 | Excellent 6.4% |
| Bulgarians | 78.3 /100 | #152 | Good 6.5% |
| Immigrants | Eritrea | 77.4 /100 | #153 | Good 6.5% |
| Immigrants | Central America | 76.8 /100 | #154 | Good 6.5% |
| Inupiat | 76.7 /100 | #155 | Good 6.5% |
| Immigrants | Panama | 75.3 /100 | #156 | Good 6.5% |
| Immigrants | Sierra Leone | 75.0 /100 | #157 | Good 6.5% |
| Zimbabweans | 74.7 /100 | #158 | Good 6.5% |
| Dominicans | 73.6 /100 | #159 | Good 6.5% |
| Immigrants | Southern Europe | 72.5 /100 | #160 | Good 6.5% |
| Arabs | 72.3 /100 | #161 | Good 6.5% |