Guamanian/Chamorro vs Yakama Disability Age 18 to 34
COMPARE
Guamanian/Chamorro
Yakama
Disability Age 18 to 34
Disability Age 18 to 34 Comparison
Guamanians/Chamorros
Yakama
7.2%
DISABILITY AGE 18 TO 34
0.8/ 100
METRIC RATING
248th/ 347
METRIC RANK
9.0%
DISABILITY AGE 18 TO 34
0.0/ 100
METRIC RATING
342nd/ 347
METRIC RANK
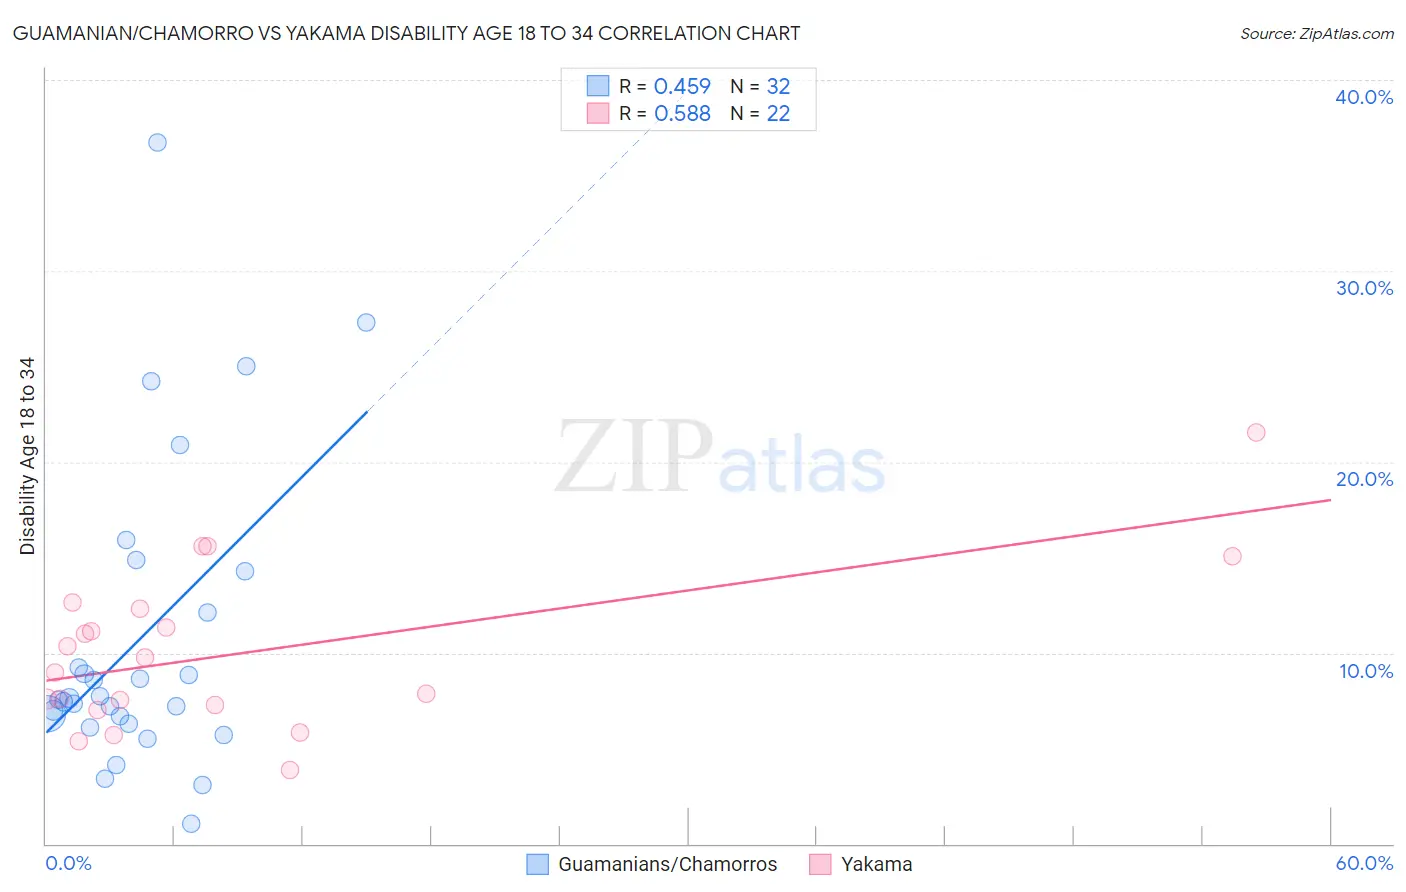
Guamanian/Chamorro vs Yakama Disability Age 18 to 34 Correlation Chart
The statistical analysis conducted on geographies consisting of 221,642,972 people shows a moderate positive correlation between the proportion of Guamanians/Chamorros and percentage of population with a disability between the ages 18 and 35 in the United States with a correlation coefficient (R) of 0.459 and weighted average of 7.2%. Similarly, the statistical analysis conducted on geographies consisting of 19,906,145 people shows a substantial positive correlation between the proportion of Yakama and percentage of population with a disability between the ages 18 and 35 in the United States with a correlation coefficient (R) of 0.588 and weighted average of 9.0%, a difference of 25.4%.
Disability Age 18 to 34 Correlation Summary
| Measurement | Guamanian/Chamorro | Yakama |
| Minimum | 1.0% | 3.9% |
| Maximum | 36.7% | 21.5% |
| Range | 35.7% | 17.7% |
| Mean | 10.7% | 10.0% |
| Median | 7.6% | 9.3% |
| Interquartile 25% (IQ1) | 6.5% | 7.3% |
| Interquartile 75% (IQ3) | 13.2% | 12.3% |
| Interquartile Range (IQR) | 6.7% | 5.1% |
| Standard Deviation (Sample) | 8.0% | 4.2% |
| Standard Deviation (Population) | 7.9% | 4.1% |
Similar Demographics by Disability Age 18 to 34
Demographics Similar to Guamanians/Chamorros by Disability Age 18 to 34
In terms of disability age 18 to 34, the demographic groups most similar to Guamanians/Chamorros are Yugoslavian (7.2%, a difference of 0.040%), Malaysian (7.2%, a difference of 0.10%), Immigrants from Liberia (7.1%, a difference of 0.18%), Hungarian (7.1%, a difference of 0.20%), and Immigrants from Zaire (7.1%, a difference of 0.31%).
| Demographics | Rating | Rank | Disability Age 18 to 34 |
| Nepalese | 1.1 /100 | #241 | Tragic 7.1% |
| Immigrants | Congo | 1.1 /100 | #242 | Tragic 7.1% |
| Icelanders | 1.0 /100 | #243 | Tragic 7.1% |
| Immigrants | Zaire | 0.9 /100 | #244 | Tragic 7.1% |
| Hungarians | 0.9 /100 | #245 | Tragic 7.1% |
| Immigrants | Liberia | 0.8 /100 | #246 | Tragic 7.1% |
| Yugoslavians | 0.8 /100 | #247 | Tragic 7.2% |
| Guamanians/Chamorros | 0.8 /100 | #248 | Tragic 7.2% |
| Malaysians | 0.7 /100 | #249 | Tragic 7.2% |
| Fijians | 0.6 /100 | #250 | Tragic 7.2% |
| Spaniards | 0.6 /100 | #251 | Tragic 7.2% |
| Poles | 0.6 /100 | #252 | Tragic 7.2% |
| Croatians | 0.5 /100 | #253 | Tragic 7.2% |
| Indonesians | 0.4 /100 | #254 | Tragic 7.2% |
| Immigrants | Germany | 0.4 /100 | #255 | Tragic 7.2% |
Demographics Similar to Yakama by Disability Age 18 to 34
In terms of disability age 18 to 34, the demographic groups most similar to Yakama are Chippewa (9.0%, a difference of 0.010%), Chickasaw (9.0%, a difference of 0.050%), Choctaw (9.0%, a difference of 0.14%), Creek (9.0%, a difference of 0.39%), and Kiowa (8.8%, a difference of 1.6%).
| Demographics | Rating | Rank | Disability Age 18 to 34 |
| Apache | 0.0 /100 | #333 | Tragic 8.4% |
| Dutch West Indians | 0.0 /100 | #334 | Tragic 8.4% |
| Seminole | 0.0 /100 | #335 | Tragic 8.4% |
| Immigrants | Azores | 0.0 /100 | #336 | Tragic 8.5% |
| Ottawa | 0.0 /100 | #337 | Tragic 8.6% |
| Cherokee | 0.0 /100 | #338 | Tragic 8.7% |
| Kiowa | 0.0 /100 | #339 | Tragic 8.8% |
| Choctaw | 0.0 /100 | #340 | Tragic 9.0% |
| Chickasaw | 0.0 /100 | #341 | Tragic 9.0% |
| Yakama | 0.0 /100 | #342 | Tragic 9.0% |
| Chippewa | 0.0 /100 | #343 | Tragic 9.0% |
| Creek | 0.0 /100 | #344 | Tragic 9.0% |
| Alaskan Athabascans | 0.0 /100 | #345 | Tragic 9.4% |
| Houma | 0.0 /100 | #346 | Tragic 9.7% |
| Yuman | 0.0 /100 | #347 | Tragic 10.6% |