Guamanian/Chamorro vs Chinese Disability Age 18 to 34
COMPARE
Guamanian/Chamorro
Chinese
Disability Age 18 to 34
Disability Age 18 to 34 Comparison
Guamanians/Chamorros
Chinese
7.2%
DISABILITY AGE 18 TO 34
0.8/ 100
METRIC RATING
248th/ 347
METRIC RANK
6.3%
DISABILITY AGE 18 TO 34
91.9/ 100
METRIC RATING
128th/ 347
METRIC RANK
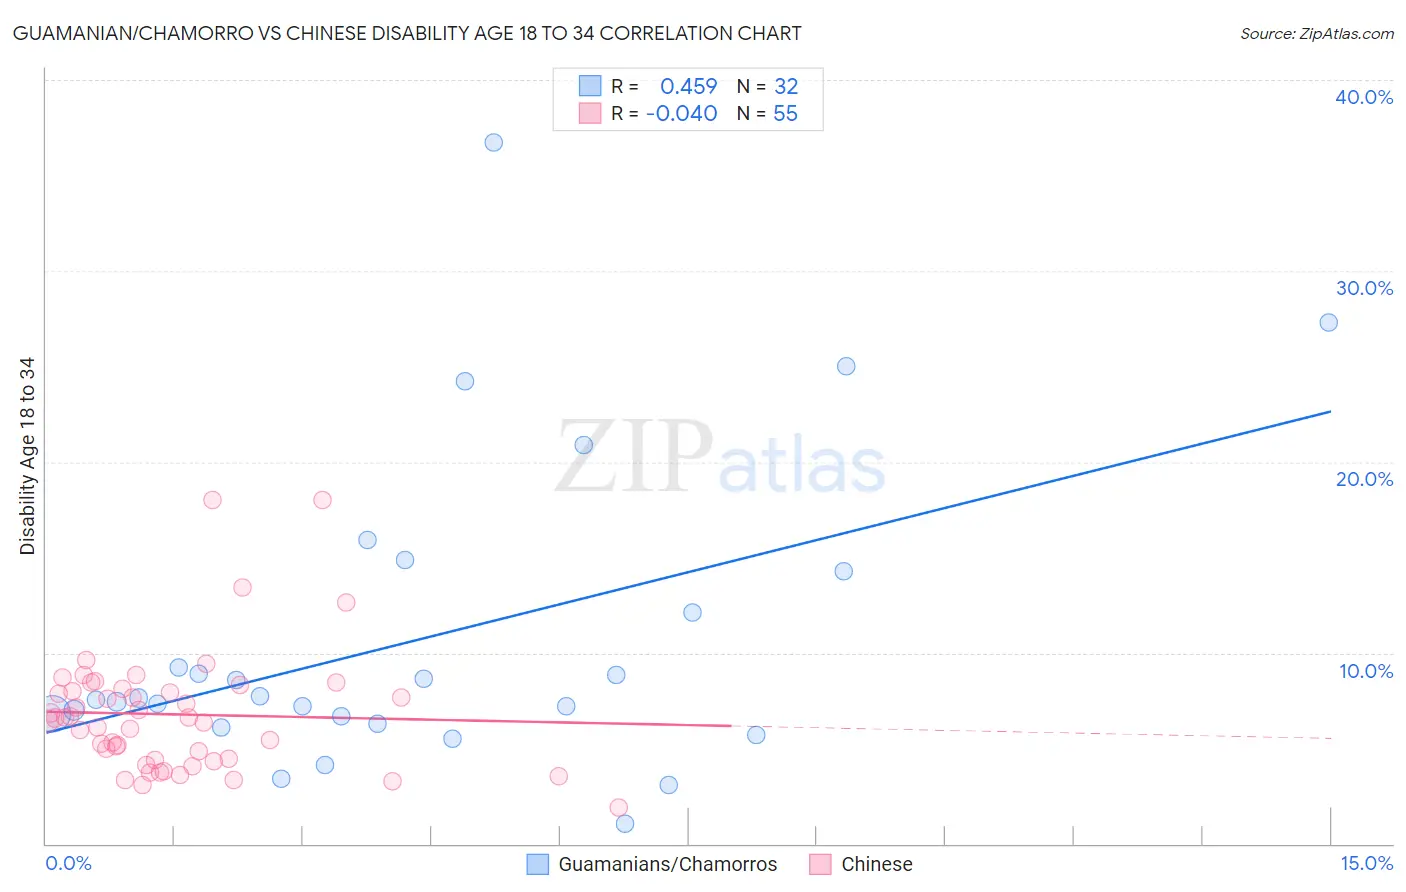
Guamanian/Chamorro vs Chinese Disability Age 18 to 34 Correlation Chart
The statistical analysis conducted on geographies consisting of 221,642,972 people shows a moderate positive correlation between the proportion of Guamanians/Chamorros and percentage of population with a disability between the ages 18 and 35 in the United States with a correlation coefficient (R) of 0.459 and weighted average of 7.2%. Similarly, the statistical analysis conducted on geographies consisting of 64,771,320 people shows no correlation between the proportion of Chinese and percentage of population with a disability between the ages 18 and 35 in the United States with a correlation coefficient (R) of -0.040 and weighted average of 6.3%, a difference of 13.2%.
Disability Age 18 to 34 Correlation Summary
| Measurement | Guamanian/Chamorro | Chinese |
| Minimum | 1.0% | 1.9% |
| Maximum | 36.7% | 18.0% |
| Range | 35.7% | 16.1% |
| Mean | 10.7% | 6.8% |
| Median | 7.6% | 6.6% |
| Interquartile 25% (IQ1) | 6.5% | 4.4% |
| Interquartile 75% (IQ3) | 13.2% | 8.1% |
| Interquartile Range (IQR) | 6.7% | 3.8% |
| Standard Deviation (Sample) | 8.0% | 3.2% |
| Standard Deviation (Population) | 7.9% | 3.2% |
Similar Demographics by Disability Age 18 to 34
Demographics Similar to Guamanians/Chamorros by Disability Age 18 to 34
In terms of disability age 18 to 34, the demographic groups most similar to Guamanians/Chamorros are Yugoslavian (7.2%, a difference of 0.040%), Malaysian (7.2%, a difference of 0.10%), Immigrants from Liberia (7.1%, a difference of 0.18%), Hungarian (7.1%, a difference of 0.20%), and Immigrants from Zaire (7.1%, a difference of 0.31%).
| Demographics | Rating | Rank | Disability Age 18 to 34 |
| Nepalese | 1.1 /100 | #241 | Tragic 7.1% |
| Immigrants | Congo | 1.1 /100 | #242 | Tragic 7.1% |
| Icelanders | 1.0 /100 | #243 | Tragic 7.1% |
| Immigrants | Zaire | 0.9 /100 | #244 | Tragic 7.1% |
| Hungarians | 0.9 /100 | #245 | Tragic 7.1% |
| Immigrants | Liberia | 0.8 /100 | #246 | Tragic 7.1% |
| Yugoslavians | 0.8 /100 | #247 | Tragic 7.2% |
| Guamanians/Chamorros | 0.8 /100 | #248 | Tragic 7.2% |
| Malaysians | 0.7 /100 | #249 | Tragic 7.2% |
| Fijians | 0.6 /100 | #250 | Tragic 7.2% |
| Spaniards | 0.6 /100 | #251 | Tragic 7.2% |
| Poles | 0.6 /100 | #252 | Tragic 7.2% |
| Croatians | 0.5 /100 | #253 | Tragic 7.2% |
| Indonesians | 0.4 /100 | #254 | Tragic 7.2% |
| Immigrants | Germany | 0.4 /100 | #255 | Tragic 7.2% |
Demographics Similar to Chinese by Disability Age 18 to 34
In terms of disability age 18 to 34, the demographic groups most similar to Chinese are West Indian (6.3%, a difference of 0.010%), Immigrants from Switzerland (6.3%, a difference of 0.15%), Macedonian (6.3%, a difference of 0.18%), Immigrants from Morocco (6.3%, a difference of 0.24%), and Costa Rican (6.3%, a difference of 0.26%).
| Demographics | Rating | Rank | Disability Age 18 to 34 |
| Immigrants | Guatemala | 93.4 /100 | #121 | Exceptional 6.3% |
| Immigrants | Czechoslovakia | 93.3 /100 | #122 | Exceptional 6.3% |
| Costa Ricans | 92.9 /100 | #123 | Exceptional 6.3% |
| Immigrants | Morocco | 92.9 /100 | #124 | Exceptional 6.3% |
| Macedonians | 92.6 /100 | #125 | Exceptional 6.3% |
| Immigrants | Switzerland | 92.5 /100 | #126 | Exceptional 6.3% |
| West Indians | 92.0 /100 | #127 | Exceptional 6.3% |
| Chinese | 91.9 /100 | #128 | Exceptional 6.3% |
| Immigrants | Italy | 90.5 /100 | #129 | Exceptional 6.3% |
| Immigrants | Dominica | 90.5 /100 | #130 | Exceptional 6.3% |
| Immigrants | Saudi Arabia | 90.4 /100 | #131 | Exceptional 6.3% |
| Guatemalans | 89.6 /100 | #132 | Excellent 6.4% |
| Brazilians | 89.0 /100 | #133 | Excellent 6.4% |
| Immigrants | Europe | 88.8 /100 | #134 | Excellent 6.4% |
| Palestinians | 88.5 /100 | #135 | Excellent 6.4% |