Guamanian/Chamorro vs Nigerian Disability Age 18 to 34
COMPARE
Guamanian/Chamorro
Nigerian
Disability Age 18 to 34
Disability Age 18 to 34 Comparison
Guamanians/Chamorros
Nigerians
7.2%
DISABILITY AGE 18 TO 34
0.8/ 100
METRIC RATING
248th/ 347
METRIC RANK
6.6%
DISABILITY AGE 18 TO 34
43.7/ 100
METRIC RATING
178th/ 347
METRIC RANK
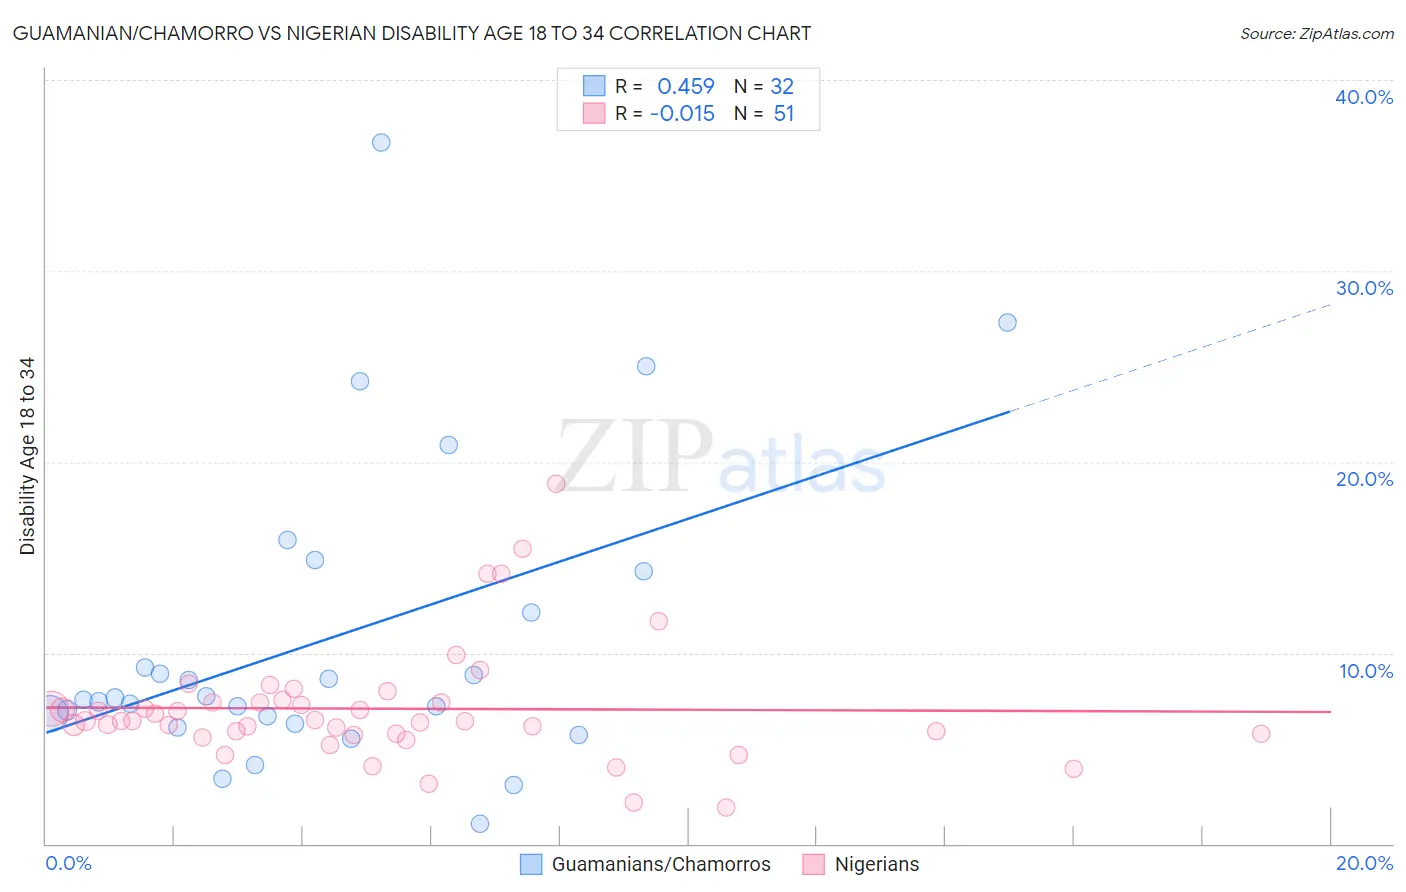
Guamanian/Chamorro vs Nigerian Disability Age 18 to 34 Correlation Chart
The statistical analysis conducted on geographies consisting of 221,642,972 people shows a moderate positive correlation between the proportion of Guamanians/Chamorros and percentage of population with a disability between the ages 18 and 35 in the United States with a correlation coefficient (R) of 0.459 and weighted average of 7.2%. Similarly, the statistical analysis conducted on geographies consisting of 332,463,027 people shows no correlation between the proportion of Nigerians and percentage of population with a disability between the ages 18 and 35 in the United States with a correlation coefficient (R) of -0.015 and weighted average of 6.6%, a difference of 8.0%.
Disability Age 18 to 34 Correlation Summary
| Measurement | Guamanian/Chamorro | Nigerian |
| Minimum | 1.0% | 1.9% |
| Maximum | 36.7% | 18.8% |
| Range | 35.7% | 17.0% |
| Mean | 10.7% | 7.1% |
| Median | 7.6% | 6.4% |
| Interquartile 25% (IQ1) | 6.5% | 5.8% |
| Interquartile 75% (IQ3) | 13.2% | 7.4% |
| Interquartile Range (IQR) | 6.7% | 1.7% |
| Standard Deviation (Sample) | 8.0% | 3.1% |
| Standard Deviation (Population) | 7.9% | 3.1% |
Similar Demographics by Disability Age 18 to 34
Demographics Similar to Guamanians/Chamorros by Disability Age 18 to 34
In terms of disability age 18 to 34, the demographic groups most similar to Guamanians/Chamorros are Yugoslavian (7.2%, a difference of 0.040%), Malaysian (7.2%, a difference of 0.10%), Immigrants from Liberia (7.1%, a difference of 0.18%), Hungarian (7.1%, a difference of 0.20%), and Immigrants from Zaire (7.1%, a difference of 0.31%).
| Demographics | Rating | Rank | Disability Age 18 to 34 |
| Nepalese | 1.1 /100 | #241 | Tragic 7.1% |
| Immigrants | Congo | 1.1 /100 | #242 | Tragic 7.1% |
| Icelanders | 1.0 /100 | #243 | Tragic 7.1% |
| Immigrants | Zaire | 0.9 /100 | #244 | Tragic 7.1% |
| Hungarians | 0.9 /100 | #245 | Tragic 7.1% |
| Immigrants | Liberia | 0.8 /100 | #246 | Tragic 7.1% |
| Yugoslavians | 0.8 /100 | #247 | Tragic 7.2% |
| Guamanians/Chamorros | 0.8 /100 | #248 | Tragic 7.2% |
| Malaysians | 0.7 /100 | #249 | Tragic 7.2% |
| Fijians | 0.6 /100 | #250 | Tragic 7.2% |
| Spaniards | 0.6 /100 | #251 | Tragic 7.2% |
| Poles | 0.6 /100 | #252 | Tragic 7.2% |
| Croatians | 0.5 /100 | #253 | Tragic 7.2% |
| Indonesians | 0.4 /100 | #254 | Tragic 7.2% |
| Immigrants | Germany | 0.4 /100 | #255 | Tragic 7.2% |
Demographics Similar to Nigerians by Disability Age 18 to 34
In terms of disability age 18 to 34, the demographic groups most similar to Nigerians are Syrian (6.6%, a difference of 0.040%), Immigrants from Ghana (6.6%, a difference of 0.11%), Immigrants from Africa (6.6%, a difference of 0.15%), Immigrants from Cambodia (6.6%, a difference of 0.19%), and Immigrants from Austria (6.6%, a difference of 0.29%).
| Demographics | Rating | Rank | Disability Age 18 to 34 |
| Bahamians | 55.5 /100 | #171 | Average 6.6% |
| Ghanaians | 54.7 /100 | #172 | Average 6.6% |
| Immigrants | Mexico | 54.1 /100 | #173 | Average 6.6% |
| Native Hawaiians | 50.0 /100 | #174 | Average 6.6% |
| Immigrants | Cambodia | 46.5 /100 | #175 | Average 6.6% |
| Immigrants | Africa | 45.9 /100 | #176 | Average 6.6% |
| Syrians | 44.3 /100 | #177 | Average 6.6% |
| Nigerians | 43.7 /100 | #178 | Average 6.6% |
| Immigrants | Ghana | 42.1 /100 | #179 | Average 6.6% |
| Immigrants | Austria | 39.6 /100 | #180 | Fair 6.6% |
| Romanians | 39.5 /100 | #181 | Fair 6.6% |
| U.S. Virgin Islanders | 38.6 /100 | #182 | Fair 6.7% |
| Immigrants | Iraq | 37.4 /100 | #183 | Fair 6.7% |
| Iraqis | 37.4 /100 | #184 | Fair 6.7% |
| Immigrants | Oceania | 35.4 /100 | #185 | Fair 6.7% |