Guamanian/Chamorro vs Immigrants from Austria Ambulatory Disability
COMPARE
Guamanian/Chamorro
Immigrants from Austria
Ambulatory Disability
Ambulatory Disability Comparison
Guamanians/Chamorros
Immigrants from Austria
6.3%
AMBULATORY DISABILITY
10.6/ 100
METRIC RATING
218th/ 347
METRIC RANK
6.0%
AMBULATORY DISABILITY
78.8/ 100
METRIC RATING
152nd/ 347
METRIC RANK
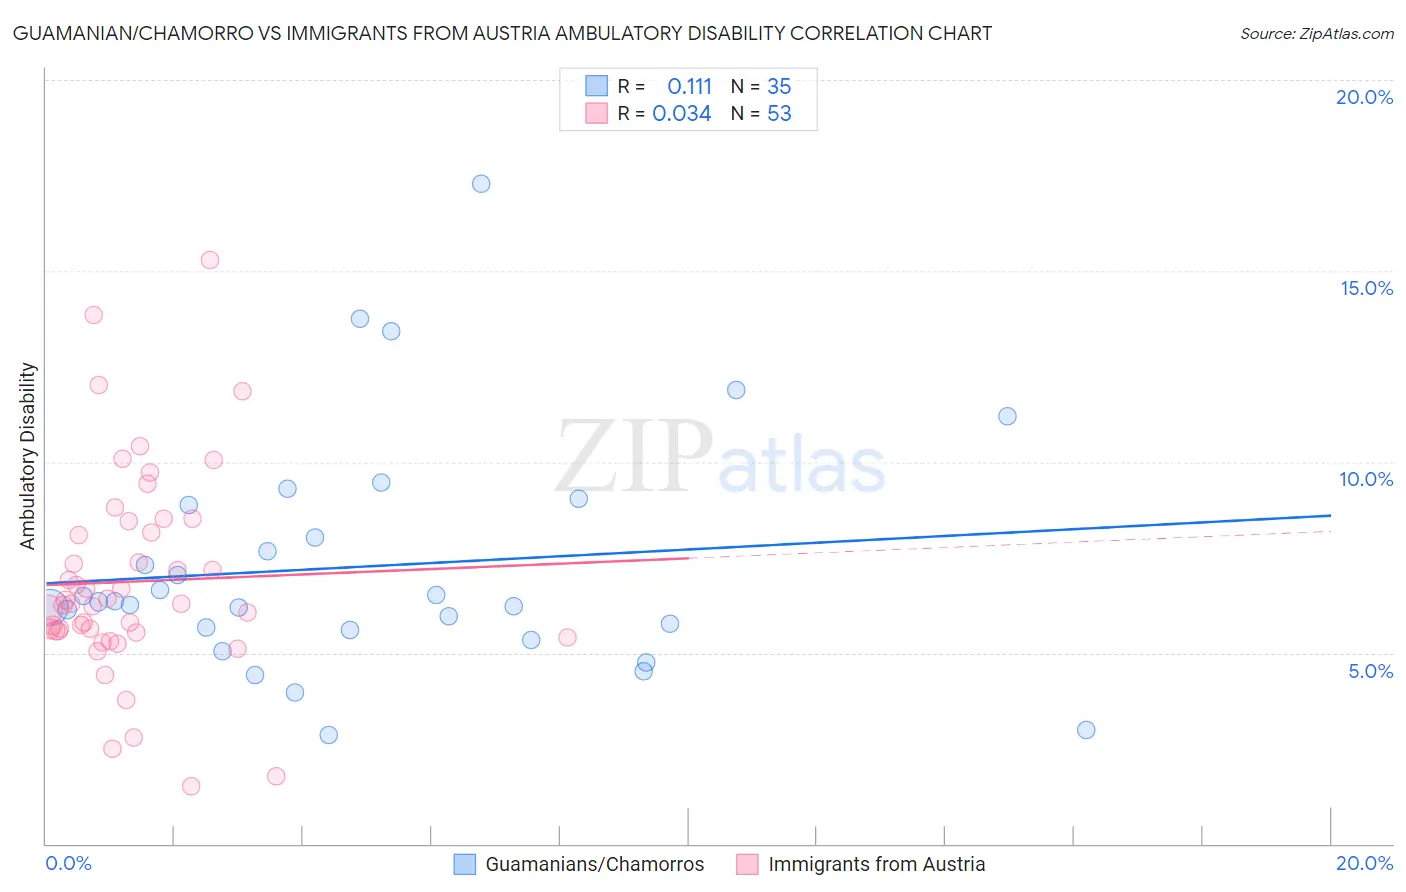
Guamanian/Chamorro vs Immigrants from Austria Ambulatory Disability Correlation Chart
The statistical analysis conducted on geographies consisting of 221,865,083 people shows a poor positive correlation between the proportion of Guamanians/Chamorros and percentage of population with ambulatory disability in the United States with a correlation coefficient (R) of 0.111 and weighted average of 6.3%. Similarly, the statistical analysis conducted on geographies consisting of 167,968,225 people shows no correlation between the proportion of Immigrants from Austria and percentage of population with ambulatory disability in the United States with a correlation coefficient (R) of 0.034 and weighted average of 6.0%, a difference of 4.6%.
Ambulatory Disability Correlation Summary
| Measurement | Guamanian/Chamorro | Immigrants from Austria |
| Minimum | 2.8% | 1.5% |
| Maximum | 17.3% | 15.3% |
| Range | 14.4% | 13.8% |
| Mean | 7.3% | 6.9% |
| Median | 6.3% | 6.3% |
| Interquartile 25% (IQ1) | 5.6% | 5.6% |
| Interquartile 75% (IQ3) | 8.9% | 8.3% |
| Interquartile Range (IQR) | 3.3% | 2.7% |
| Standard Deviation (Sample) | 3.1% | 2.7% |
| Standard Deviation (Population) | 3.1% | 2.7% |
Similar Demographics by Ambulatory Disability
Demographics Similar to Guamanians/Chamorros by Ambulatory Disability
In terms of ambulatory disability, the demographic groups most similar to Guamanians/Chamorros are Canadian (6.3%, a difference of 0.040%), Yugoslavian (6.3%, a difference of 0.040%), Immigrants from Latin America (6.3%, a difference of 0.050%), Immigrants from Mexico (6.3%, a difference of 0.060%), and Indonesian (6.3%, a difference of 0.10%).
| Demographics | Rating | Rank | Ambulatory Disability |
| Samoans | 12.1 /100 | #211 | Poor 6.3% |
| Mexican American Indians | 12.0 /100 | #212 | Poor 6.3% |
| Japanese | 12.0 /100 | #213 | Poor 6.3% |
| Immigrants | Mexico | 11.0 /100 | #214 | Poor 6.3% |
| Immigrants | Latin America | 11.0 /100 | #215 | Poor 6.3% |
| Canadians | 10.9 /100 | #216 | Poor 6.3% |
| Yugoslavians | 10.9 /100 | #217 | Poor 6.3% |
| Guamanians/Chamorros | 10.6 /100 | #218 | Poor 6.3% |
| Indonesians | 9.9 /100 | #219 | Tragic 6.3% |
| Immigrants | Albania | 9.6 /100 | #220 | Tragic 6.3% |
| Hungarians | 9.6 /100 | #221 | Tragic 6.3% |
| German Russians | 9.4 /100 | #222 | Tragic 6.3% |
| Immigrants | Honduras | 7.6 /100 | #223 | Tragic 6.3% |
| Liberians | 7.1 /100 | #224 | Tragic 6.3% |
| Hondurans | 6.3 /100 | #225 | Tragic 6.3% |
Demographics Similar to Immigrants from Austria by Ambulatory Disability
In terms of ambulatory disability, the demographic groups most similar to Immigrants from Austria are Greek (6.0%, a difference of 0.070%), Maltese (6.0%, a difference of 0.25%), Syrian (6.0%, a difference of 0.25%), Lithuanian (6.0%, a difference of 0.27%), and Immigrants from Eastern Europe (6.0%, a difference of 0.28%).
| Demographics | Rating | Rank | Ambulatory Disability |
| Pakistanis | 82.5 /100 | #145 | Excellent 6.0% |
| Immigrants | Greece | 82.5 /100 | #146 | Excellent 6.0% |
| Immigrants | Moldova | 82.4 /100 | #147 | Excellent 6.0% |
| Immigrants | Eastern Europe | 82.0 /100 | #148 | Excellent 6.0% |
| Lithuanians | 81.9 /100 | #149 | Excellent 6.0% |
| Maltese | 81.6 /100 | #150 | Excellent 6.0% |
| Greeks | 79.6 /100 | #151 | Good 6.0% |
| Immigrants | Austria | 78.8 /100 | #152 | Good 6.0% |
| Syrians | 75.5 /100 | #153 | Good 6.0% |
| Immigrants | Croatia | 75.1 /100 | #154 | Good 6.0% |
| Immigrants | Scotland | 72.1 /100 | #155 | Good 6.0% |
| Northern Europeans | 71.8 /100 | #156 | Good 6.0% |
| Ghanaians | 71.3 /100 | #157 | Good 6.0% |
| Immigrants | Fiji | 71.2 /100 | #158 | Good 6.0% |
| Immigrants | Latvia | 71.1 /100 | #159 | Good 6.0% |