Colombian vs Immigrants from Congo Disability
COMPARE
Colombian
Immigrants from Congo
Disability
Disability Comparison
Colombians
Immigrants from Congo
11.0%
DISABILITY
99.6/ 100
METRIC RATING
67th/ 347
METRIC RANK
12.2%
DISABILITY
1.9/ 100
METRIC RATING
237th/ 347
METRIC RANK
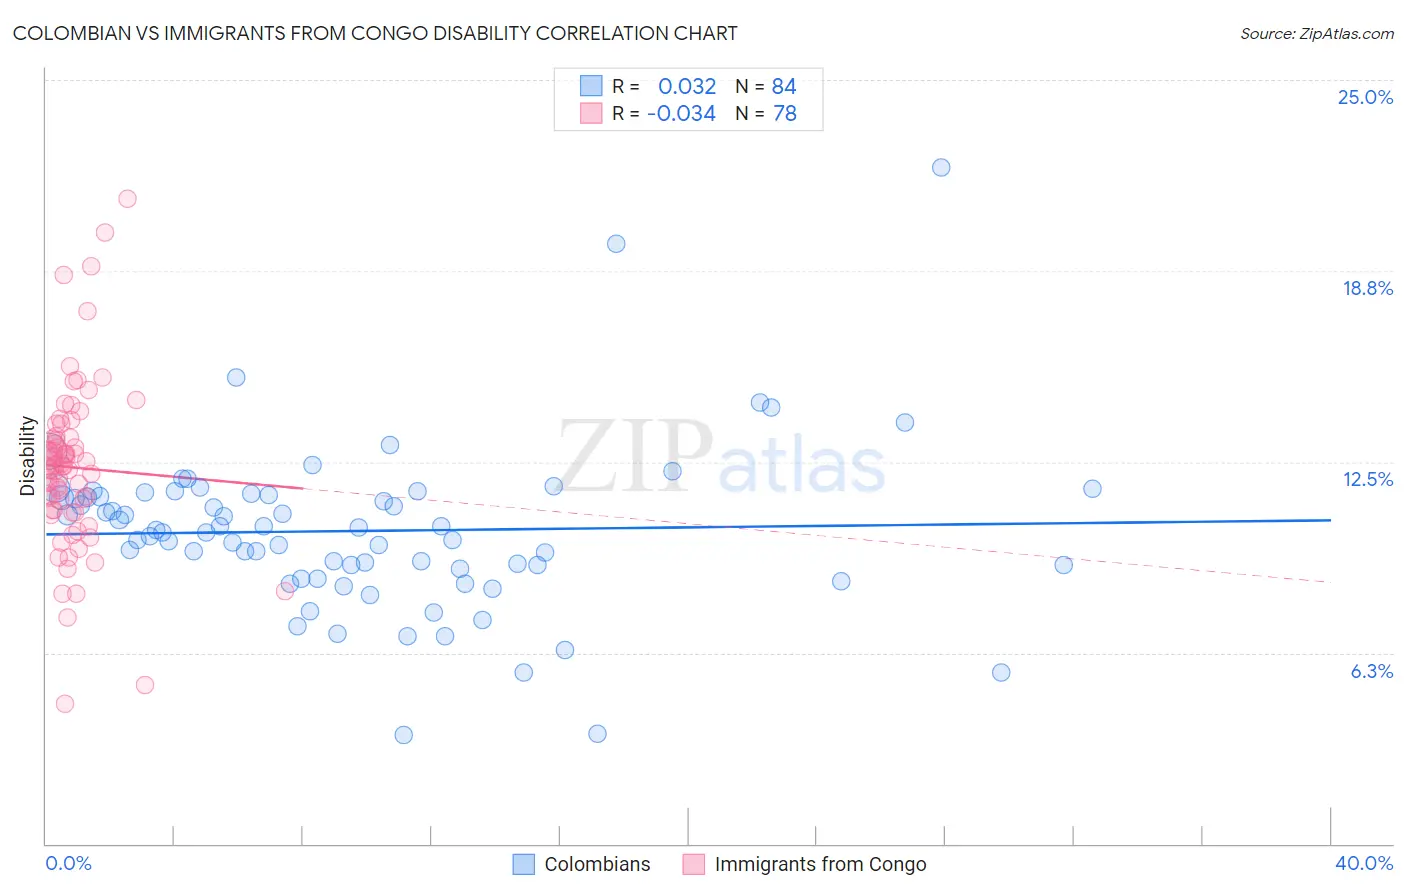
Colombian vs Immigrants from Congo Disability Correlation Chart
The statistical analysis conducted on geographies consisting of 419,613,983 people shows no correlation between the proportion of Colombians and percentage of population with a disability in the United States with a correlation coefficient (R) of 0.032 and weighted average of 11.0%. Similarly, the statistical analysis conducted on geographies consisting of 92,123,108 people shows no correlation between the proportion of Immigrants from Congo and percentage of population with a disability in the United States with a correlation coefficient (R) of -0.034 and weighted average of 12.2%, a difference of 11.2%.
Disability Correlation Summary
| Measurement | Colombian | Immigrants from Congo |
| Minimum | 3.5% | 4.6% |
| Maximum | 22.2% | 21.1% |
| Range | 18.6% | 16.5% |
| Mean | 10.2% | 12.3% |
| Median | 10.2% | 12.4% |
| Interquartile 25% (IQ1) | 9.1% | 10.9% |
| Interquartile 75% (IQ3) | 11.4% | 13.3% |
| Interquartile Range (IQR) | 2.4% | 2.4% |
| Standard Deviation (Sample) | 2.7% | 2.8% |
| Standard Deviation (Population) | 2.7% | 2.8% |
Similar Demographics by Disability
Demographics Similar to Colombians by Disability
In terms of disability, the demographic groups most similar to Colombians are Laotian (11.0%, a difference of 0.080%), Bulgarian (11.0%, a difference of 0.10%), Immigrants from Sweden (11.0%, a difference of 0.11%), Immigrants from Afghanistan (11.0%, a difference of 0.12%), and Immigrants from Eritrea (11.0%, a difference of 0.30%).
| Demographics | Rating | Rank | Disability |
| Zimbabweans | 99.7 /100 | #60 | Exceptional 10.9% |
| Immigrants | Bulgaria | 99.7 /100 | #61 | Exceptional 10.9% |
| Immigrants | Northern Africa | 99.7 /100 | #62 | Exceptional 10.9% |
| Immigrants | Eritrea | 99.7 /100 | #63 | Exceptional 11.0% |
| Immigrants | Sweden | 99.6 /100 | #64 | Exceptional 11.0% |
| Bulgarians | 99.6 /100 | #65 | Exceptional 11.0% |
| Laotians | 99.6 /100 | #66 | Exceptional 11.0% |
| Colombians | 99.6 /100 | #67 | Exceptional 11.0% |
| Immigrants | Afghanistan | 99.6 /100 | #68 | Exceptional 11.0% |
| Sri Lankans | 99.5 /100 | #69 | Exceptional 11.0% |
| Immigrants | France | 99.4 /100 | #70 | Exceptional 11.0% |
| Immigrants | Lebanon | 99.4 /100 | #71 | Exceptional 11.0% |
| Immigrants | Chile | 99.4 /100 | #72 | Exceptional 11.0% |
| Immigrants | Bangladesh | 99.4 /100 | #73 | Exceptional 11.0% |
| Immigrants | Serbia | 99.4 /100 | #74 | Exceptional 11.0% |
Demographics Similar to Immigrants from Congo by Disability
In terms of disability, the demographic groups most similar to Immigrants from Congo are Norwegian (12.2%, a difference of 0.040%), Chinese (12.2%, a difference of 0.050%), Swedish (12.2%, a difference of 0.080%), Hungarian (12.2%, a difference of 0.13%), and Yugoslavian (12.2%, a difference of 0.13%).
| Demographics | Rating | Rank | Disability |
| Samoans | 2.6 /100 | #230 | Tragic 12.2% |
| Malaysians | 2.5 /100 | #231 | Tragic 12.2% |
| Italians | 2.5 /100 | #232 | Tragic 12.2% |
| Bahamians | 2.3 /100 | #233 | Tragic 12.2% |
| Japanese | 2.3 /100 | #234 | Tragic 12.2% |
| Yup'ik | 2.2 /100 | #235 | Tragic 12.2% |
| Chinese | 2.0 /100 | #236 | Tragic 12.2% |
| Immigrants | Congo | 1.9 /100 | #237 | Tragic 12.2% |
| Norwegians | 1.9 /100 | #238 | Tragic 12.2% |
| Swedes | 1.8 /100 | #239 | Tragic 12.2% |
| Hungarians | 1.7 /100 | #240 | Tragic 12.2% |
| Yugoslavians | 1.7 /100 | #241 | Tragic 12.2% |
| Poles | 1.7 /100 | #242 | Tragic 12.2% |
| British | 1.5 /100 | #243 | Tragic 12.2% |
| Basques | 1.5 /100 | #244 | Tragic 12.2% |