Colombian vs Soviet Union Disability
COMPARE
Colombian
Soviet Union
Disability
Disability Comparison
Colombians
Soviet Union
11.0%
DISABILITY
99.6/ 100
METRIC RATING
67th/ 347
METRIC RANK
10.9%
DISABILITY
99.9/ 100
METRIC RATING
48th/ 347
METRIC RANK
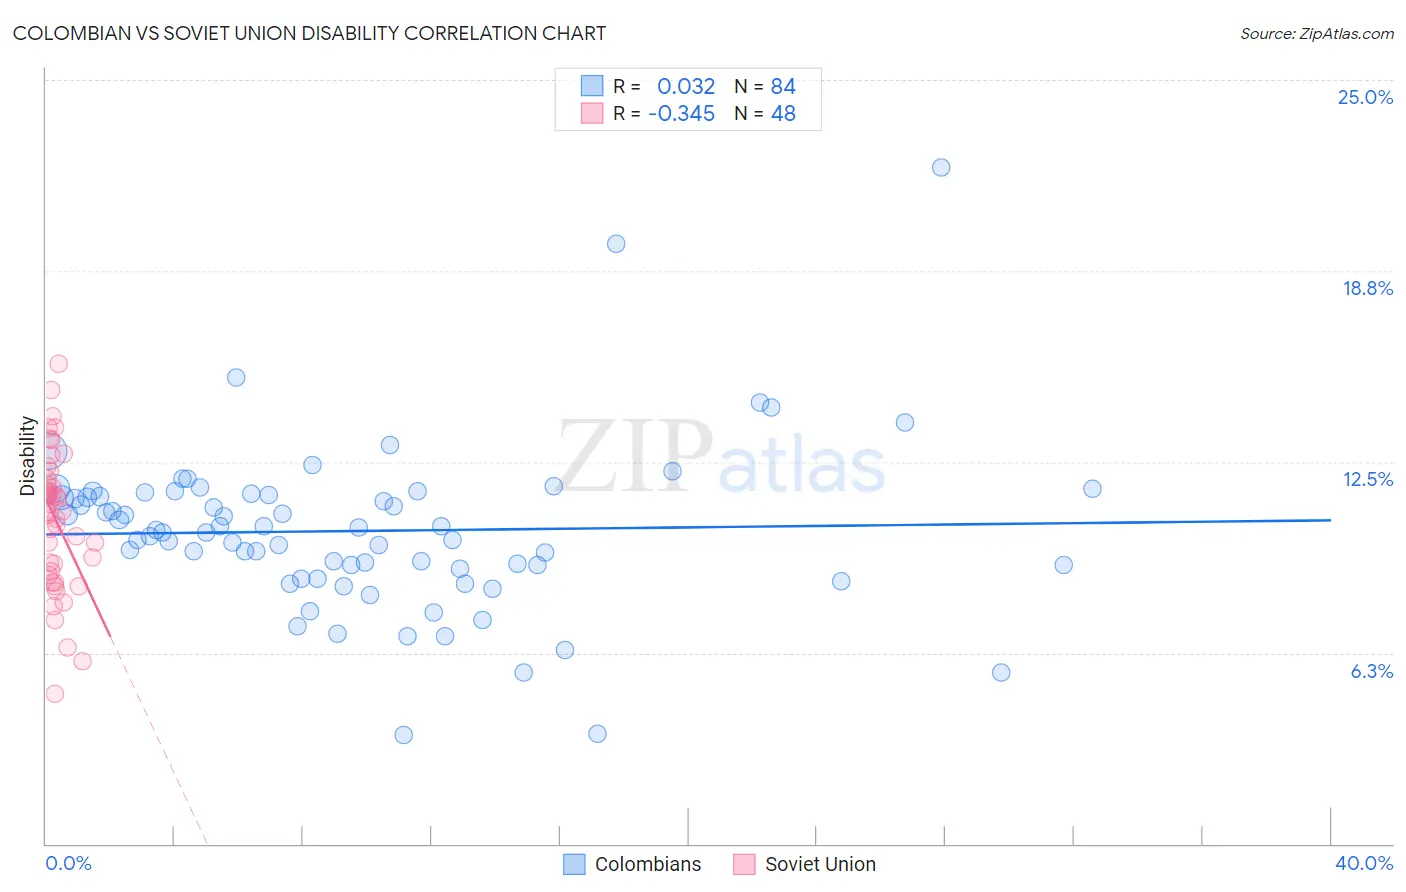
Colombian vs Soviet Union Disability Correlation Chart
The statistical analysis conducted on geographies consisting of 419,613,983 people shows no correlation between the proportion of Colombians and percentage of population with a disability in the United States with a correlation coefficient (R) of 0.032 and weighted average of 11.0%. Similarly, the statistical analysis conducted on geographies consisting of 43,487,843 people shows a mild negative correlation between the proportion of Soviet Union and percentage of population with a disability in the United States with a correlation coefficient (R) of -0.345 and weighted average of 10.9%, a difference of 1.2%.
Disability Correlation Summary
| Measurement | Colombian | Soviet Union |
| Minimum | 3.5% | 4.9% |
| Maximum | 22.2% | 15.7% |
| Range | 18.6% | 10.8% |
| Mean | 10.2% | 10.6% |
| Median | 10.2% | 10.9% |
| Interquartile 25% (IQ1) | 9.1% | 8.9% |
| Interquartile 75% (IQ3) | 11.4% | 11.8% |
| Interquartile Range (IQR) | 2.4% | 3.0% |
| Standard Deviation (Sample) | 2.7% | 2.3% |
| Standard Deviation (Population) | 2.7% | 2.3% |
Demographics Similar to Colombians and Soviet Union by Disability
In terms of disability, the demographic groups most similar to Colombians are Laotian (11.0%, a difference of 0.080%), Bulgarian (11.0%, a difference of 0.10%), Immigrants from Sweden (11.0%, a difference of 0.11%), Immigrants from Eritrea (11.0%, a difference of 0.30%), and Immigrants from Northern Africa (10.9%, a difference of 0.31%). Similarly, the demographic groups most similar to Soviet Union are Vietnamese (10.9%, a difference of 0.060%), Immigrants from Saudi Arabia (10.9%, a difference of 0.060%), Peruvian (10.9%, a difference of 0.070%), South American (10.9%, a difference of 0.13%), and Immigrants from Spain (10.9%, a difference of 0.15%).
| Demographics | Rating | Rank | Disability |
| Taiwanese | 99.9 /100 | #47 | Exceptional 10.8% |
| Soviet Union | 99.9 /100 | #48 | Exceptional 10.9% |
| Vietnamese | 99.9 /100 | #49 | Exceptional 10.9% |
| Immigrants | Saudi Arabia | 99.9 /100 | #50 | Exceptional 10.9% |
| Peruvians | 99.8 /100 | #51 | Exceptional 10.9% |
| South Americans | 99.8 /100 | #52 | Exceptional 10.9% |
| Immigrants | Spain | 99.8 /100 | #53 | Exceptional 10.9% |
| Jordanians | 99.8 /100 | #54 | Exceptional 10.9% |
| Immigrants | El Salvador | 99.8 /100 | #55 | Exceptional 10.9% |
| Immigrants | Lithuania | 99.8 /100 | #56 | Exceptional 10.9% |
| Salvadorans | 99.8 /100 | #57 | Exceptional 10.9% |
| Immigrants | South America | 99.8 /100 | #58 | Exceptional 10.9% |
| Immigrants | Colombia | 99.7 /100 | #59 | Exceptional 10.9% |
| Zimbabweans | 99.7 /100 | #60 | Exceptional 10.9% |
| Immigrants | Bulgaria | 99.7 /100 | #61 | Exceptional 10.9% |
| Immigrants | Northern Africa | 99.7 /100 | #62 | Exceptional 10.9% |
| Immigrants | Eritrea | 99.7 /100 | #63 | Exceptional 11.0% |
| Immigrants | Sweden | 99.6 /100 | #64 | Exceptional 11.0% |
| Bulgarians | 99.6 /100 | #65 | Exceptional 11.0% |
| Laotians | 99.6 /100 | #66 | Exceptional 11.0% |
| Colombians | 99.6 /100 | #67 | Exceptional 11.0% |