Colombian vs Ukrainian Disability
COMPARE
Colombian
Ukrainian
Disability
Disability Comparison
Colombians
Ukrainians
11.0%
DISABILITY
99.6/ 100
METRIC RATING
67th/ 347
METRIC RANK
11.9%
DISABILITY
14.7/ 100
METRIC RATING
198th/ 347
METRIC RANK
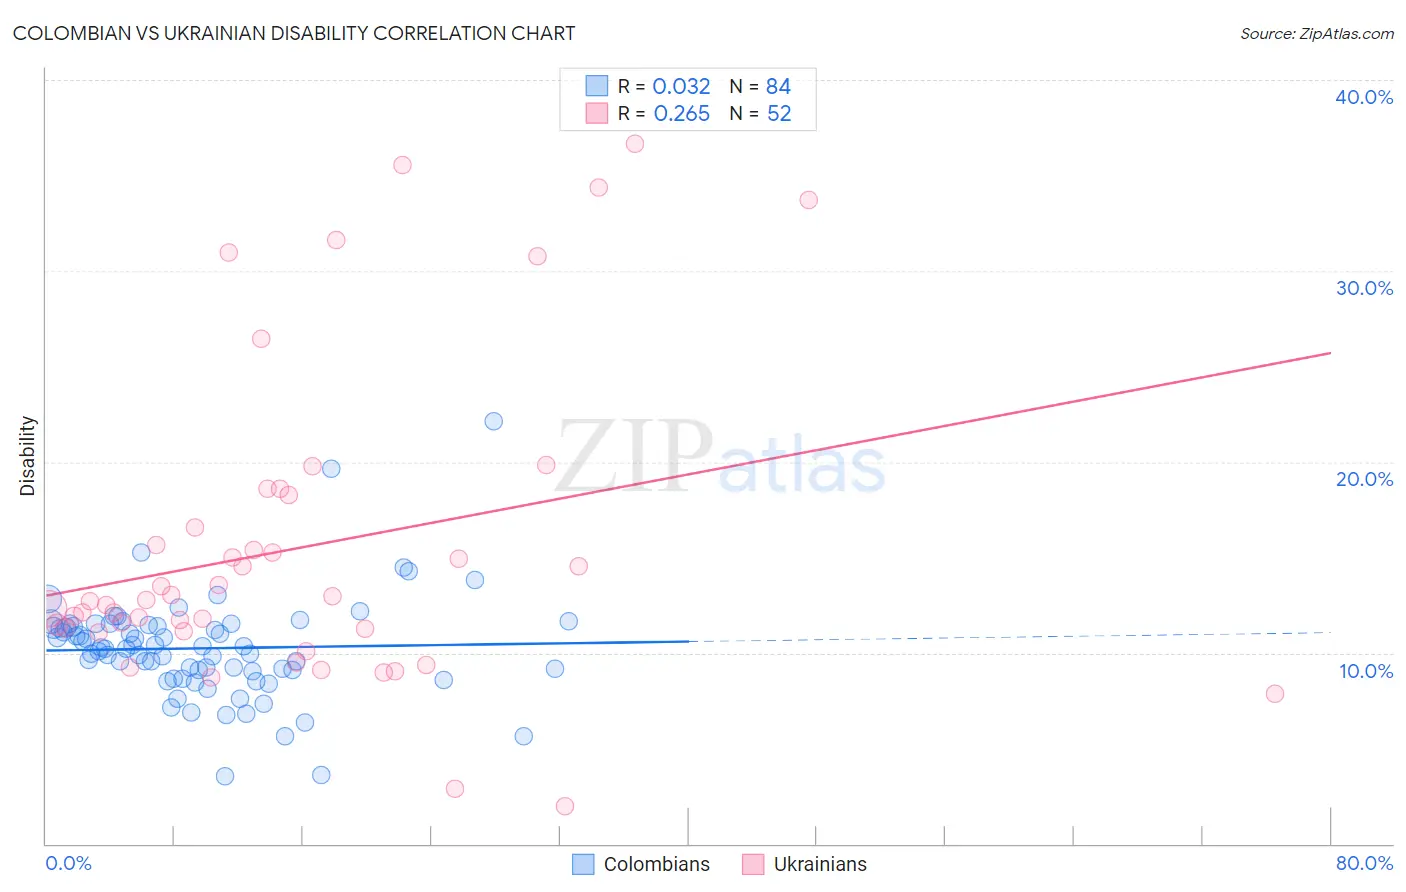
Colombian vs Ukrainian Disability Correlation Chart
The statistical analysis conducted on geographies consisting of 419,613,983 people shows no correlation between the proportion of Colombians and percentage of population with a disability in the United States with a correlation coefficient (R) of 0.032 and weighted average of 11.0%. Similarly, the statistical analysis conducted on geographies consisting of 448,640,628 people shows a weak positive correlation between the proportion of Ukrainians and percentage of population with a disability in the United States with a correlation coefficient (R) of 0.265 and weighted average of 11.9%, a difference of 8.6%.
Disability Correlation Summary
| Measurement | Colombian | Ukrainian |
| Minimum | 3.5% | 1.9% |
| Maximum | 22.2% | 36.7% |
| Range | 18.6% | 34.7% |
| Mean | 10.2% | 15.5% |
| Median | 10.2% | 12.7% |
| Interquartile 25% (IQ1) | 9.1% | 11.2% |
| Interquartile 75% (IQ3) | 11.4% | 17.4% |
| Interquartile Range (IQR) | 2.4% | 6.2% |
| Standard Deviation (Sample) | 2.7% | 8.2% |
| Standard Deviation (Population) | 2.7% | 8.1% |
Similar Demographics by Disability
Demographics Similar to Colombians by Disability
In terms of disability, the demographic groups most similar to Colombians are Laotian (11.0%, a difference of 0.080%), Bulgarian (11.0%, a difference of 0.10%), Immigrants from Sweden (11.0%, a difference of 0.11%), Immigrants from Afghanistan (11.0%, a difference of 0.12%), and Immigrants from Eritrea (11.0%, a difference of 0.30%).
| Demographics | Rating | Rank | Disability |
| Zimbabweans | 99.7 /100 | #60 | Exceptional 10.9% |
| Immigrants | Bulgaria | 99.7 /100 | #61 | Exceptional 10.9% |
| Immigrants | Northern Africa | 99.7 /100 | #62 | Exceptional 10.9% |
| Immigrants | Eritrea | 99.7 /100 | #63 | Exceptional 11.0% |
| Immigrants | Sweden | 99.6 /100 | #64 | Exceptional 11.0% |
| Bulgarians | 99.6 /100 | #65 | Exceptional 11.0% |
| Laotians | 99.6 /100 | #66 | Exceptional 11.0% |
| Colombians | 99.6 /100 | #67 | Exceptional 11.0% |
| Immigrants | Afghanistan | 99.6 /100 | #68 | Exceptional 11.0% |
| Sri Lankans | 99.5 /100 | #69 | Exceptional 11.0% |
| Immigrants | France | 99.4 /100 | #70 | Exceptional 11.0% |
| Immigrants | Lebanon | 99.4 /100 | #71 | Exceptional 11.0% |
| Immigrants | Chile | 99.4 /100 | #72 | Exceptional 11.0% |
| Immigrants | Bangladesh | 99.4 /100 | #73 | Exceptional 11.0% |
| Immigrants | Serbia | 99.4 /100 | #74 | Exceptional 11.0% |
Demographics Similar to Ukrainians by Disability
In terms of disability, the demographic groups most similar to Ukrainians are Immigrants from Panama (11.9%, a difference of 0.010%), Immigrants from Belize (11.9%, a difference of 0.050%), Serbian (11.9%, a difference of 0.060%), Barbadian (11.9%, a difference of 0.10%), and Belizean (11.9%, a difference of 0.17%).
| Demographics | Rating | Rank | Disability |
| Ute | 19.5 /100 | #191 | Poor 11.9% |
| Lithuanians | 18.8 /100 | #192 | Poor 11.9% |
| Immigrants | Bosnia and Herzegovina | 18.0 /100 | #193 | Poor 11.9% |
| Somalis | 17.3 /100 | #194 | Poor 11.9% |
| Barbadians | 15.8 /100 | #195 | Poor 11.9% |
| Serbians | 15.4 /100 | #196 | Poor 11.9% |
| Immigrants | Belize | 15.2 /100 | #197 | Poor 11.9% |
| Ukrainians | 14.7 /100 | #198 | Poor 11.9% |
| Immigrants | Panama | 14.6 /100 | #199 | Poor 11.9% |
| Belizeans | 12.8 /100 | #200 | Poor 11.9% |
| Assyrians/Chaldeans/Syriacs | 12.6 /100 | #201 | Poor 11.9% |
| Immigrants | England | 12.0 /100 | #202 | Poor 12.0% |
| British West Indians | 11.5 /100 | #203 | Poor 12.0% |
| Mexican American Indians | 11.4 /100 | #204 | Poor 12.0% |
| Immigrants | Western Europe | 10.1 /100 | #205 | Poor 12.0% |