Zip Codes with the Highest Percentage of Population Employed in Legal Services & Support in Golden, CO
RELATED REPORTS & OPTIONS
Legal Services & Support
Golden
Compare Zip Codes
Map of Zip Codes with the Highest Percentage of Population Employed in Legal Services & Support in Golden
0.37%
1.5%
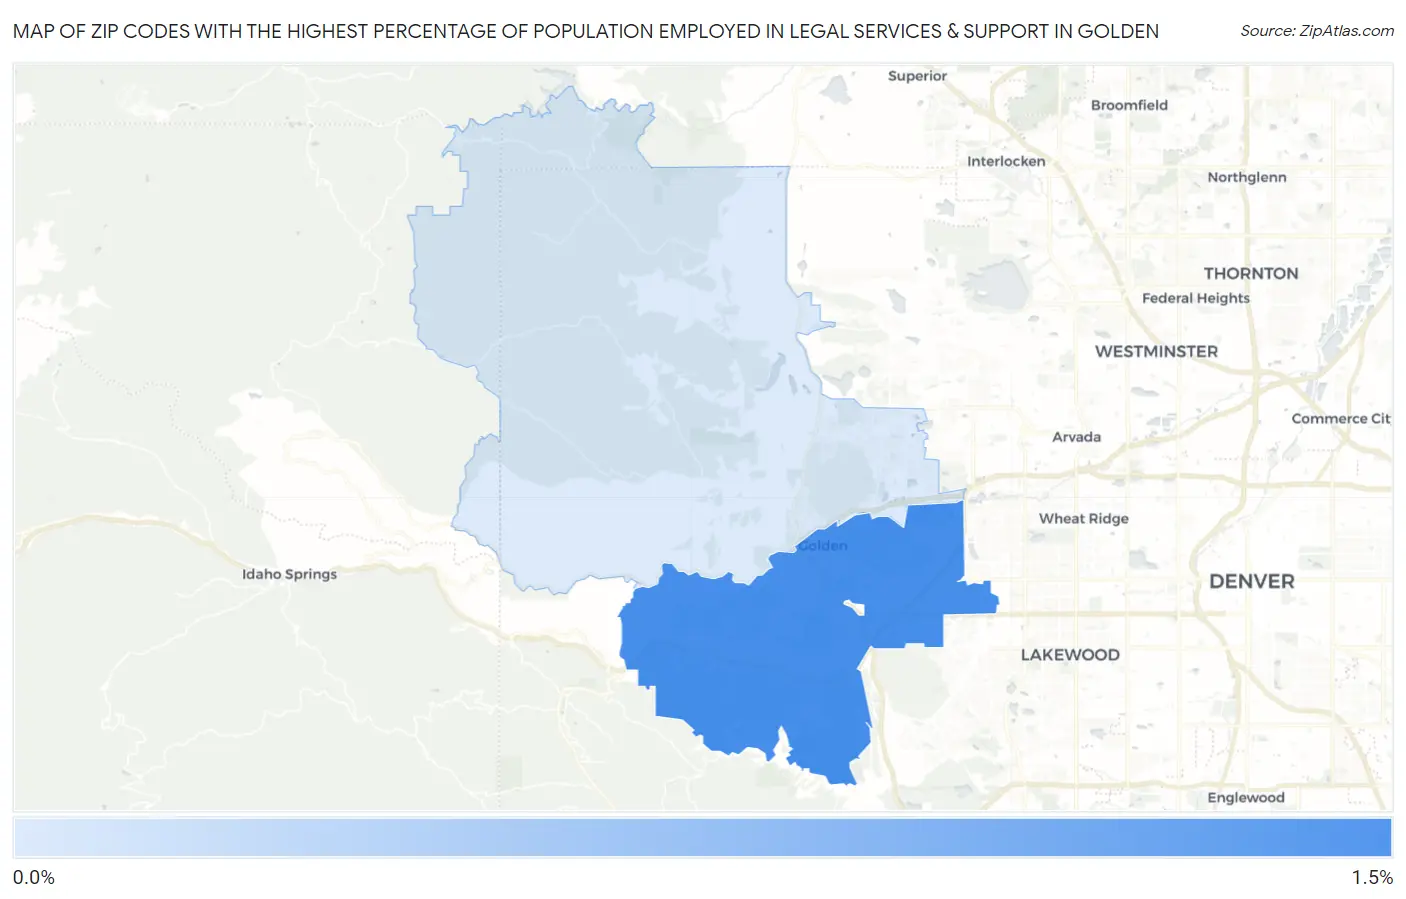
Zip Codes with the Highest Percentage of Population Employed in Legal Services & Support in Golden, CO
| Zip Code | % Employed | vs State | vs National | |
| 1. | 80401 | 1.5% | 1.2%(+0.292)#105 | 1.2%(+0.293)#5,145 |
| 2. | 80403 | 0.37% | 1.2%(-0.812)#249 | 1.2%(-0.812)#14,171 |
1
Common Questions
What are the Top Zip Codes with the Highest Percentage of Population Employed in Legal Services & Support in Golden, CO?
Top Zip Codes with the Highest Percentage of Population Employed in Legal Services & Support in Golden, CO are:
What zip code has the Highest Percentage of Population Employed in Legal Services & Support in Golden, CO?
80401 has the Highest Percentage of Population Employed in Legal Services & Support in Golden, CO with 1.5%.
What is the Percentage of Population Employed in Legal Services & Support in Golden, CO?
Percentage of Population Employed in Legal Services & Support in Golden is 0.83%.
What is the Percentage of Population Employed in Legal Services & Support in Colorado?
Percentage of Population Employed in Legal Services & Support in Colorado is 1.2%.
What is the Percentage of Population Employed in Legal Services & Support in the United States?
Percentage of Population Employed in Legal Services & Support in the United States is 1.2%.