Zip Codes with the Highest Percentage of Population Taking Taxi / Cab to Work in Golden, CO
RELATED REPORTS & OPTIONS
Taxi / Cab
Golden
Compare Zip Codes
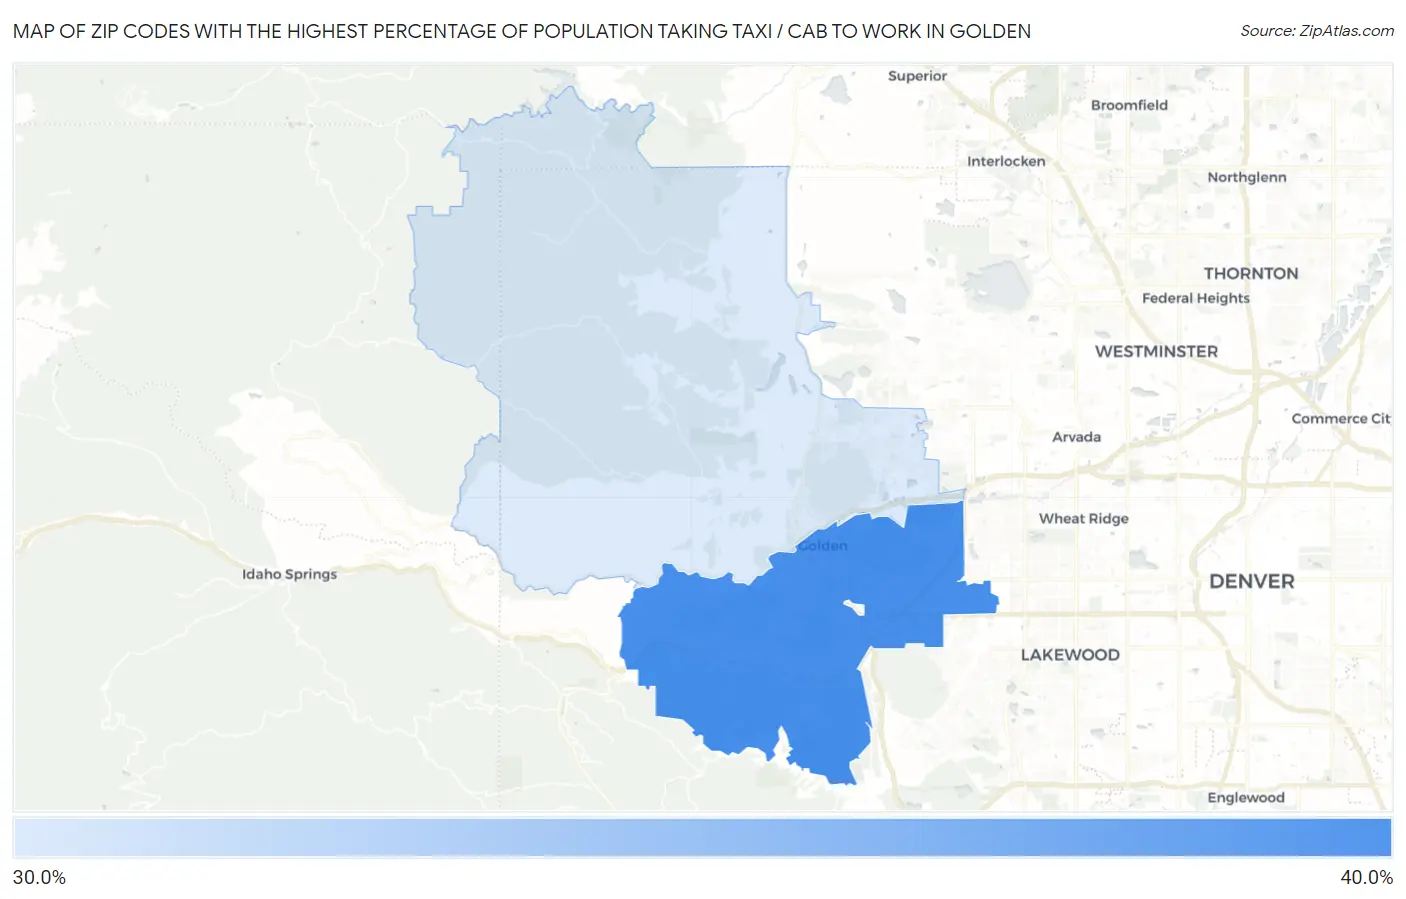
Map of Zip Codes with the Highest Percentage of Population Taking Taxi / Cab to Work in Golden
34.2%
35.3%
Zip Codes with the Highest Percentage of Population Taking Taxi / Cab to Work in Golden, CO
| Zip Code | % Take Taxi / Cab | vs State | vs National | |
| 1. | 80401 | 35.3% | 37.4%(-2.10)#146 | 38.2%(-2.90)#8,775 |
| 2. | 80403 | 34.2% | 37.4%(-3.20)#161 | 38.2%(-4.00)#9,282 |
1
Common Questions
What are the Top Zip Codes with the Highest Percentage of Population Taking Taxi / Cab to Work in Golden, CO?
Top Zip Codes with the Highest Percentage of Population Taking Taxi / Cab to Work in Golden, CO are:
What zip code has the Highest Percentage of Population Taking Taxi / Cab to Work in Golden, CO?
80401 has the Highest Percentage of Population Taking Taxi / Cab to Work in Golden, CO with 35.3%.
What is the Percentage of Population Taking Taxi / Cab to Work in Golden, CO?
Percentage of Population Taking Taxi / Cab to Work in Golden is 31.0%.
What is the Percentage of Population Taking Taxi / Cab to Work in Colorado?
Percentage of Population Taking Taxi / Cab to Work in Colorado is 37.4%.
What is the Percentage of Population Taking Taxi / Cab to Work in the United States?
Percentage of Population Taking Taxi / Cab to Work in the United States is 38.2%.