Zip Codes with the Highest Percentage of Population with a Degree in Liberal Arts and History in Golden, CO
RELATED REPORTS & OPTIONS
Liberal Arts and History
Golden
Compare Zip Codes
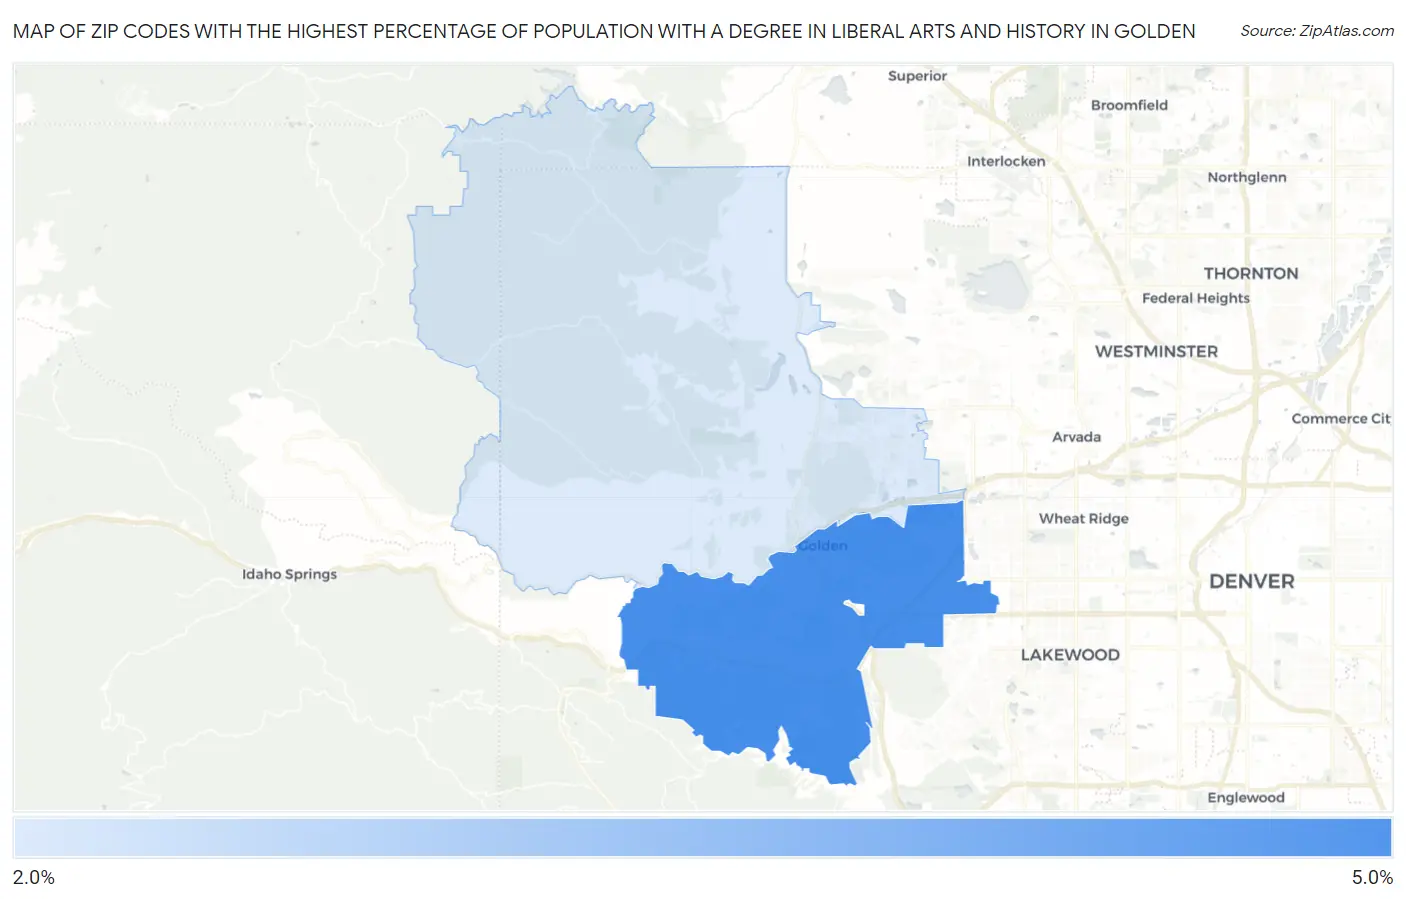
Map of Zip Codes with the Highest Percentage of Population with a Degree in Liberal Arts and History in Golden
2.1%
4.8%
Zip Codes with the Highest Percentage of Population with a Degree in Liberal Arts and History in Golden, CO
| Zip Code | % Graduates | vs State | vs National | |
| 1. | 80401 | 4.8% | 4.6%(+0.145)#167 | 4.9%(-0.096)#12,046 |
| 2. | 80403 | 2.1% | 4.6%(-2.50)#332 | 4.9%(-2.74)#20,999 |
1
Common Questions
What are the Top Zip Codes with the Highest Percentage of Population with a Degree in Liberal Arts and History in Golden, CO?
Top Zip Codes with the Highest Percentage of Population with a Degree in Liberal Arts and History in Golden, CO are:
What zip code has the Highest Percentage of Population with a Degree in Liberal Arts and History in Golden, CO?
80401 has the Highest Percentage of Population with a Degree in Liberal Arts and History in Golden, CO with 4.8%.
What is the Percentage of Population with a Degree in Liberal Arts and History in Golden, CO?
Percentage of Population with a Degree in Liberal Arts and History in Golden is 2.9%.
What is the Percentage of Population with a Degree in Liberal Arts and History in Colorado?
Percentage of Population with a Degree in Liberal Arts and History in Colorado is 4.6%.
What is the Percentage of Population with a Degree in Liberal Arts and History in the United States?
Percentage of Population with a Degree in Liberal Arts and History in the United States is 4.9%.