Zip Codes with the Highest Percentage of Population Taking Taxi / Cab to Work in Lompoc, CA
RELATED REPORTS & OPTIONS
Taxi / Cab
Lompoc
Compare Zip Codes
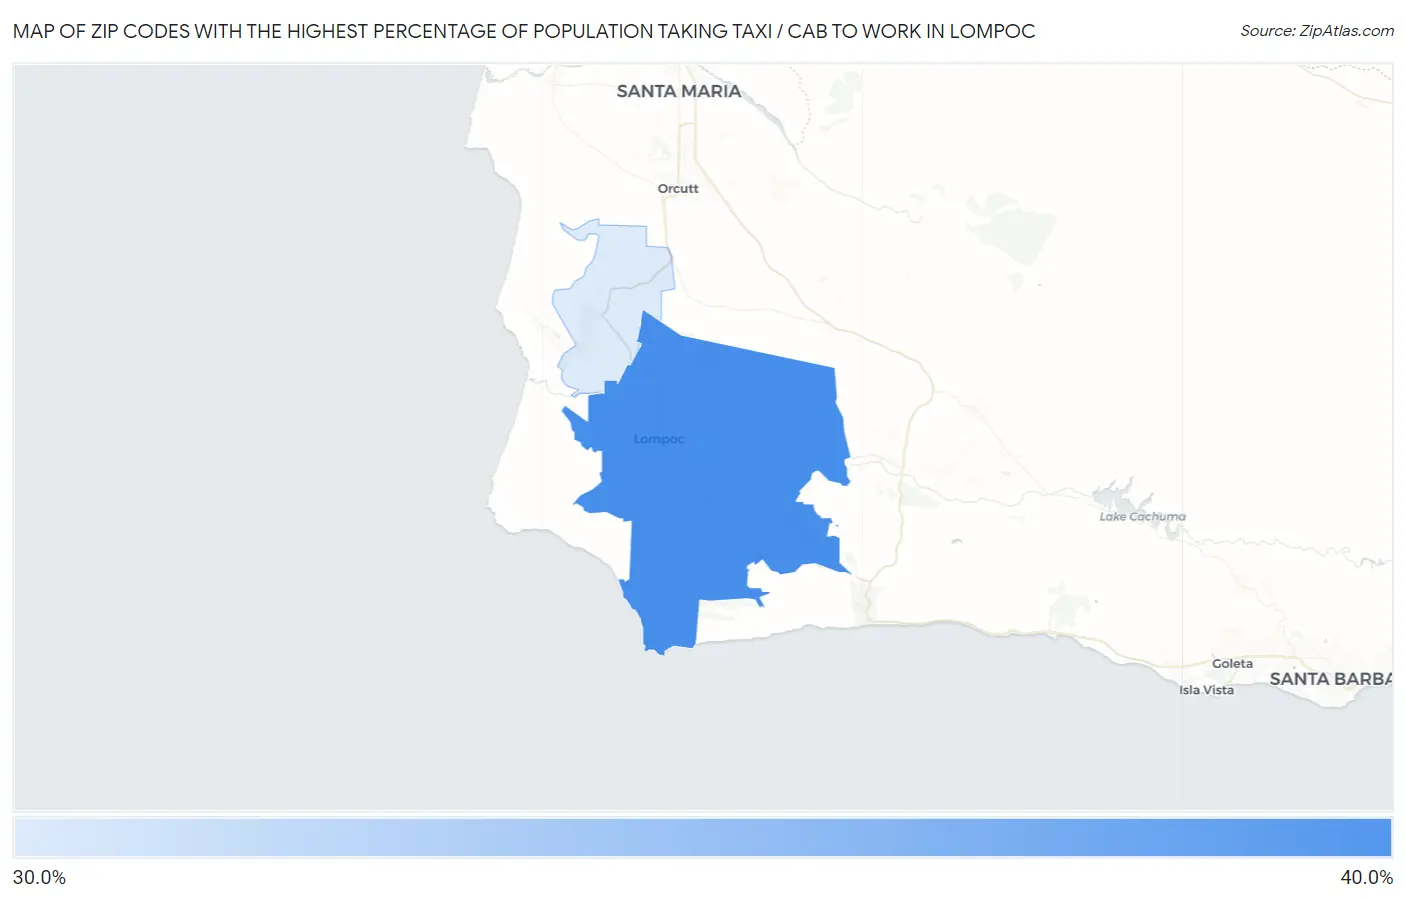
Map of Zip Codes with the Highest Percentage of Population Taking Taxi / Cab to Work in Lompoc
30.2%
36.5%
Zip Codes with the Highest Percentage of Population Taking Taxi / Cab to Work in Lompoc, CA
| Zip Code | % Take Taxi / Cab | vs State | vs National | |
| 1. | 93436 | 36.5% | 37.2%(-0.700)#645 | 38.2%(-1.70)#8,173 |
| 2. | 93437 | 30.2% | 37.2%(-7.00)#955 | 38.2%(-8.00)#10,862 |
1
Common Questions
What are the Top Zip Codes with the Highest Percentage of Population Taking Taxi / Cab to Work in Lompoc, CA?
Top Zip Codes with the Highest Percentage of Population Taking Taxi / Cab to Work in Lompoc, CA are:
What zip code has the Highest Percentage of Population Taking Taxi / Cab to Work in Lompoc, CA?
93436 has the Highest Percentage of Population Taking Taxi / Cab to Work in Lompoc, CA with 36.5%.
What is the Percentage of Population Taking Taxi / Cab to Work in Lompoc, CA?
Percentage of Population Taking Taxi / Cab to Work in Lompoc is 36.9%.
What is the Percentage of Population Taking Taxi / Cab to Work in California?
Percentage of Population Taking Taxi / Cab to Work in California is 37.2%.
What is the Percentage of Population Taking Taxi / Cab to Work in the United States?
Percentage of Population Taking Taxi / Cab to Work in the United States is 38.2%.