Marshall, NC Map & Demographics
Marshall Map
Marshall Overview
$32,132
PER CAPITA INCOME
$83,125
AVG FAMILY INCOME
$49,712
AVG HOUSEHOLD INCOME
33.3%
WAGE / INCOME GAP [ % ]
66.7¢/ $1
WAGE / INCOME GAP [ $ ]
0.44
INEQUALITY / GINI INDEX
616
TOTAL POPULATION
297
MALE POPULATION
319
FEMALE POPULATION
93.10
MALES / 100 FEMALES
107.41
FEMALES / 100 MALES
41.8
MEDIAN AGE
2.5
AVG FAMILY SIZE
1.8
AVG HOUSEHOLD SIZE
319
LABOR FORCE [ PEOPLE ]
59.0%
PERCENT IN LABOR FORCE
1.4%
UNEMPLOYMENT RATE
Marshall Zip Codes
Marshall Area Codes
Income in Marshall
Income Overview in Marshall
Per Capita Income in Marshall is $32,132, while median incomes of families and households are $83,125 and $49,712 respectively.
| Characteristic | Number | Measure |
| Per Capita Income | 616 | $32,132 |
| Median Family Income | 130 | $83,125 |
| Mean Family Income | 130 | $84,757 |
| Median Household Income | 303 | $49,712 |
| Mean Household Income | 303 | $60,222 |
| Income Deficit | 130 | $0 |
| Wage / Income Gap (%) | 616 | 33.30% |
| Wage / Income Gap ($) | 616 | 66.70¢ per $1 |
| Gini / Inequality Index | 616 | 0.44 |
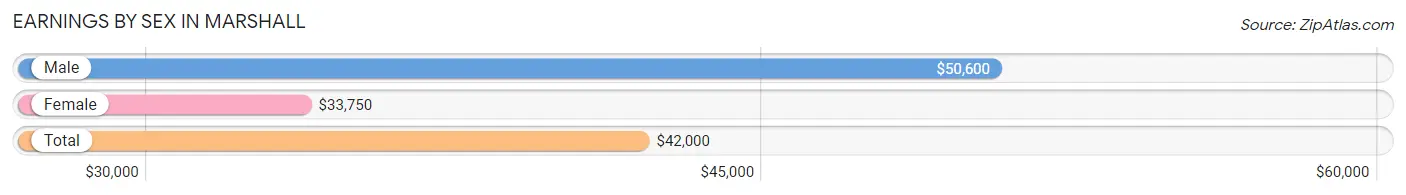
Earnings by Sex in Marshall
Average Earnings in Marshall are $42,000, $50,600 for men and $33,750 for women, a difference of 33.3%.
| Sex | Number | Average Earnings |
| Male | 200 (58.5%) | $50,600 |
| Female | 142 (41.5%) | $33,750 |
| Total | 342 (100.0%) | $42,000 |
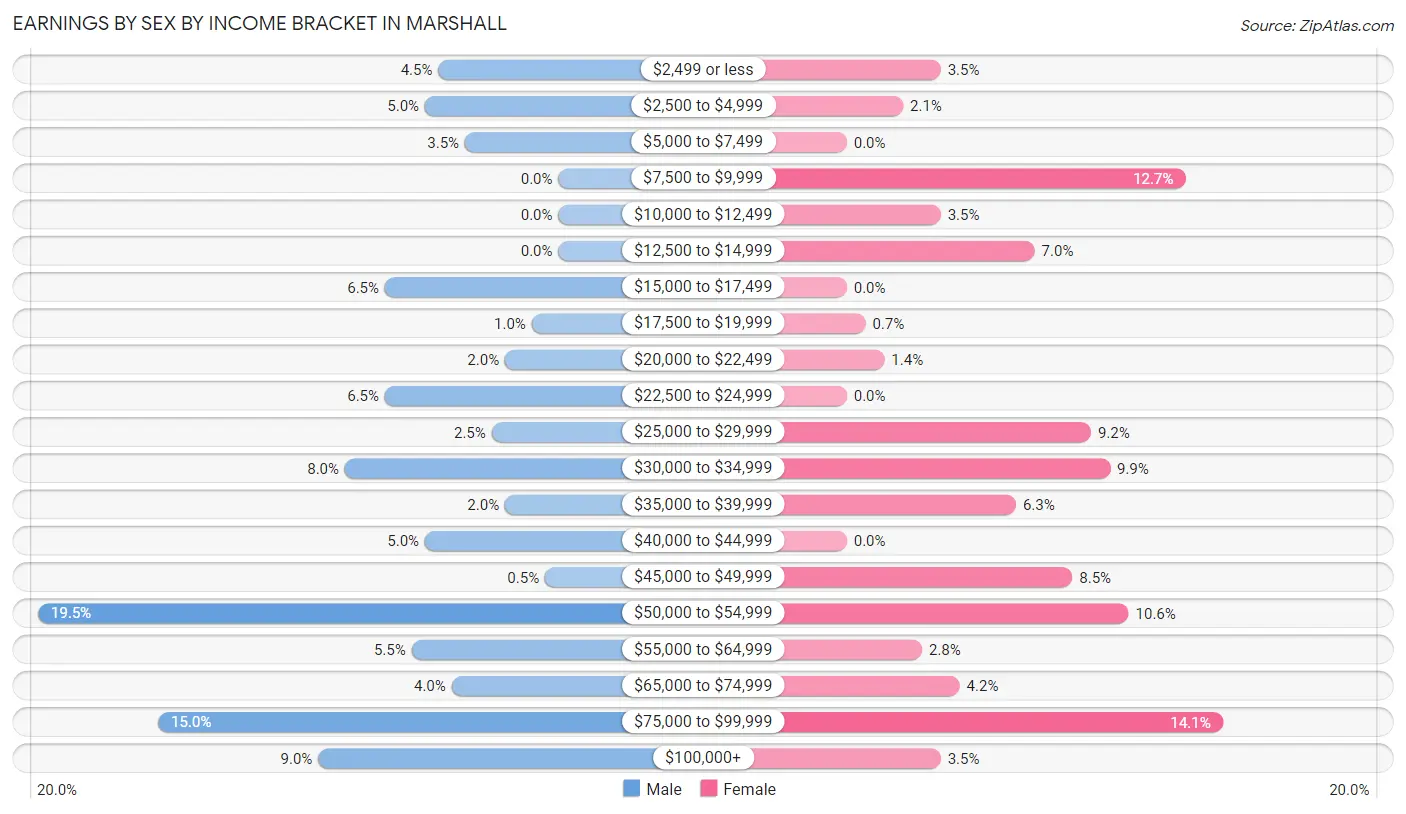
Earnings by Sex by Income Bracket in Marshall
The most common earnings brackets in Marshall are $50,000 to $54,999 for men (39 | 19.5%) and $75,000 to $99,999 for women (20 | 14.1%).
| Income | Male | Female |
| $2,499 or less | 9 (4.5%) | 5 (3.5%) |
| $2,500 to $4,999 | 10 (5.0%) | 3 (2.1%) |
| $5,000 to $7,499 | 7 (3.5%) | 0 (0.0%) |
| $7,500 to $9,999 | 0 (0.0%) | 18 (12.7%) |
| $10,000 to $12,499 | 0 (0.0%) | 5 (3.5%) |
| $12,500 to $14,999 | 0 (0.0%) | 10 (7.0%) |
| $15,000 to $17,499 | 13 (6.5%) | 0 (0.0%) |
| $17,500 to $19,999 | 2 (1.0%) | 1 (0.7%) |
| $20,000 to $22,499 | 4 (2.0%) | 2 (1.4%) |
| $22,500 to $24,999 | 13 (6.5%) | 0 (0.0%) |
| $25,000 to $29,999 | 5 (2.5%) | 13 (9.1%) |
| $30,000 to $34,999 | 16 (8.0%) | 14 (9.9%) |
| $35,000 to $39,999 | 4 (2.0%) | 9 (6.3%) |
| $40,000 to $44,999 | 10 (5.0%) | 0 (0.0%) |
| $45,000 to $49,999 | 1 (0.5%) | 12 (8.5%) |
| $50,000 to $54,999 | 39 (19.5%) | 15 (10.6%) |
| $55,000 to $64,999 | 11 (5.5%) | 4 (2.8%) |
| $65,000 to $74,999 | 8 (4.0%) | 6 (4.2%) |
| $75,000 to $99,999 | 30 (15.0%) | 20 (14.1%) |
| $100,000+ | 18 (9.0%) | 5 (3.5%) |
| Total | 200 (100.0%) | 142 (100.0%) |
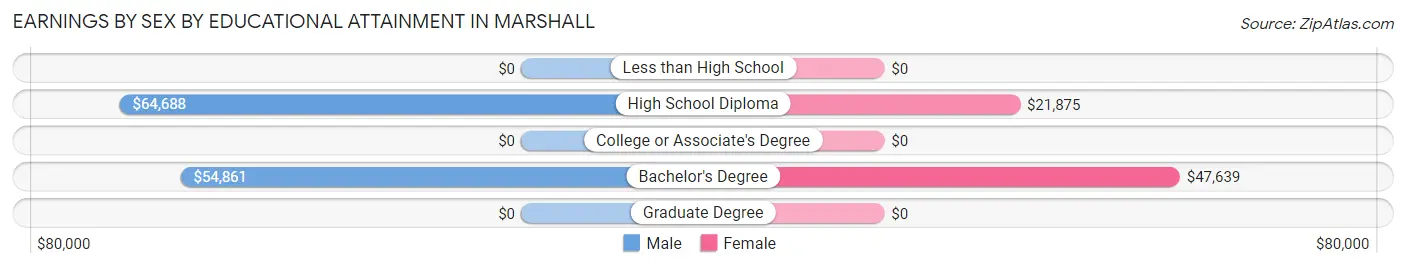
Earnings by Sex by Educational Attainment in Marshall
Average earnings in Marshall are $50,800 for men and $33,750 for women, a difference of 33.6%. Men with an educational attainment of high school diploma enjoy the highest average annual earnings of $64,688, while those with bachelor's degree education earn the least with $54,861. Women with an educational attainment of bachelor's degree earn the most with the average annual earnings of $47,639, while those with high school diploma education have the smallest earnings of $21,875.
| Educational Attainment | Male Income | Female Income |
| Less than High School | - | - |
| High School Diploma | $64,688 | $21,875 |
| College or Associate's Degree | - | - |
| Bachelor's Degree | $54,861 | $47,639 |
| Graduate Degree | - | - |
| Total | $50,800 | $33,750 |
Family Income in Marshall
Family Income Brackets in Marshall
According to the Marshall family income data, there are 46 families falling into the $100,000 to $149,999 income range, which is the most common income bracket and makes up 35.4% of all families.
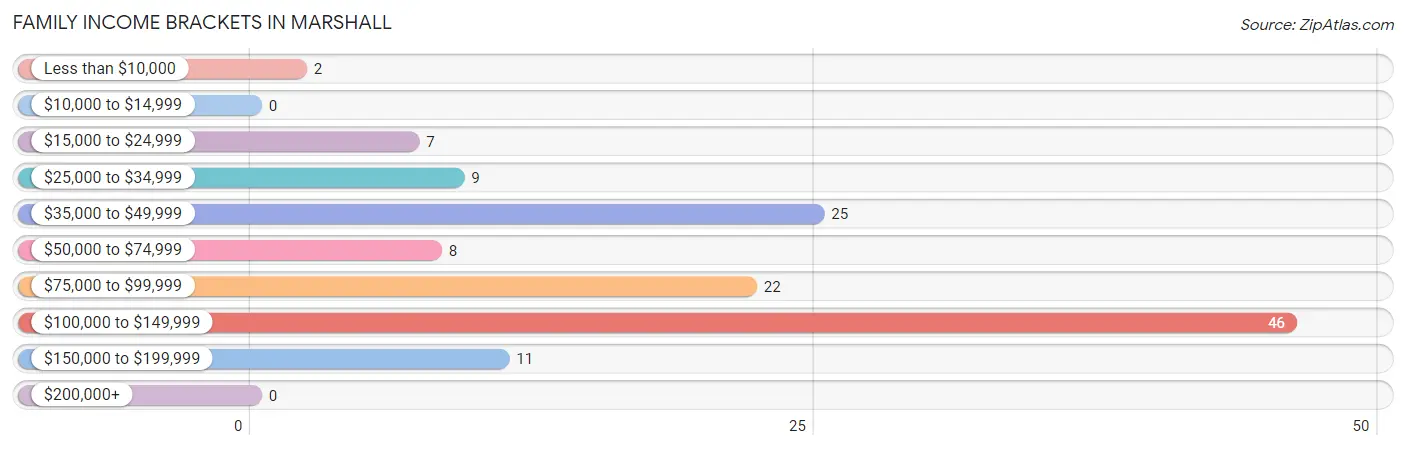
| Income Bracket | # Families | % Families |
| Less than $10,000 | 2 | 1.5% |
| $10,000 to $14,999 | 0 | 0.0% |
| $15,000 to $24,999 | 7 | 5.4% |
| $25,000 to $34,999 | 9 | 6.9% |
| $35,000 to $49,999 | 25 | 19.2% |
| $50,000 to $74,999 | 8 | 6.2% |
| $75,000 to $99,999 | 22 | 16.9% |
| $100,000 to $149,999 | 46 | 35.4% |
| $150,000 to $199,999 | 11 | 8.5% |
| $200,000+ | 0 | 0.0% |
Family Income by Famaliy Size in Marshall
4-person families (18 | 13.9%) account for the highest median family income in Marshall with $123,500 per family, while 4-person families (18 | 13.9%) have the highest median income of $30,875 per family member.
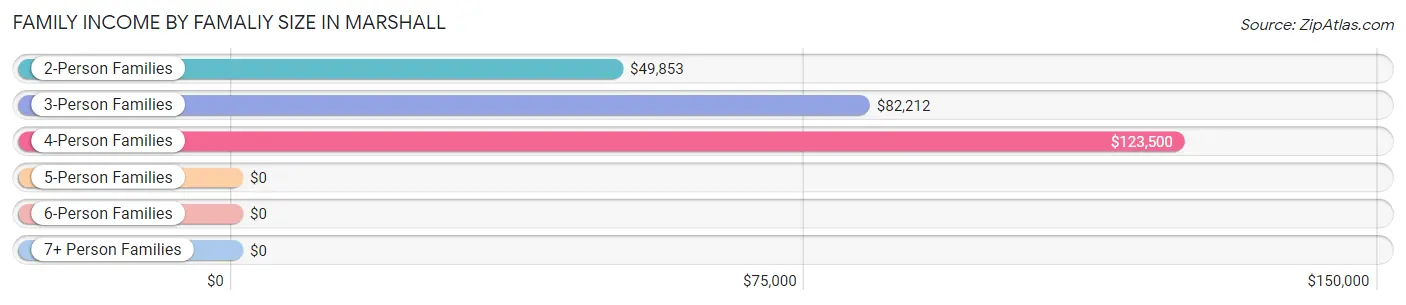
| Income Bracket | # Families | Median Income |
| 2-Person Families | 78 (60.0%) | $49,853 |
| 3-Person Families | 33 (25.4%) | $82,212 |
| 4-Person Families | 18 (13.9%) | $123,500 |
| 5-Person Families | 1 (0.8%) | $0 |
| 6-Person Families | 0 (0.0%) | $0 |
| 7+ Person Families | 0 (0.0%) | $0 |
| Total | 130 (100.0%) | $83,125 |
Family Income by Number of Earners in Marshall
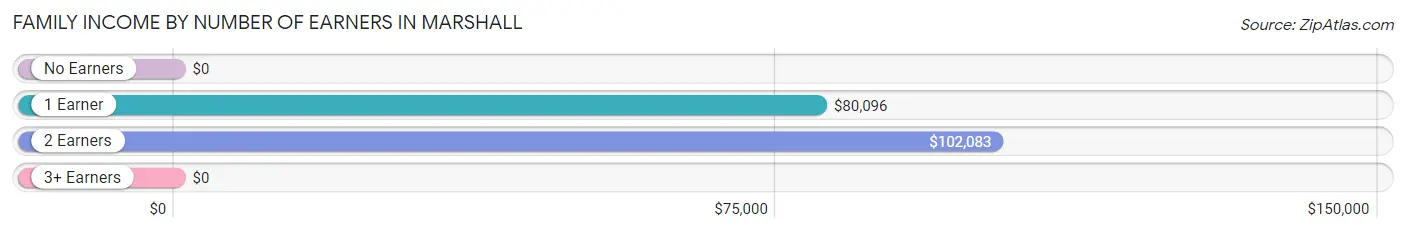
| Number of Earners | # Families | Median Income |
| No Earners | 16 (12.3%) | $0 |
| 1 Earner | 39 (30.0%) | $80,096 |
| 2 Earners | 70 (53.8%) | $102,083 |
| 3+ Earners | 5 (3.8%) | $0 |
| Total | 130 (100.0%) | $83,125 |
Household Income in Marshall
Household Income Brackets in Marshall
With 56 households falling in the category, the $100,000 to $149,999 income range is the most frequent in Marshall, accounting for 18.5% of all households. In contrast, only 3 households (1.0%) fall into the $200,000+ income bracket, making it the least populous group.
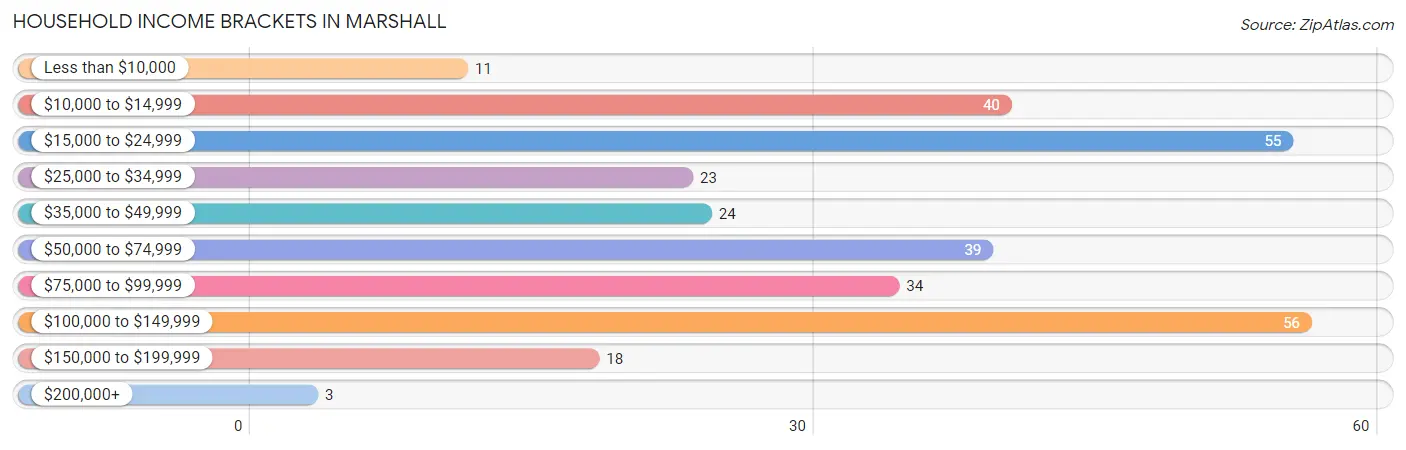
| Income Bracket | # Households | % Households |
| Less than $10,000 | 11 | 3.6% |
| $10,000 to $14,999 | 40 | 13.2% |
| $15,000 to $24,999 | 55 | 18.2% |
| $25,000 to $34,999 | 23 | 7.6% |
| $35,000 to $49,999 | 24 | 7.9% |
| $50,000 to $74,999 | 39 | 12.9% |
| $75,000 to $99,999 | 34 | 11.2% |
| $100,000 to $149,999 | 56 | 18.5% |
| $150,000 to $199,999 | 18 | 5.9% |
| $200,000+ | 3 | 1.0% |
Household Income by Householder Age in Marshall
The median household income in Marshall is $49,712, with the highest median household income of $82,212 found in the 25 to 44 years age bracket for the primary householder. A total of 103 households (34.0%) fall into this category.
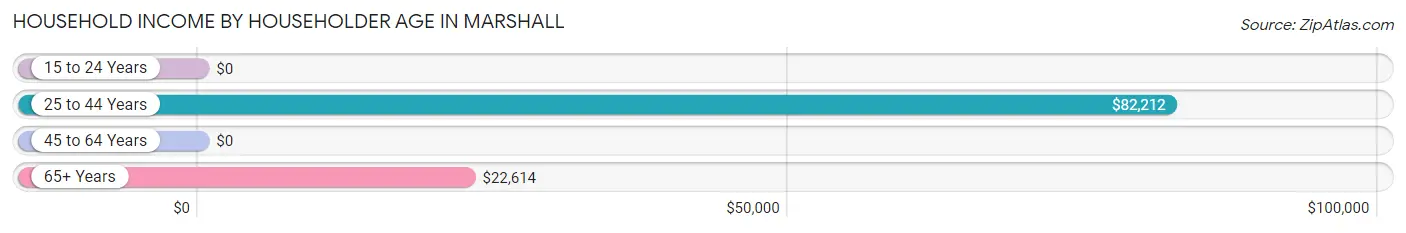
| Income Bracket | # Households | Median Income |
| 15 to 24 Years | 0 (0.0%) | $0 |
| 25 to 44 Years | 103 (34.0%) | $82,212 |
| 45 to 64 Years | 115 (38.0%) | $0 |
| 65+ Years | 85 (28.1%) | $22,614 |
| Total | 303 (100.0%) | $49,712 |
Poverty in Marshall
Income Below Poverty by Sex and Age in Marshall
With 13.7% poverty level for males and 30.4% for females among the residents of Marshall, under 5 year old males and 6 to 11 year old females are the most vulnerable to poverty, with 1 males (100.0%) and 8 females (100.0%) in their respective age groups living below the poverty level.
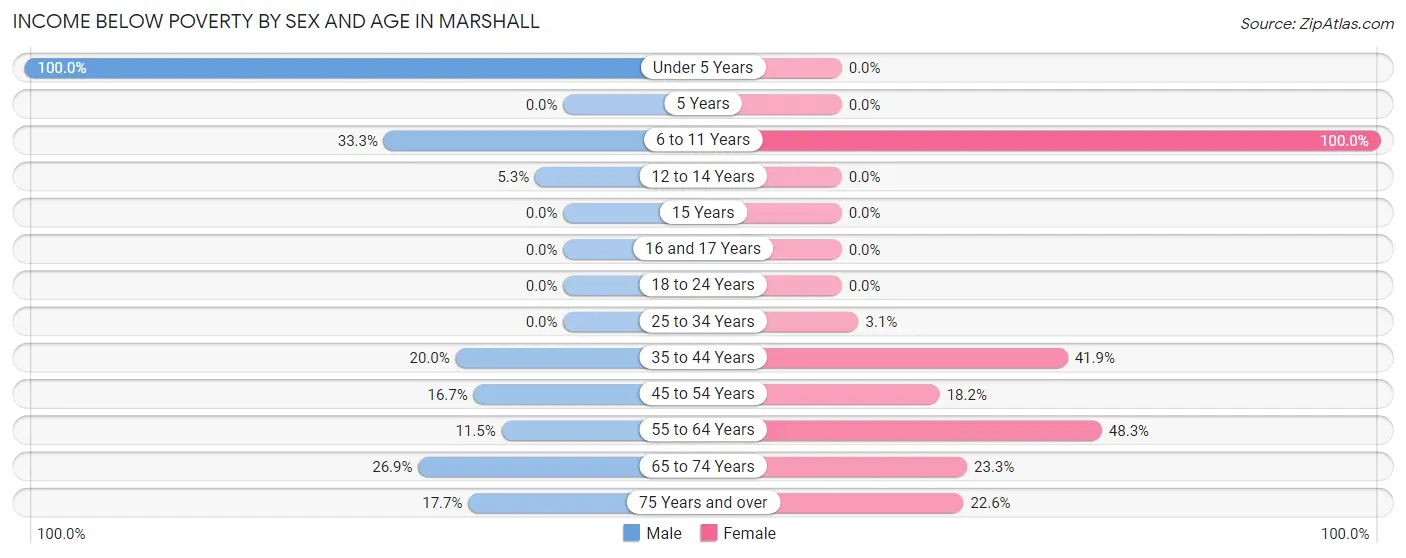
| Age Bracket | Male | Female |
| Under 5 Years | 1 (100.0%) | 0 (0.0%) |
| 5 Years | 0 (0.0%) | 0 (0.0%) |
| 6 to 11 Years | 5 (33.3%) | 8 (100.0%) |
| 12 to 14 Years | 1 (5.3%) | 0 (0.0%) |
| 15 Years | 0 (0.0%) | 0 (0.0%) |
| 16 and 17 Years | 0 (0.0%) | 0 (0.0%) |
| 18 to 24 Years | 0 (0.0%) | 0 (0.0%) |
| 25 to 34 Years | 0 (0.0%) | 1 (3.1%) |
| 35 to 44 Years | 10 (20.0%) | 39 (41.9%) |
| 45 to 54 Years | 4 (16.7%) | 4 (18.2%) |
| 55 to 64 Years | 7 (11.5%) | 28 (48.3%) |
| 65 to 74 Years | 7 (26.9%) | 10 (23.3%) |
| 75 Years and over | 3 (17.6%) | 7 (22.6%) |
| Total | 38 (13.7%) | 97 (30.4%) |
Income Above Poverty by Sex and Age in Marshall
According to the poverty statistics in Marshall, males aged 16 and 17 years and females aged under 5 years are the age groups that are most secure financially, with 100.0% of males and 100.0% of females in these age groups living above the poverty line.
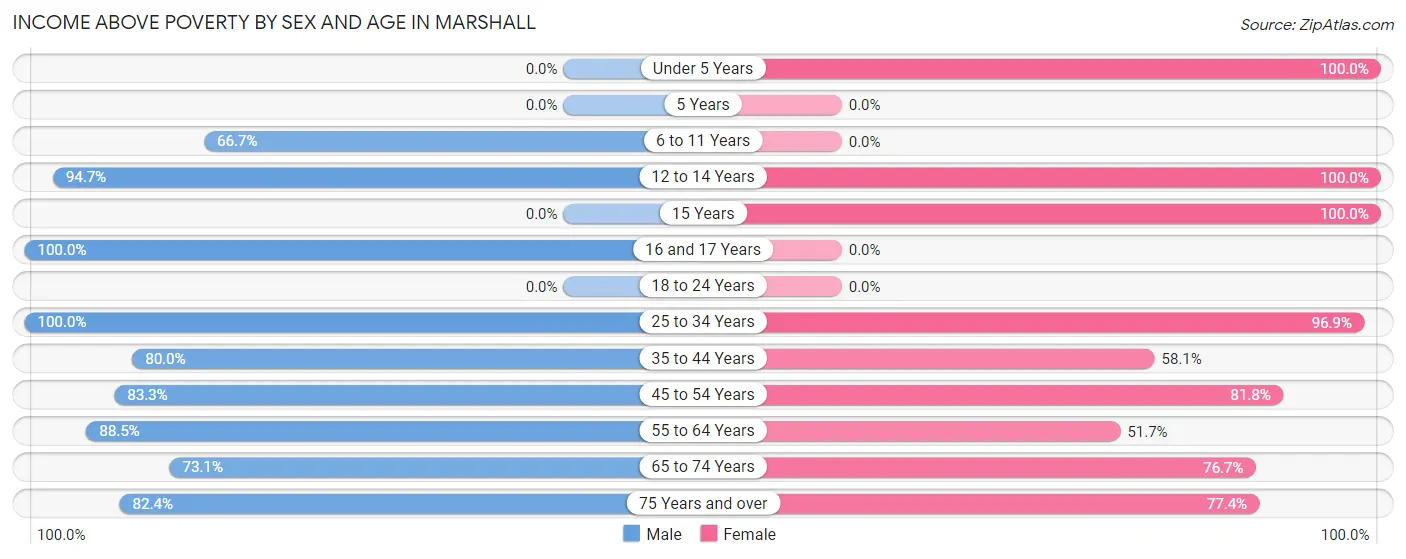
| Age Bracket | Male | Female |
| Under 5 Years | 0 (0.0%) | 8 (100.0%) |
| 5 Years | 0 (0.0%) | 0 (0.0%) |
| 6 to 11 Years | 10 (66.7%) | 0 (0.0%) |
| 12 to 14 Years | 18 (94.7%) | 23 (100.0%) |
| 15 Years | 0 (0.0%) | 1 (100.0%) |
| 16 and 17 Years | 5 (100.0%) | 0 (0.0%) |
| 18 to 24 Years | 0 (0.0%) | 0 (0.0%) |
| 25 to 34 Years | 59 (100.0%) | 31 (96.9%) |
| 35 to 44 Years | 40 (80.0%) | 54 (58.1%) |
| 45 to 54 Years | 20 (83.3%) | 18 (81.8%) |
| 55 to 64 Years | 54 (88.5%) | 30 (51.7%) |
| 65 to 74 Years | 19 (73.1%) | 33 (76.7%) |
| 75 Years and over | 14 (82.4%) | 24 (77.4%) |
| Total | 239 (86.3%) | 222 (69.6%) |
Income Below Poverty Among Married-Couple Families in Marshall
The poverty statistics for married-couple families in Marshall show that 5.5% or 5 of the total 91 families live below the poverty line. Families with 1 or 2 children have the highest poverty rate of 6.7%, comprising of 2 families. On the other hand, families with no children have the lowest poverty rate of 4.9%, which includes 3 families.
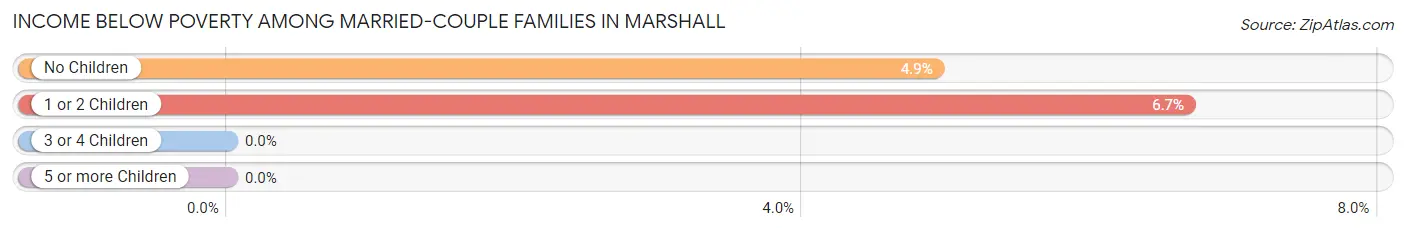
| Children | Above Poverty | Below Poverty |
| No Children | 58 (95.1%) | 3 (4.9%) |
| 1 or 2 Children | 28 (93.3%) | 2 (6.7%) |
| 3 or 4 Children | 0 (0.0%) | 0 (0.0%) |
| 5 or more Children | 0 (0.0%) | 0 (0.0%) |
| Total | 86 (94.5%) | 5 (5.5%) |
Income Below Poverty Among Single-Parent Households in Marshall
According to the poverty data in Marshall, 26.7% or 4 single-father households and 4.2% or 1 single-mother households are living below the poverty line. Among single-father households, those with 1 or 2 children have the highest poverty rate, with 4 households (26.7%) experiencing poverty. Likewise, among single-mother households, those with 3 or 4 children have the highest poverty rate, with 1 households (100.0%) falling below the poverty line.
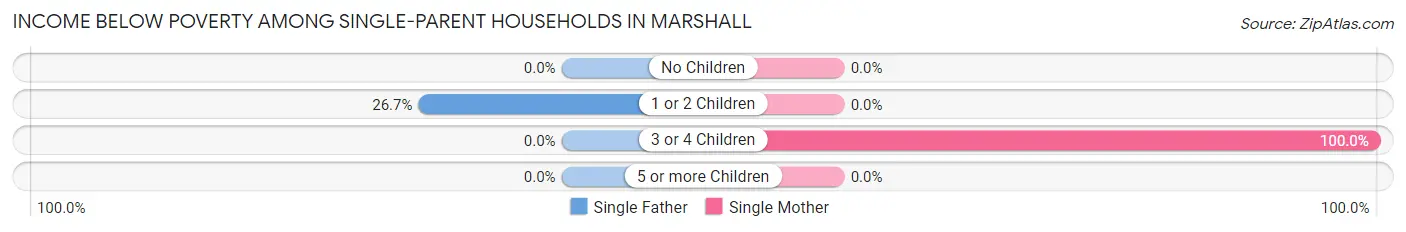
| Children | Single Father | Single Mother |
| No Children | 0 (0.0%) | 0 (0.0%) |
| 1 or 2 Children | 4 (26.7%) | 0 (0.0%) |
| 3 or 4 Children | 0 (0.0%) | 1 (100.0%) |
| 5 or more Children | 0 (0.0%) | 0 (0.0%) |
| Total | 4 (26.7%) | 1 (4.2%) |
Income Below Poverty Among Married-Couple vs Single-Parent Households in Marshall
The poverty data for Marshall shows that 5 of the married-couple family households (5.5%) and 5 of the single-parent households (12.8%) are living below the poverty level. Within the married-couple family households, those with 1 or 2 children have the highest poverty rate, with 2 households (6.7%) falling below the poverty line. Among the single-parent households, those with 3 or 4 children have the highest poverty rate, with 1 household (100.0%) living below poverty.
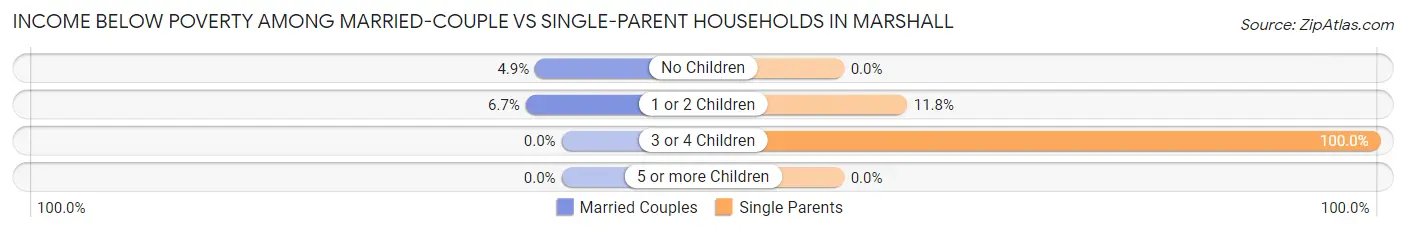
| Children | Married-Couple Families | Single-Parent Households |
| No Children | 3 (4.9%) | 0 (0.0%) |
| 1 or 2 Children | 2 (6.7%) | 4 (11.8%) |
| 3 or 4 Children | 0 (0.0%) | 1 (100.0%) |
| 5 or more Children | 0 (0.0%) | 0 (0.0%) |
| Total | 5 (5.5%) | 5 (12.8%) |
Race in Marshall
The most populous races in Marshall are White / Caucasian (554 | 89.9%), Two or more Races (32 | 5.2%), and Hispanic or Latino (24 | 3.9%).
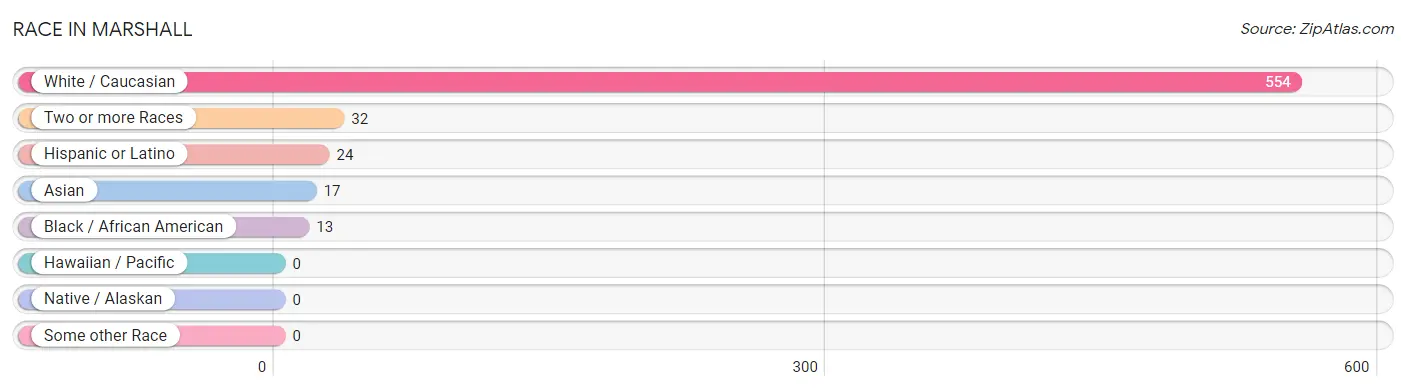
| Race | # Population | % Population |
| Asian | 17 | 2.8% |
| Black / African American | 13 | 2.1% |
| Hawaiian / Pacific | 0 | 0.0% |
| Hispanic or Latino | 24 | 3.9% |
| Native / Alaskan | 0 | 0.0% |
| White / Caucasian | 554 | 89.9% |
| Two or more Races | 32 | 5.2% |
| Some other Race | 0 | 0.0% |
| Total | 616 | 100.0% |
Ancestry in Marshall
The most populous ancestries reported in Marshall are English (91 | 14.8%), German (62 | 10.1%), American (56 | 9.1%), Irish (41 | 6.7%), and European (35 | 5.7%), together accounting for 46.3% of all Marshall residents.
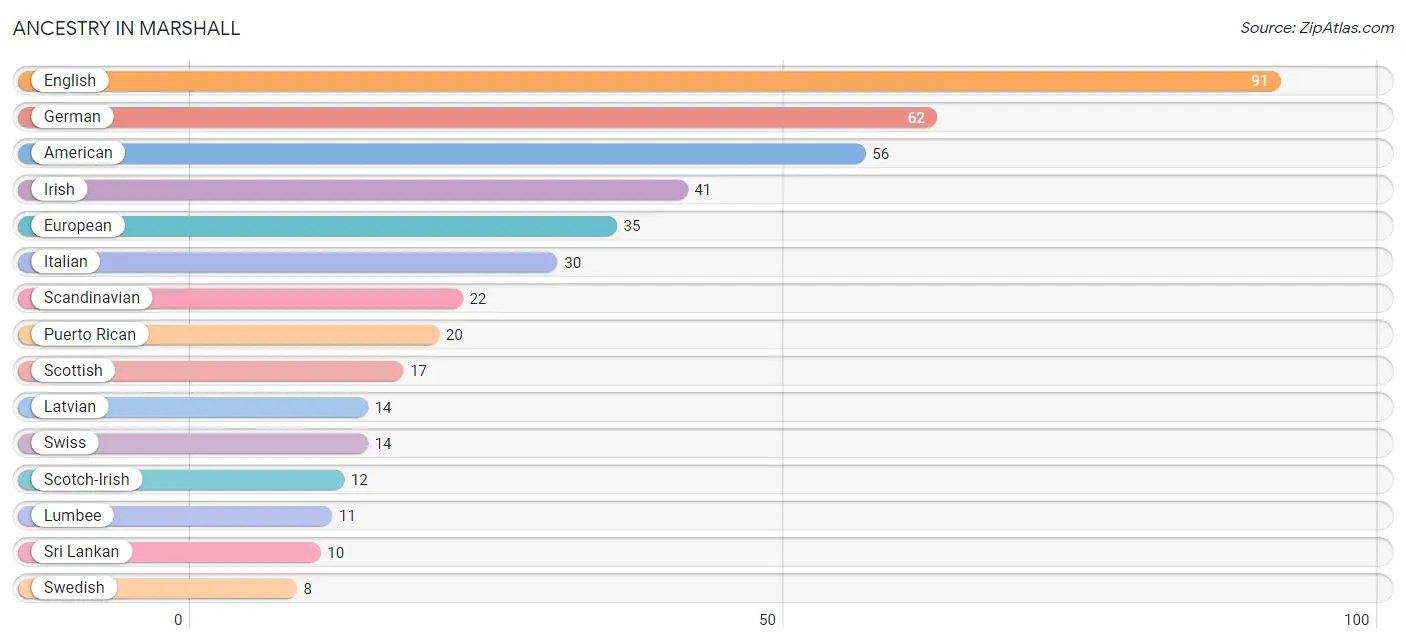
| Ancestry | # Population | % Population |
| American | 56 | 9.1% |
| British | 3 | 0.5% |
| Burmese | 6 | 1.0% |
| Cuban | 4 | 0.6% |
| Czech | 2 | 0.3% |
| Dutch | 2 | 0.3% |
| English | 91 | 14.8% |
| European | 35 | 5.7% |
| German | 62 | 10.1% |
| Hungarian | 7 | 1.1% |
| Indian (Asian) | 5 | 0.8% |
| Irish | 41 | 6.7% |
| Italian | 30 | 4.9% |
| Korean | 4 | 0.6% |
| Latvian | 14 | 2.3% |
| Lumbee | 11 | 1.8% |
| Norwegian | 1 | 0.2% |
| Polish | 5 | 0.8% |
| Puerto Rican | 20 | 3.3% |
| Scandinavian | 22 | 3.6% |
| Scotch-Irish | 12 | 1.9% |
| Scottish | 17 | 2.8% |
| Slovak | 4 | 0.6% |
| Sri Lankan | 10 | 1.6% |
| Swedish | 8 | 1.3% |
| Swiss | 14 | 2.3% |
| Welsh | 1 | 0.2% | View All 27 Rows |
Immigrants in Marshall
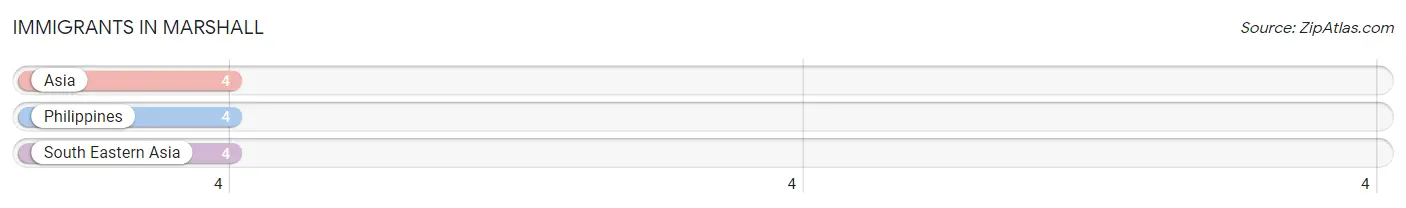
The most numerous immigrant groups reported in Marshall came from Asia (4 | 0.6%), Philippines (4 | 0.6%), and South Eastern Asia (4 | 0.6%), together accounting for 1.9% of all Marshall residents.
| Immigration Origin | # Population | % Population |
| Asia | 4 | 0.6% |
| Philippines | 4 | 0.6% |
| South Eastern Asia | 4 | 0.6% | View All 3 Rows |
Sex and Age in Marshall
Sex and Age in Marshall
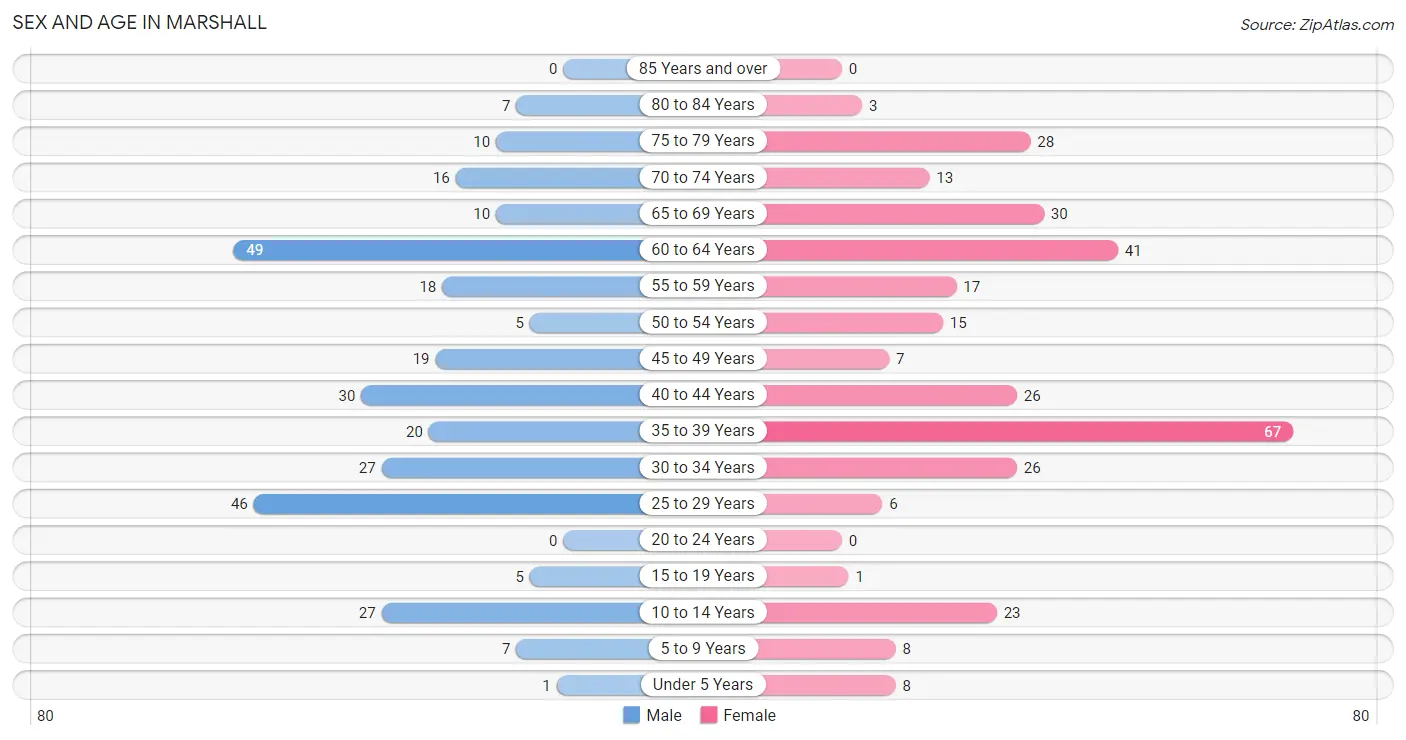
The most populous age groups in Marshall are 60 to 64 Years (49 | 16.5%) for men and 35 to 39 Years (67 | 21.0%) for women.
| Age Bracket | Male | Female |
| Under 5 Years | 1 (0.3%) | 8 (2.5%) |
| 5 to 9 Years | 7 (2.4%) | 8 (2.5%) |
| 10 to 14 Years | 27 (9.1%) | 23 (7.2%) |
| 15 to 19 Years | 5 (1.7%) | 1 (0.3%) |
| 20 to 24 Years | 0 (0.0%) | 0 (0.0%) |
| 25 to 29 Years | 46 (15.5%) | 6 (1.9%) |
| 30 to 34 Years | 27 (9.1%) | 26 (8.2%) |
| 35 to 39 Years | 20 (6.7%) | 67 (21.0%) |
| 40 to 44 Years | 30 (10.1%) | 26 (8.2%) |
| 45 to 49 Years | 19 (6.4%) | 7 (2.2%) |
| 50 to 54 Years | 5 (1.7%) | 15 (4.7%) |
| 55 to 59 Years | 18 (6.1%) | 17 (5.3%) |
| 60 to 64 Years | 49 (16.5%) | 41 (12.9%) |
| 65 to 69 Years | 10 (3.4%) | 30 (9.4%) |
| 70 to 74 Years | 16 (5.4%) | 13 (4.1%) |
| 75 to 79 Years | 10 (3.4%) | 28 (8.8%) |
| 80 to 84 Years | 7 (2.4%) | 3 (0.9%) |
| 85 Years and over | 0 (0.0%) | 0 (0.0%) |
| Total | 297 (100.0%) | 319 (100.0%) |
Families and Households in Marshall
Median Family Size in Marshall
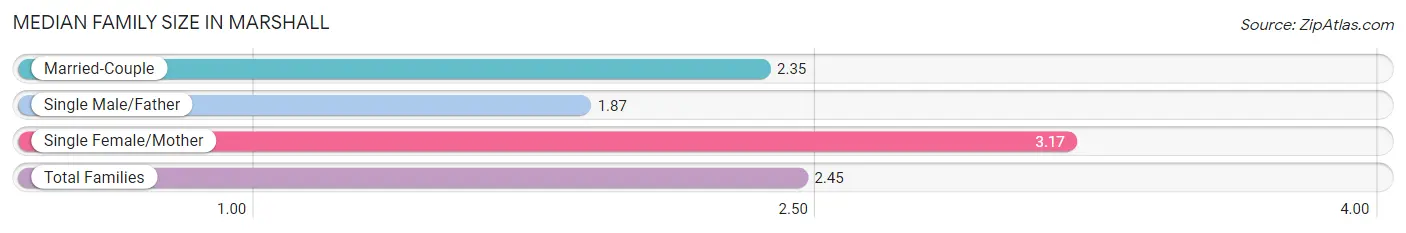
The median family size in Marshall is 2.45 persons per family, with single female/mother families (24 | 18.5%) accounting for the largest median family size of 3.17 persons per family. On the other hand, single male/father families (15 | 11.5%) represent the smallest median family size with 1.87 persons per family.
| Family Type | # Families | Family Size |
| Married-Couple | 91 (70.0%) | 2.35 |
| Single Male/Father | 15 (11.5%) | 1.87 |
| Single Female/Mother | 24 (18.5%) | 3.17 |
| Total Families | 130 (100.0%) | 2.45 |
Median Household Size in Marshall
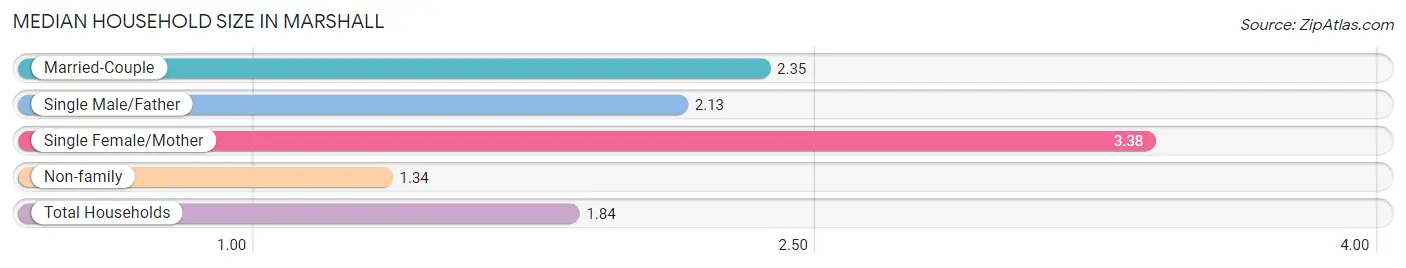
The median household size in Marshall is 1.84 persons per household, with single female/mother households (24 | 7.9%) accounting for the largest median household size of 3.38 persons per household. non-family households (173 | 57.1%) represent the smallest median household size with 1.34 persons per household.
| Household Type | # Households | Household Size |
| Married-Couple | 91 (30.0%) | 2.35 |
| Single Male/Father | 15 (5.0%) | 2.13 |
| Single Female/Mother | 24 (7.9%) | 3.38 |
| Non-family | 173 (57.1%) | 1.34 |
| Total Households | 303 (100.0%) | 1.84 |
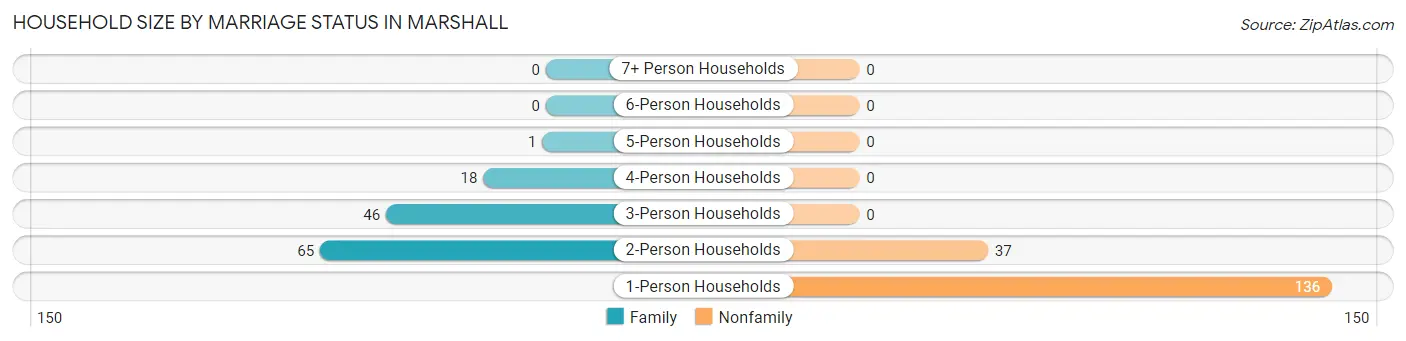
Household Size by Marriage Status in Marshall
Out of a total of 303 households in Marshall, 130 (42.9%) are family households, while 173 (57.1%) are nonfamily households. The most numerous type of family households are 2-person households, comprising 65, and the most common type of nonfamily households are 1-person households, comprising 136.
| Household Size | Family Households | Nonfamily Households |
| 1-Person Households | - | 136 (44.9%) |
| 2-Person Households | 65 (21.4%) | 37 (12.2%) |
| 3-Person Households | 46 (15.2%) | 0 (0.0%) |
| 4-Person Households | 18 (5.9%) | 0 (0.0%) |
| 5-Person Households | 1 (0.3%) | 0 (0.0%) |
| 6-Person Households | 0 (0.0%) | 0 (0.0%) |
| 7+ Person Households | 0 (0.0%) | 0 (0.0%) |
| Total | 130 (42.9%) | 173 (57.1%) |
Female Fertility in Marshall
Fertility by Age in Marshall
| Age Bracket | Women with Births | Births / 1,000 Women |
| 15 to 19 years | 0 (0.0%) | 0.0 |
| 20 to 34 years | 0 (0.0%) | 0.0 |
| 35 to 50 years | 0 (0.0%) | 0.0 |
| Total | 0 (0.0%) | 0.0 |
Fertility by Age by Marriage Status in Marshall
| Age Bracket | Married | Unmarried |
| 15 to 19 years | 0 (0.0%) | 0 (0.0%) |
| 20 to 34 years | 0 (0.0%) | 0 (0.0%) |
| 35 to 50 years | 0 (0.0%) | 0 (0.0%) |
| Total | 0 (0.0%) | 0 (0.0%) |
Fertility by Education in Marshall
| Educational Attainment | Women with Births | Births / 1,000 Women |
| Less than High School | 0 (0.0%) | 0.0 |
| High School Diploma | 0 (0.0%) | 0.0 |
| College or Associate's Degree | 0 (0.0%) | 0.0 |
| Bachelor's Degree | 0 (0.0%) | 0.0 |
| Graduate Degree | 0 (0.0%) | 0.0 |
| Total | 0 (0.0%) | 0.0 |
Fertility by Education by Marriage Status in Marshall
| Educational Attainment | Married | Unmarried |
| Less than High School | 0 (0.0%) | 0 (0.0%) |
| High School Diploma | 0 (0.0%) | 0 (0.0%) |
| College or Associate's Degree | 0 (0.0%) | 0 (0.0%) |
| Bachelor's Degree | 0 (0.0%) | 0 (0.0%) |
| Graduate Degree | 0 (0.0%) | 0 (0.0%) |
| Total | 0 (0.0%) | 0 (0.0%) |
Employment Characteristics in Marshall
Employment by Class of Employer in Marshall
Among the 315 employed individuals in Marshall, private company employees (168 | 53.3%), federal government employees (46 | 14.6%), and self-employed (not incorporated) (34 | 10.8%) make up the most common classes of employment.
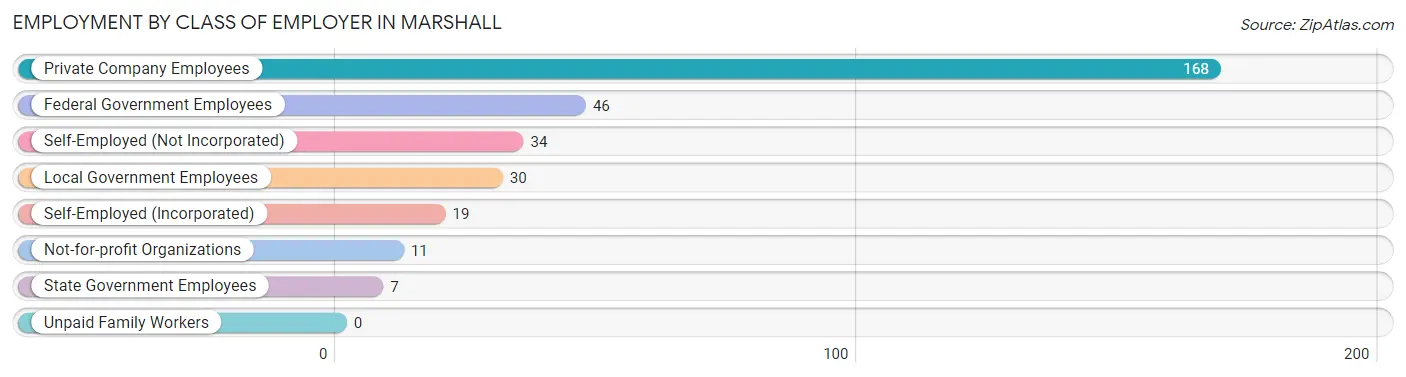
| Employer Class | # Employees | % Employees |
| Private Company Employees | 168 | 53.3% |
| Self-Employed (Incorporated) | 19 | 6.0% |
| Self-Employed (Not Incorporated) | 34 | 10.8% |
| Not-for-profit Organizations | 11 | 3.5% |
| Local Government Employees | 30 | 9.5% |
| State Government Employees | 7 | 2.2% |
| Federal Government Employees | 46 | 14.6% |
| Unpaid Family Workers | 0 | 0.0% |
| Total | 315 | 100.0% |
Employment Status by Age in Marshall
According to the labor force statistics for Marshall, out of the total population over 16 years of age (541), 59.0% or 319 individuals are in the labor force, with 1.4% or 4 of them unemployed. The age group with the highest labor force participation rate is 25 to 29 years, with 100.0% or 52 individuals in the labor force. Within the labor force, the 45 to 54 years age range has the highest percentage of unemployed individuals, with 9.5% or 4 of them being unemployed.
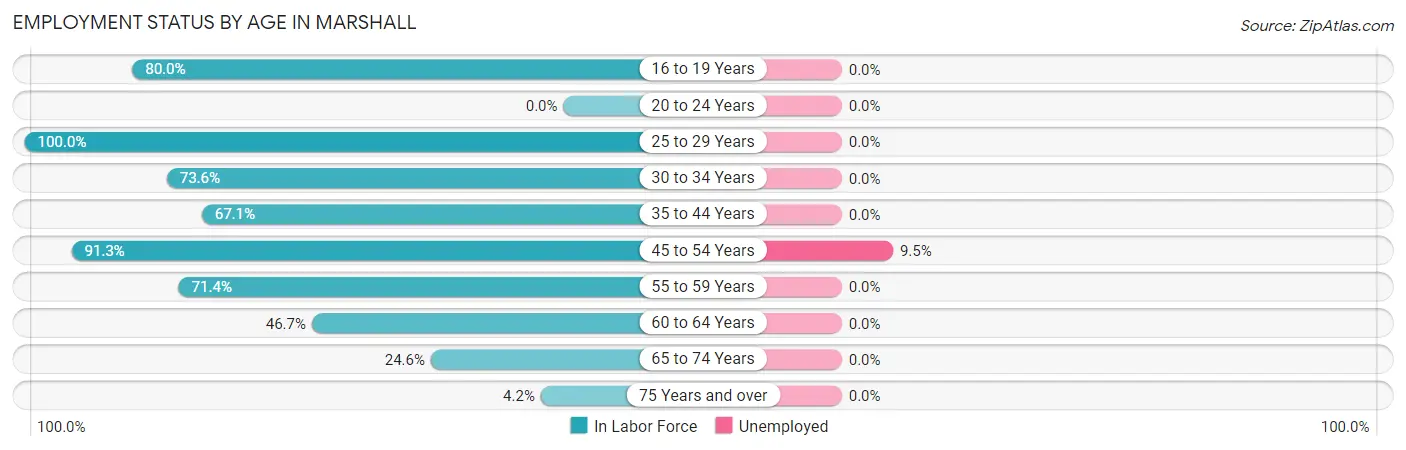
| Age Bracket | In Labor Force | Unemployed |
| 16 to 19 Years | 4 (80.0%) | 0 (0.0%) |
| 20 to 24 Years | 0 (0.0%) | 0 (0.0%) |
| 25 to 29 Years | 52 (100.0%) | 0 (0.0%) |
| 30 to 34 Years | 39 (73.6%) | 0 (0.0%) |
| 35 to 44 Years | 96 (67.1%) | 0 (0.0%) |
| 45 to 54 Years | 42 (91.3%) | 4 (9.5%) |
| 55 to 59 Years | 25 (71.4%) | 0 (0.0%) |
| 60 to 64 Years | 42 (46.7%) | 0 (0.0%) |
| 65 to 74 Years | 17 (24.6%) | 0 (0.0%) |
| 75 Years and over | 2 (4.2%) | 0 (0.0%) |
| Total | 319 (59.0%) | 4 (1.4%) |
Employment Status by Educational Attainment in Marshall
According to labor force statistics for Marshall, 70.6% of individuals (296) out of the total population between 25 and 64 years of age (419) are in the labor force, with 1.5% or 4 of them being unemployed. The group with the highest labor force participation rate are those with the educational attainment of bachelor's degree or higher, with 89.1% or 131 individuals in the labor force. Within the labor force, individuals with bachelor's degree or higher education have the highest percentage of unemployment, with 3.9% or 5 of them being unemployed.
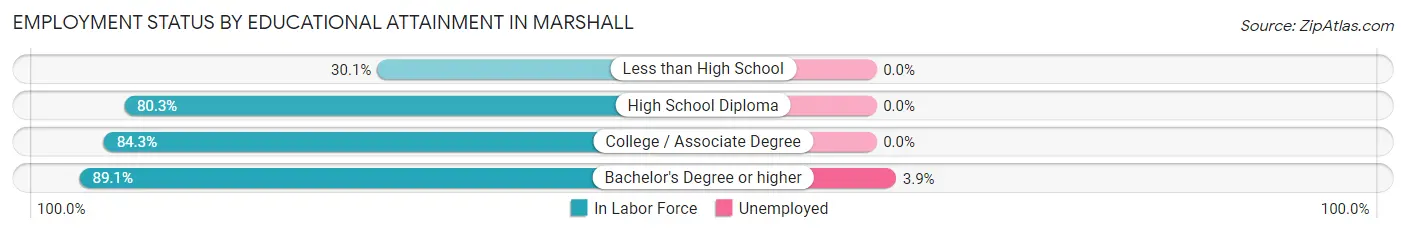
| Educational Attainment | In Labor Force | Unemployed |
| Less than High School | 34 (30.1%) | 0 (0.0%) |
| High School Diploma | 61 (80.3%) | 0 (0.0%) |
| College / Associate Degree | 70 (84.3%) | 0 (0.0%) |
| Bachelor's Degree or higher | 131 (89.1%) | 6 (3.9%) |
| Total | 296 (70.6%) | 6 (1.5%) |
Employment Occupations by Sex in Marshall
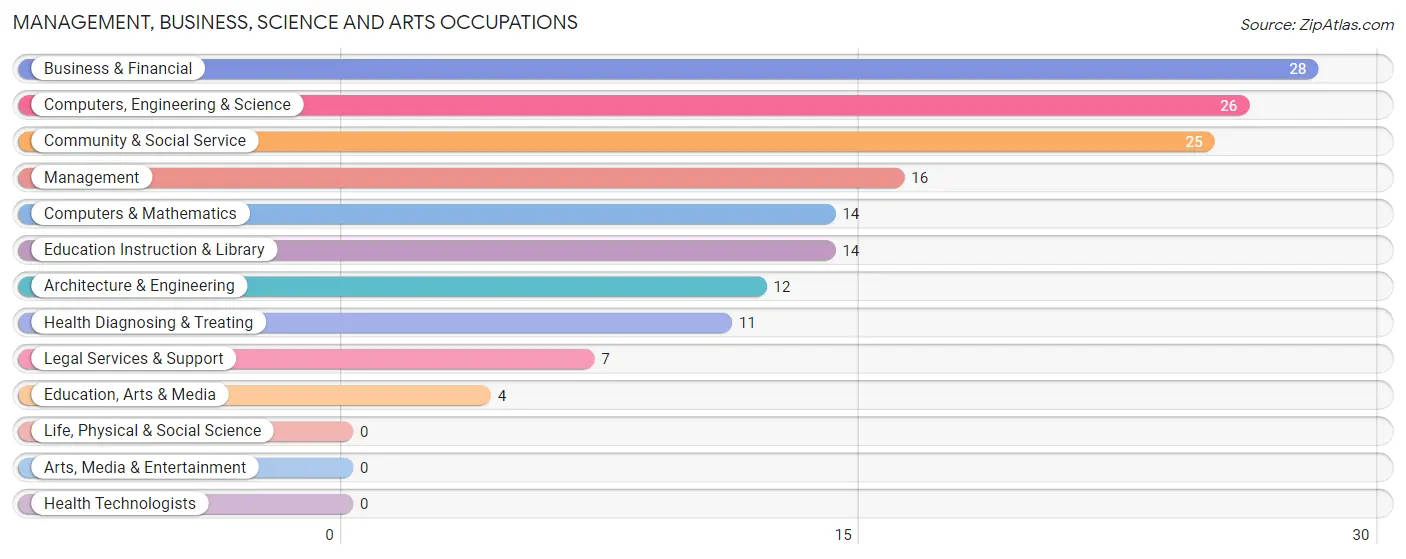
Management, Business, Science and Arts Occupations
The most common Management, Business, Science and Arts occupations in Marshall are Business & Financial (28 | 9.8%), Computers, Engineering & Science (26 | 9.1%), Community & Social Service (25 | 8.7%), Management (16 | 5.6%), and Computers & Mathematics (14 | 4.9%).
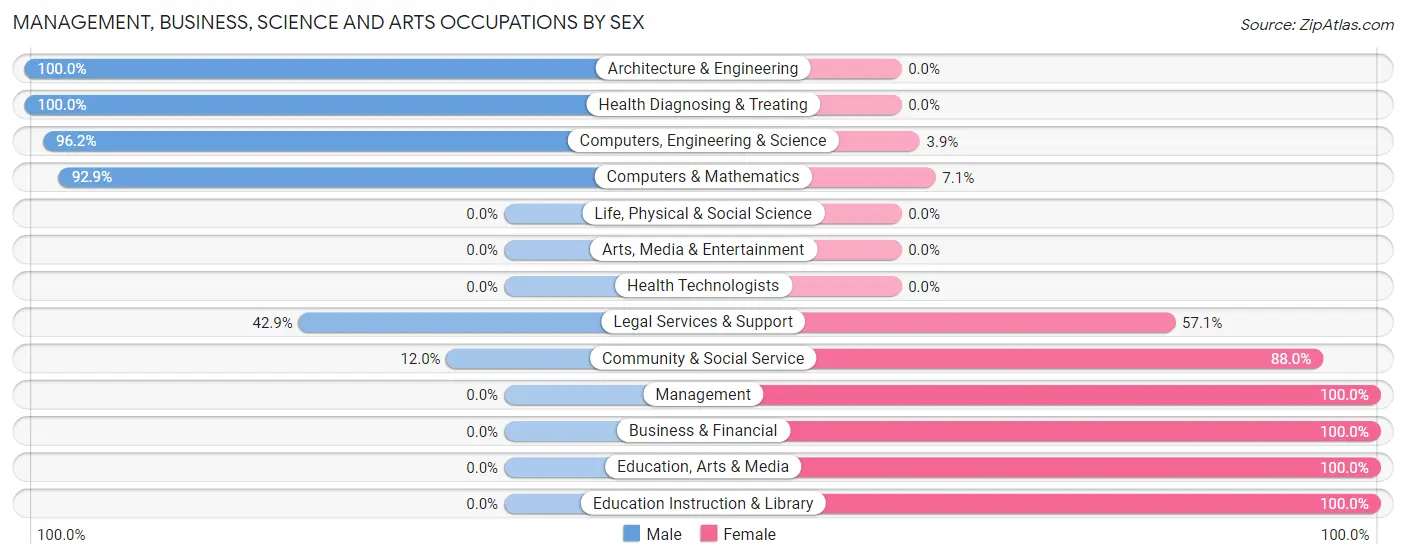
Management, Business, Science and Arts Occupations by Sex
Within the Management, Business, Science and Arts occupations in Marshall, the most male-oriented occupations are Architecture & Engineering (100.0%), Health Diagnosing & Treating (100.0%), and Computers, Engineering & Science (96.2%), while the most female-oriented occupations are Management (100.0%), Business & Financial (100.0%), and Education, Arts & Media (100.0%).
| Occupation | Male | Female |
| Management | 0 (0.0%) | 16 (100.0%) |
| Business & Financial | 0 (0.0%) | 28 (100.0%) |
| Computers, Engineering & Science | 25 (96.2%) | 1 (3.8%) |
| Computers & Mathematics | 13 (92.9%) | 1 (7.1%) |
| Architecture & Engineering | 12 (100.0%) | 0 (0.0%) |
| Life, Physical & Social Science | 0 (0.0%) | 0 (0.0%) |
| Community & Social Service | 3 (12.0%) | 22 (88.0%) |
| Education, Arts & Media | 0 (0.0%) | 4 (100.0%) |
| Legal Services & Support | 3 (42.9%) | 4 (57.1%) |
| Education Instruction & Library | 0 (0.0%) | 14 (100.0%) |
| Arts, Media & Entertainment | 0 (0.0%) | 0 (0.0%) |
| Health Diagnosing & Treating | 11 (100.0%) | 0 (0.0%) |
| Health Technologists | 0 (0.0%) | 0 (0.0%) |
| Total (Category) | 39 (36.8%) | 67 (63.2%) |
| Total (Overall) | 152 (53.0%) | 135 (47.0%) |
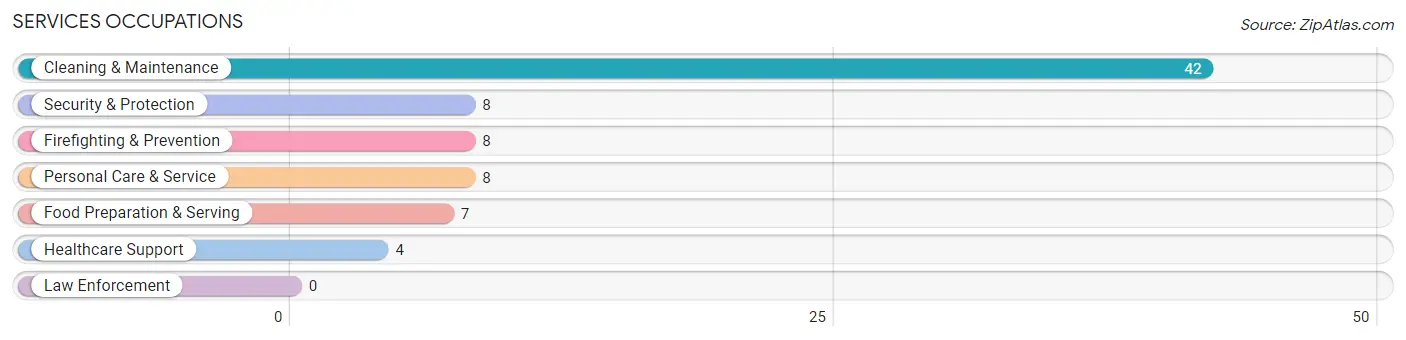
Services Occupations
The most common Services occupations in Marshall are Cleaning & Maintenance (42 | 14.6%), Security & Protection (8 | 2.8%), Firefighting & Prevention (8 | 2.8%), Personal Care & Service (8 | 2.8%), and Food Preparation & Serving (7 | 2.4%).
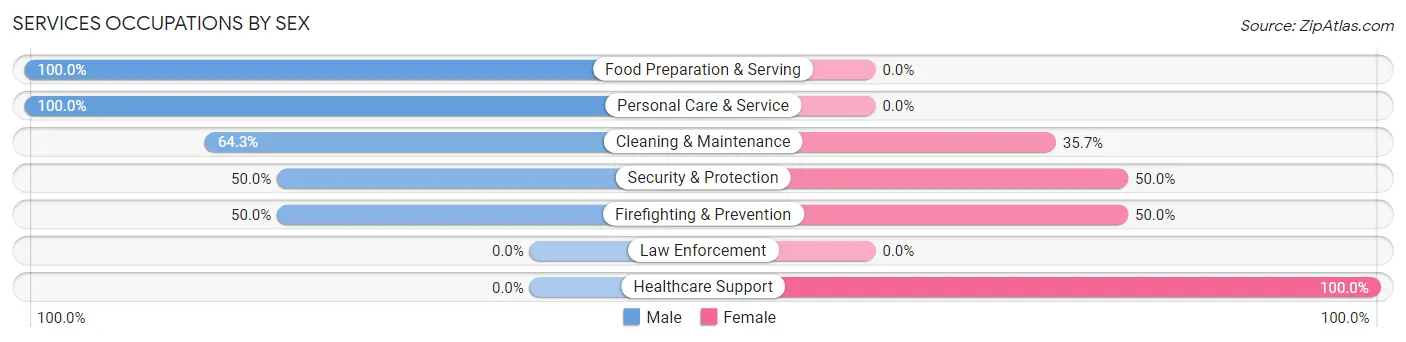
Services Occupations by Sex
Within the Services occupations in Marshall, the most male-oriented occupations are Food Preparation & Serving (100.0%), Personal Care & Service (100.0%), and Cleaning & Maintenance (64.3%), while the most female-oriented occupations are Healthcare Support (100.0%), Security & Protection (50.0%), and Firefighting & Prevention (50.0%).
| Occupation | Male | Female |
| Healthcare Support | 0 (0.0%) | 4 (100.0%) |
| Security & Protection | 4 (50.0%) | 4 (50.0%) |
| Firefighting & Prevention | 4 (50.0%) | 4 (50.0%) |
| Law Enforcement | 0 (0.0%) | 0 (0.0%) |
| Food Preparation & Serving | 7 (100.0%) | 0 (0.0%) |
| Cleaning & Maintenance | 27 (64.3%) | 15 (35.7%) |
| Personal Care & Service | 8 (100.0%) | 0 (0.0%) |
| Total (Category) | 46 (66.7%) | 23 (33.3%) |
| Total (Overall) | 152 (53.0%) | 135 (47.0%) |
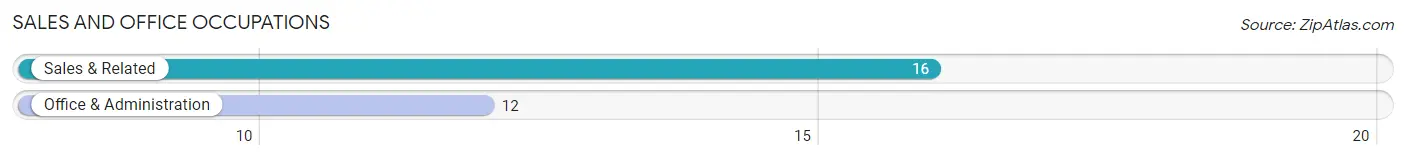
Sales and Office Occupations
The most common Sales and Office occupations in Marshall are Sales & Related (16 | 5.6%), and Office & Administration (12 | 4.2%).
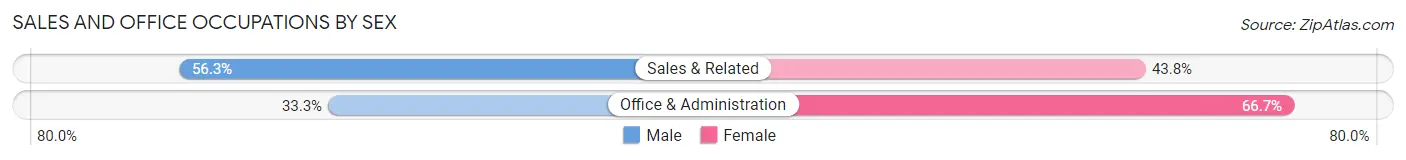
Sales and Office Occupations by Sex
| Occupation | Male | Female |
| Sales & Related | 9 (56.2%) | 7 (43.8%) |
| Office & Administration | 4 (33.3%) | 8 (66.7%) |
| Total (Category) | 13 (46.4%) | 15 (53.6%) |
| Total (Overall) | 152 (53.0%) | 135 (47.0%) |
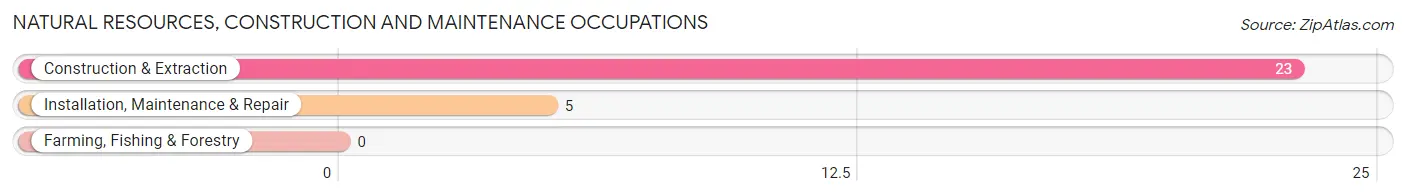
Natural Resources, Construction and Maintenance Occupations
The most common Natural Resources, Construction and Maintenance occupations in Marshall are Construction & Extraction (23 | 8.0%), and Installation, Maintenance & Repair (5 | 1.7%).
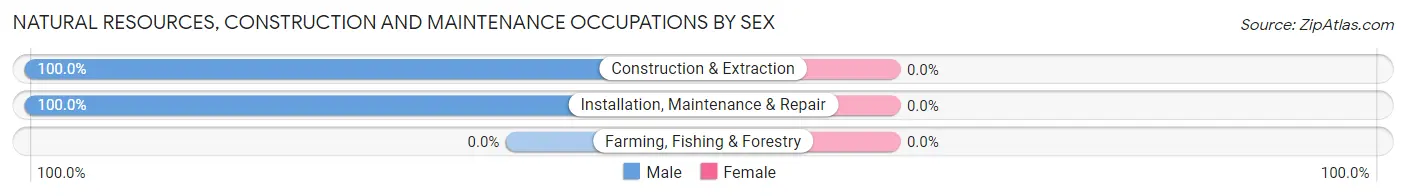
Natural Resources, Construction and Maintenance Occupations by Sex
| Occupation | Male | Female |
| Farming, Fishing & Forestry | 0 (0.0%) | 0 (0.0%) |
| Construction & Extraction | 23 (100.0%) | 0 (0.0%) |
| Installation, Maintenance & Repair | 5 (100.0%) | 0 (0.0%) |
| Total (Category) | 28 (100.0%) | 0 (0.0%) |
| Total (Overall) | 152 (53.0%) | 135 (47.0%) |
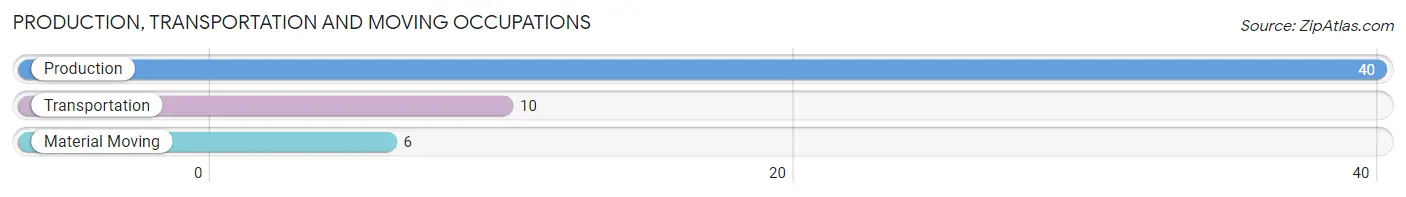
Production, Transportation and Moving Occupations
The most common Production, Transportation and Moving occupations in Marshall are Production (40 | 13.9%), Transportation (10 | 3.5%), and Material Moving (6 | 2.1%).
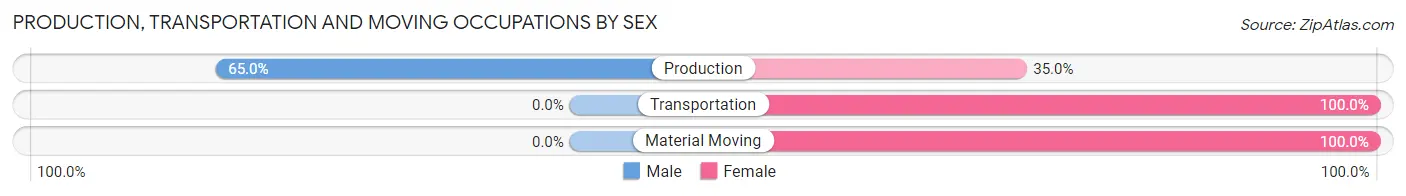
Production, Transportation and Moving Occupations by Sex
| Occupation | Male | Female |
| Production | 26 (65.0%) | 14 (35.0%) |
| Transportation | 0 (0.0%) | 10 (100.0%) |
| Material Moving | 0 (0.0%) | 6 (100.0%) |
| Total (Category) | 26 (46.4%) | 30 (53.6%) |
| Total (Overall) | 152 (53.0%) | 135 (47.0%) |
Employment Industries by Sex in Marshall
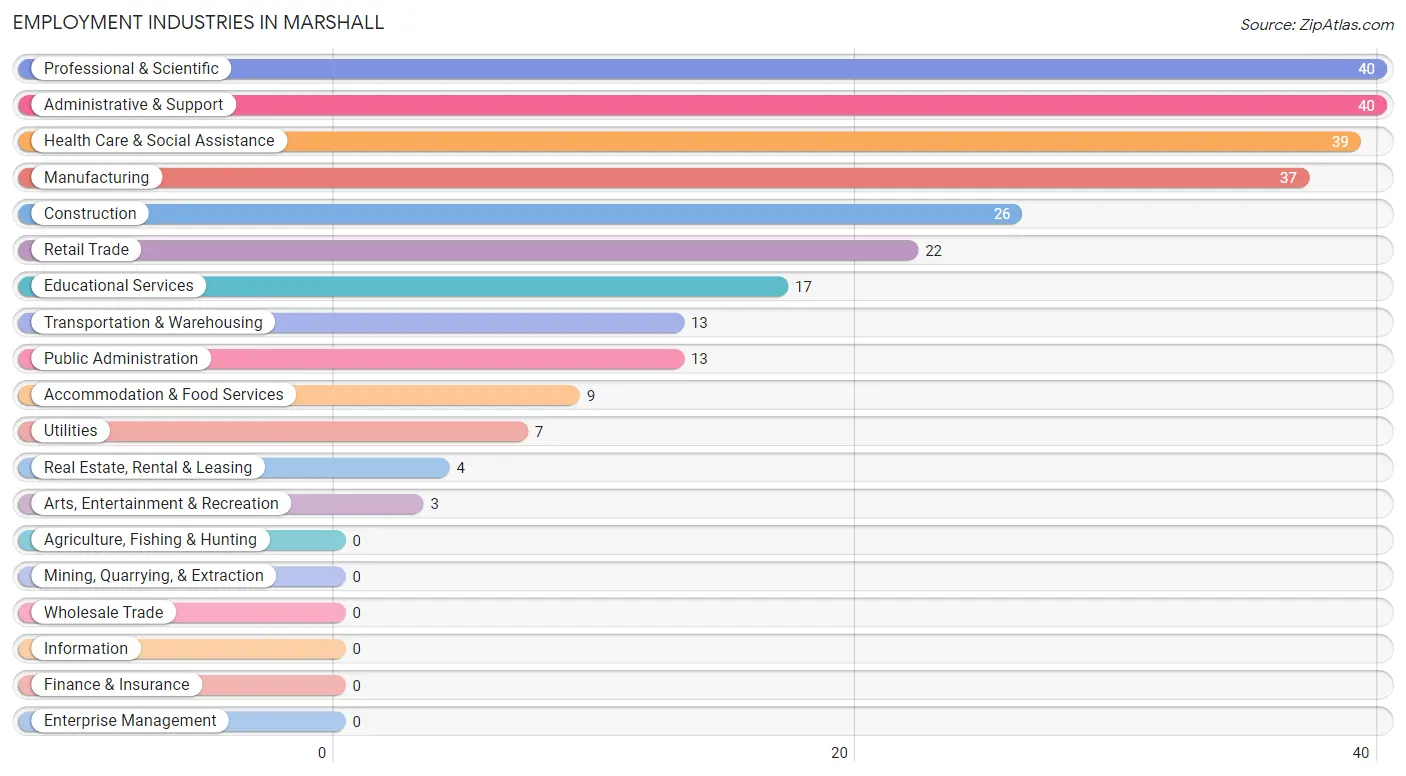
Employment Industries in Marshall
The major employment industries in Marshall include Professional & Scientific (40 | 13.9%), Administrative & Support (40 | 13.9%), Health Care & Social Assistance (39 | 13.6%), Manufacturing (37 | 12.9%), and Construction (26 | 9.1%).
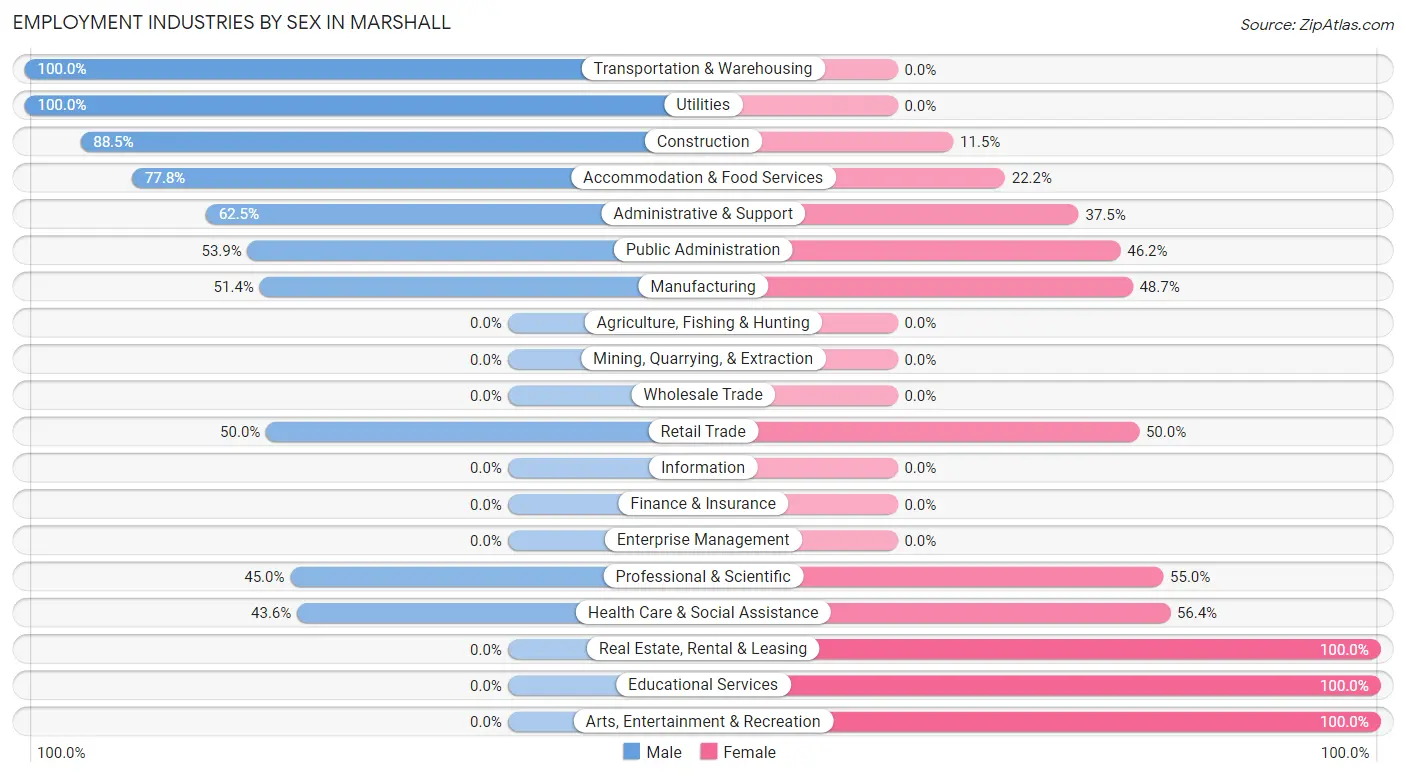
Employment Industries by Sex in Marshall
The Marshall industries that see more men than women are Transportation & Warehousing (100.0%), Utilities (100.0%), and Construction (88.5%), whereas the industries that tend to have a higher number of women are Real Estate, Rental & Leasing (100.0%), Educational Services (100.0%), and Arts, Entertainment & Recreation (100.0%).
| Industry | Male | Female |
| Agriculture, Fishing & Hunting | 0 (0.0%) | 0 (0.0%) |
| Mining, Quarrying, & Extraction | 0 (0.0%) | 0 (0.0%) |
| Construction | 23 (88.5%) | 3 (11.5%) |
| Manufacturing | 19 (51.3%) | 18 (48.6%) |
| Wholesale Trade | 0 (0.0%) | 0 (0.0%) |
| Retail Trade | 11 (50.0%) | 11 (50.0%) |
| Transportation & Warehousing | 13 (100.0%) | 0 (0.0%) |
| Utilities | 7 (100.0%) | 0 (0.0%) |
| Information | 0 (0.0%) | 0 (0.0%) |
| Finance & Insurance | 0 (0.0%) | 0 (0.0%) |
| Real Estate, Rental & Leasing | 0 (0.0%) | 4 (100.0%) |
| Professional & Scientific | 18 (45.0%) | 22 (55.0%) |
| Enterprise Management | 0 (0.0%) | 0 (0.0%) |
| Administrative & Support | 25 (62.5%) | 15 (37.5%) |
| Educational Services | 0 (0.0%) | 17 (100.0%) |
| Health Care & Social Assistance | 17 (43.6%) | 22 (56.4%) |
| Arts, Entertainment & Recreation | 0 (0.0%) | 3 (100.0%) |
| Accommodation & Food Services | 7 (77.8%) | 2 (22.2%) |
| Public Administration | 7 (53.8%) | 6 (46.2%) |
| Total | 152 (53.0%) | 135 (47.0%) |
Education in Marshall
School Enrollment in Marshall
The most common levels of schooling among the 92 students in Marshall are middle school (50 | 54.3%), graduate / professional (17 | 18.5%), and elementary school (15 | 16.3%).
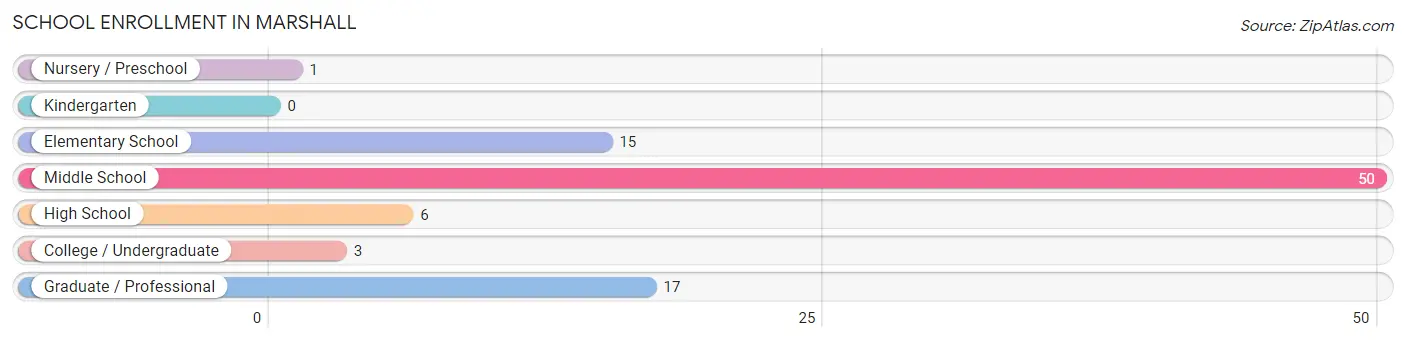
| School Level | # Students | % Students |
| Nursery / Preschool | 1 | 1.1% |
| Kindergarten | 0 | 0.0% |
| Elementary School | 15 | 16.3% |
| Middle School | 50 | 54.3% |
| High School | 6 | 6.5% |
| College / Undergraduate | 3 | 3.3% |
| Graduate / Professional | 17 | 18.5% |
| Total | 92 | 100.0% |
School Enrollment by Age by Funding Source in Marshall
Out of a total of 92 students who are enrolled in schools in Marshall, 3 (3.3%) attend a private institution, while the remaining 89 (96.7%) are enrolled in public schools. The age group of 5 to 9 year old has the highest likelihood of being enrolled in private schools, with 3 (20.0% in the age bracket) enrolled. Conversely, the age group of 3 to 4 year olds has the lowest likelihood of being enrolled in a private school, with 1 (100.0% in the age bracket) attending a public institution.
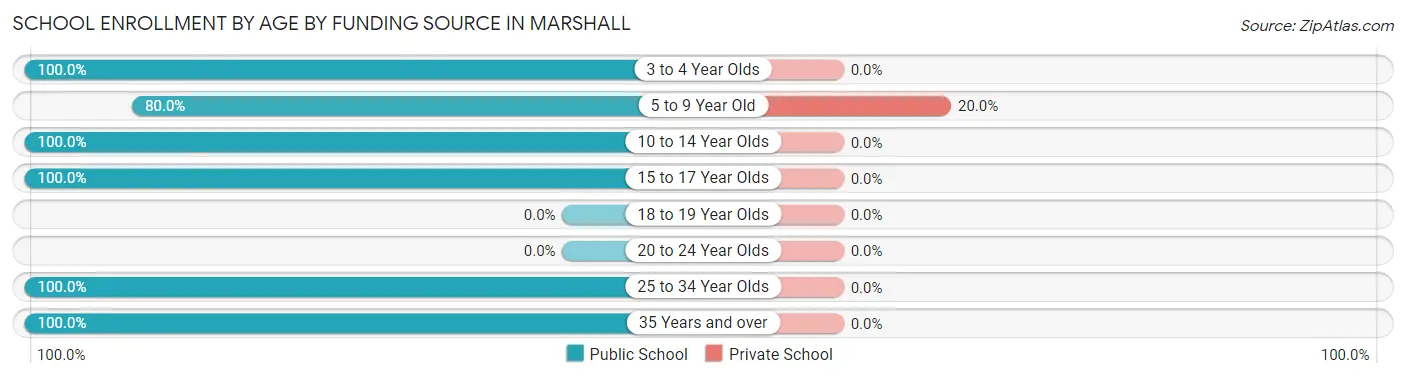
| Age Bracket | Public School | Private School |
| 3 to 4 Year Olds | 1 (100.0%) | 0 (0.0%) |
| 5 to 9 Year Old | 12 (80.0%) | 3 (20.0%) |
| 10 to 14 Year Olds | 50 (100.0%) | 0 (0.0%) |
| 15 to 17 Year Olds | 6 (100.0%) | 0 (0.0%) |
| 18 to 19 Year Olds | 0 (0.0%) | 0 (0.0%) |
| 20 to 24 Year Olds | 0 (0.0%) | 0 (0.0%) |
| 25 to 34 Year Olds | 17 (100.0%) | 0 (0.0%) |
| 35 Years and over | 3 (100.0%) | 0 (0.0%) |
| Total | 89 (96.7%) | 3 (3.3%) |
Educational Attainment by Field of Study in Marshall
Visual & performing arts (33 | 19.5%), bio, nature & agricultural (31 | 18.3%), education (22 | 13.0%), science & technology (17 | 10.1%), and computers & mathematics (12 | 7.1%) are the most common fields of study among 169 individuals in Marshall who have obtained a bachelor's degree or higher.
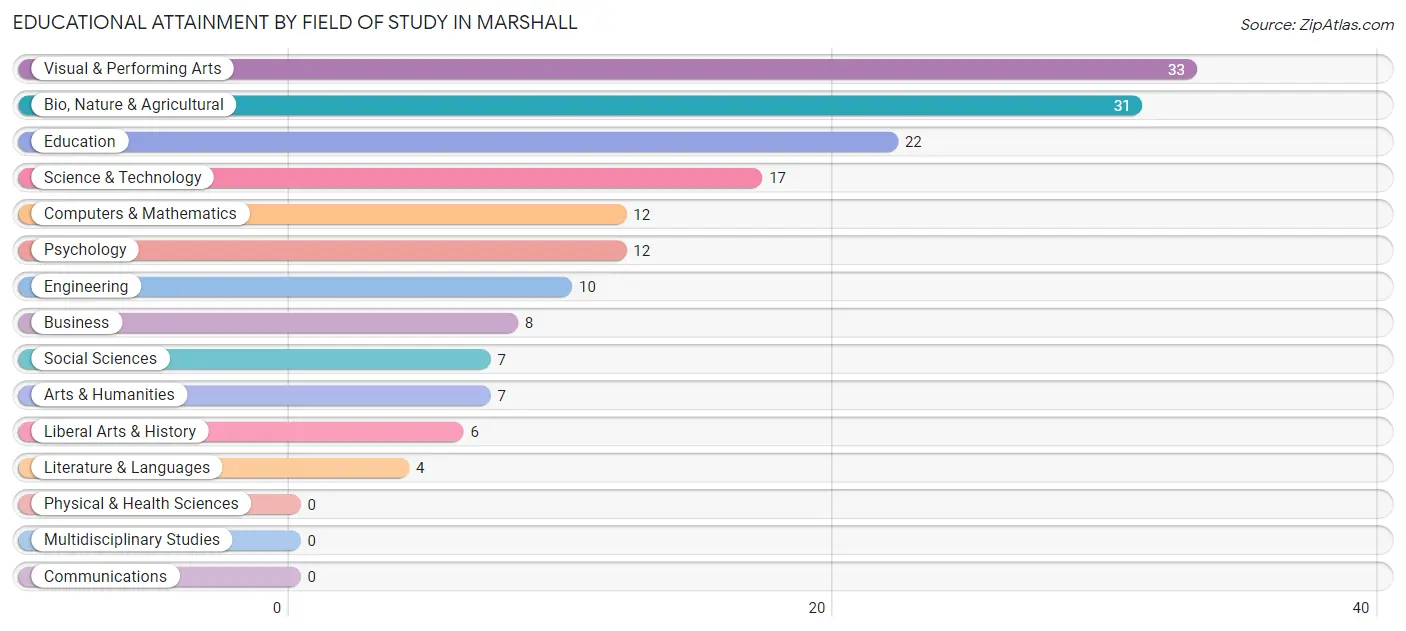
| Field of Study | # Graduates | % Graduates |
| Computers & Mathematics | 12 | 7.1% |
| Bio, Nature & Agricultural | 31 | 18.3% |
| Physical & Health Sciences | 0 | 0.0% |
| Psychology | 12 | 7.1% |
| Social Sciences | 7 | 4.1% |
| Engineering | 10 | 5.9% |
| Multidisciplinary Studies | 0 | 0.0% |
| Science & Technology | 17 | 10.1% |
| Business | 8 | 4.7% |
| Education | 22 | 13.0% |
| Literature & Languages | 4 | 2.4% |
| Liberal Arts & History | 6 | 3.5% |
| Visual & Performing Arts | 33 | 19.5% |
| Communications | 0 | 0.0% |
| Arts & Humanities | 7 | 4.1% |
| Total | 169 | 100.0% |
Transportation & Commute in Marshall
Vehicle Availability by Sex in Marshall
The most prevalent vehicle ownership categories in Marshall are males with 2 vehicles (58, accounting for 32.2%) and females with 2 vehicles (75, making up 43.0%).
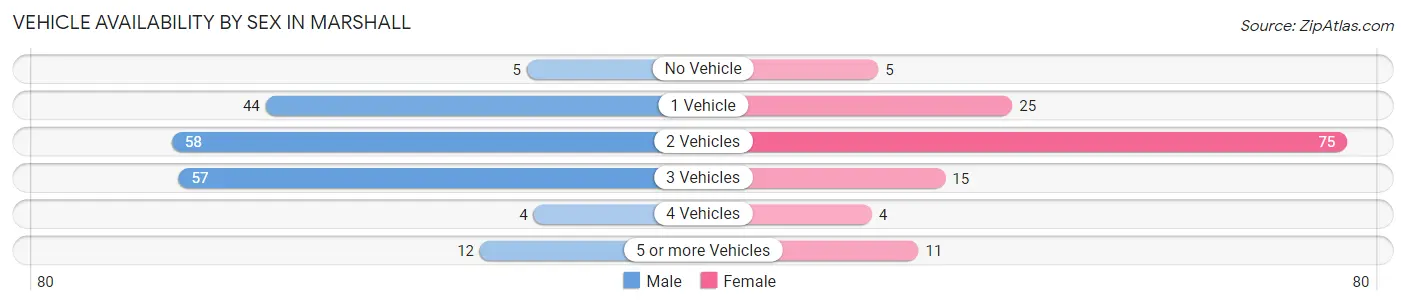
| Vehicles Available | Male | Female |
| No Vehicle | 5 (2.8%) | 5 (3.7%) |
| 1 Vehicle | 44 (24.4%) | 25 (18.5%) |
| 2 Vehicles | 58 (32.2%) | 75 (55.6%) |
| 3 Vehicles | 57 (31.7%) | 15 (11.1%) |
| 4 Vehicles | 4 (2.2%) | 4 (3.0%) |
| 5 or more Vehicles | 12 (6.7%) | 11 (8.2%) |
| Total | 180 (100.0%) | 135 (100.0%) |
Commute Time in Marshall
The most frequently occuring commute durations in Marshall are 10 to 14 minutes (42 commuters, 16.5%), 30 to 34 minutes (42 commuters, 16.5%), and 5 to 9 minutes (36 commuters, 14.2%).
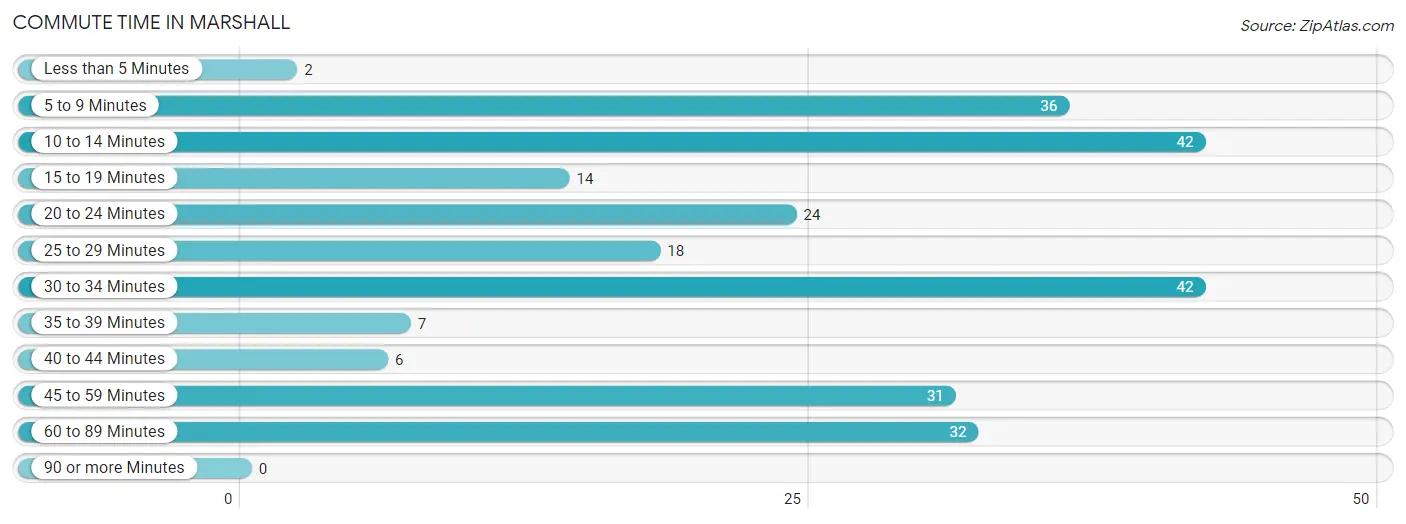
| Commute Time | # Commuters | % Commuters |
| Less than 5 Minutes | 2 | 0.8% |
| 5 to 9 Minutes | 36 | 14.2% |
| 10 to 14 Minutes | 42 | 16.5% |
| 15 to 19 Minutes | 14 | 5.5% |
| 20 to 24 Minutes | 24 | 9.5% |
| 25 to 29 Minutes | 18 | 7.1% |
| 30 to 34 Minutes | 42 | 16.5% |
| 35 to 39 Minutes | 7 | 2.8% |
| 40 to 44 Minutes | 6 | 2.4% |
| 45 to 59 Minutes | 31 | 12.2% |
| 60 to 89 Minutes | 32 | 12.6% |
| 90 or more Minutes | 0 | 0.0% |
Commute Time by Sex in Marshall
The most common commute times in Marshall are 45 to 59 minutes (31 commuters, 20.4%) for males and 10 to 14 minutes (38 commuters, 37.2%) for females.
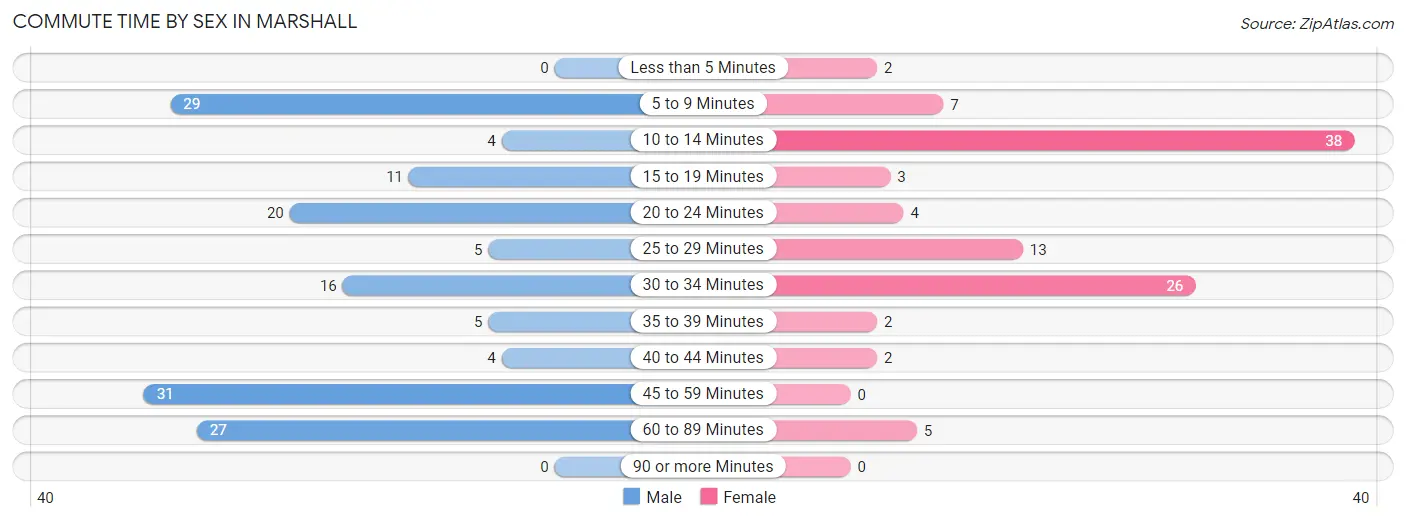
| Commute Time | Male | Female |
| Less than 5 Minutes | 0 (0.0%) | 2 (2.0%) |
| 5 to 9 Minutes | 29 (19.1%) | 7 (6.9%) |
| 10 to 14 Minutes | 4 (2.6%) | 38 (37.2%) |
| 15 to 19 Minutes | 11 (7.2%) | 3 (2.9%) |
| 20 to 24 Minutes | 20 (13.2%) | 4 (3.9%) |
| 25 to 29 Minutes | 5 (3.3%) | 13 (12.8%) |
| 30 to 34 Minutes | 16 (10.5%) | 26 (25.5%) |
| 35 to 39 Minutes | 5 (3.3%) | 2 (2.0%) |
| 40 to 44 Minutes | 4 (2.6%) | 2 (2.0%) |
| 45 to 59 Minutes | 31 (20.4%) | 0 (0.0%) |
| 60 to 89 Minutes | 27 (17.8%) | 5 (4.9%) |
| 90 or more Minutes | 0 (0.0%) | 0 (0.0%) |
Time of Departure to Work by Sex in Marshall
The most frequent times of departure to work in Marshall are 7:00 AM to 7:29 AM (45, 29.6%) for males and 5:30 AM to 5:59 AM (22, 21.6%) for females.
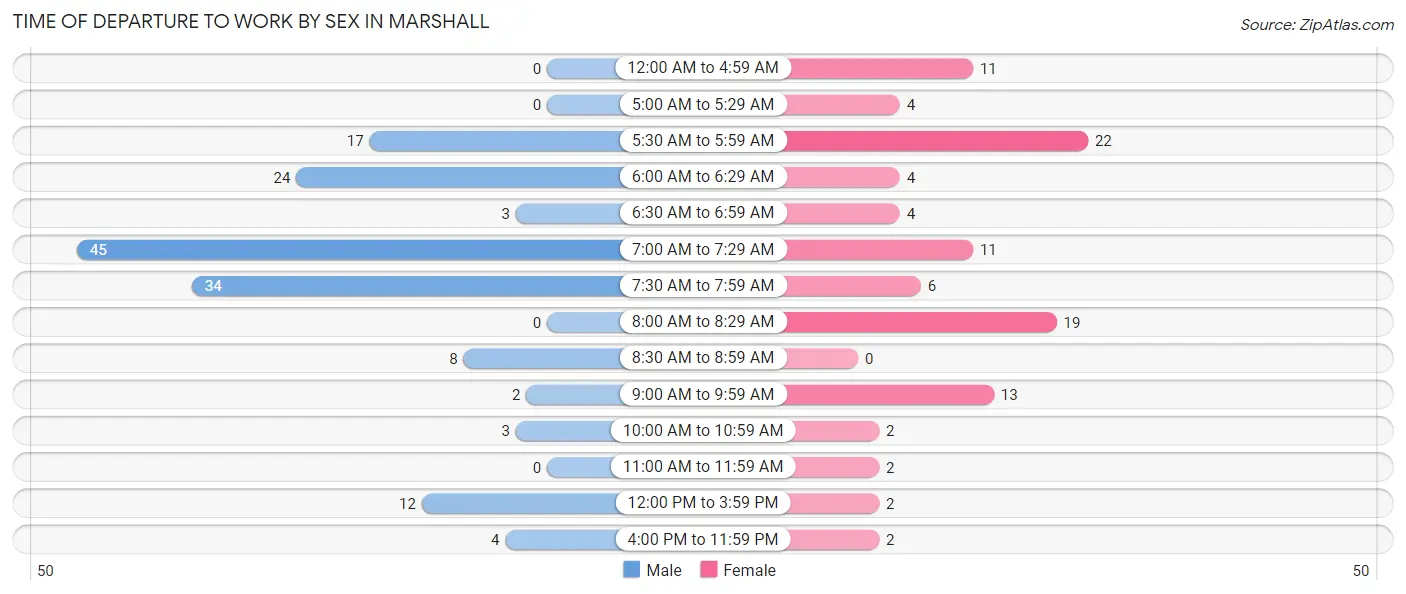
| Time of Departure | Male | Female |
| 12:00 AM to 4:59 AM | 0 (0.0%) | 11 (10.8%) |
| 5:00 AM to 5:29 AM | 0 (0.0%) | 4 (3.9%) |
| 5:30 AM to 5:59 AM | 17 (11.2%) | 22 (21.6%) |
| 6:00 AM to 6:29 AM | 24 (15.8%) | 4 (3.9%) |
| 6:30 AM to 6:59 AM | 3 (2.0%) | 4 (3.9%) |
| 7:00 AM to 7:29 AM | 45 (29.6%) | 11 (10.8%) |
| 7:30 AM to 7:59 AM | 34 (22.4%) | 6 (5.9%) |
| 8:00 AM to 8:29 AM | 0 (0.0%) | 19 (18.6%) |
| 8:30 AM to 8:59 AM | 8 (5.3%) | 0 (0.0%) |
| 9:00 AM to 9:59 AM | 2 (1.3%) | 13 (12.8%) |
| 10:00 AM to 10:59 AM | 3 (2.0%) | 2 (2.0%) |
| 11:00 AM to 11:59 AM | 0 (0.0%) | 2 (2.0%) |
| 12:00 PM to 3:59 PM | 12 (7.9%) | 2 (2.0%) |
| 4:00 PM to 11:59 PM | 4 (2.6%) | 2 (2.0%) |
| Total | 152 (100.0%) | 102 (100.0%) |
Housing Occupancy in Marshall
Occupancy by Ownership in Marshall
Of the total 303 dwellings in Marshall, owner-occupied units account for 183 (60.4%), while renter-occupied units make up 120 (39.6%).
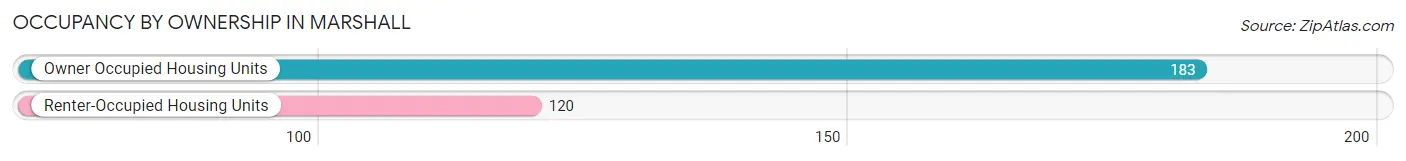
| Occupancy | # Housing Units | % Housing Units |
| Owner Occupied Housing Units | 183 | 60.4% |
| Renter-Occupied Housing Units | 120 | 39.6% |
| Total Occupied Housing Units | 303 | 100.0% |
Occupancy by Household Size in Marshall
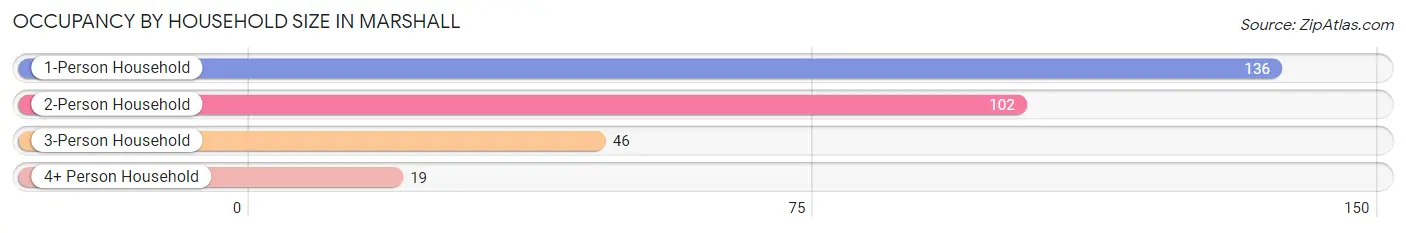
| Household Size | # Housing Units | % Housing Units |
| 1-Person Household | 136 | 44.9% |
| 2-Person Household | 102 | 33.7% |
| 3-Person Household | 46 | 15.2% |
| 4+ Person Household | 19 | 6.3% |
| Total Housing Units | 303 | 100.0% |
Occupancy by Ownership by Household Size in Marshall
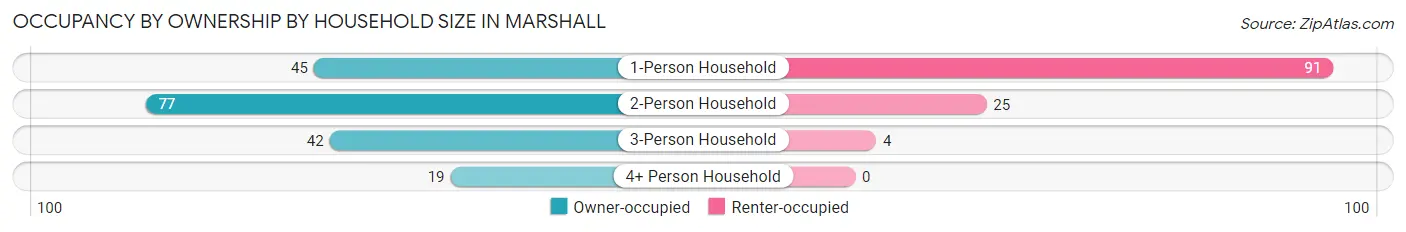
| Household Size | Owner-occupied | Renter-occupied |
| 1-Person Household | 45 (33.1%) | 91 (66.9%) |
| 2-Person Household | 77 (75.5%) | 25 (24.5%) |
| 3-Person Household | 42 (91.3%) | 4 (8.7%) |
| 4+ Person Household | 19 (100.0%) | 0 (0.0%) |
| Total Housing Units | 183 (60.4%) | 120 (39.6%) |
Occupancy by Educational Attainment in Marshall
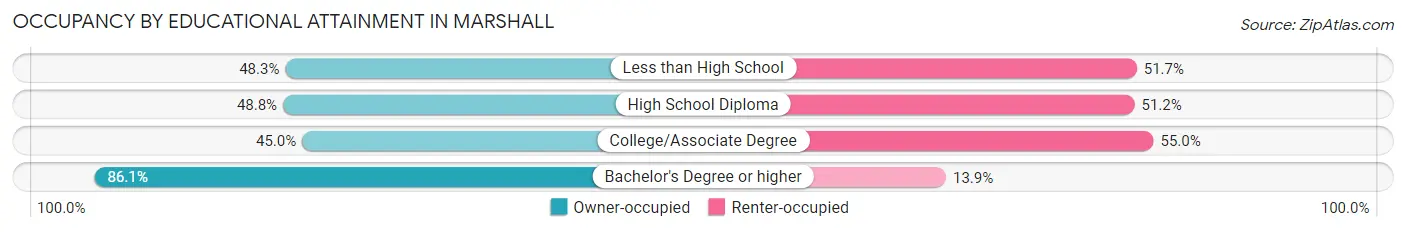
| Household Size | Owner-occupied | Renter-occupied |
| Less than High School | 29 (48.3%) | 31 (51.7%) |
| High School Diploma | 40 (48.8%) | 42 (51.2%) |
| College/Associate Degree | 27 (45.0%) | 33 (55.0%) |
| Bachelor's Degree or higher | 87 (86.1%) | 14 (13.9%) |
Occupancy by Age of Householder in Marshall
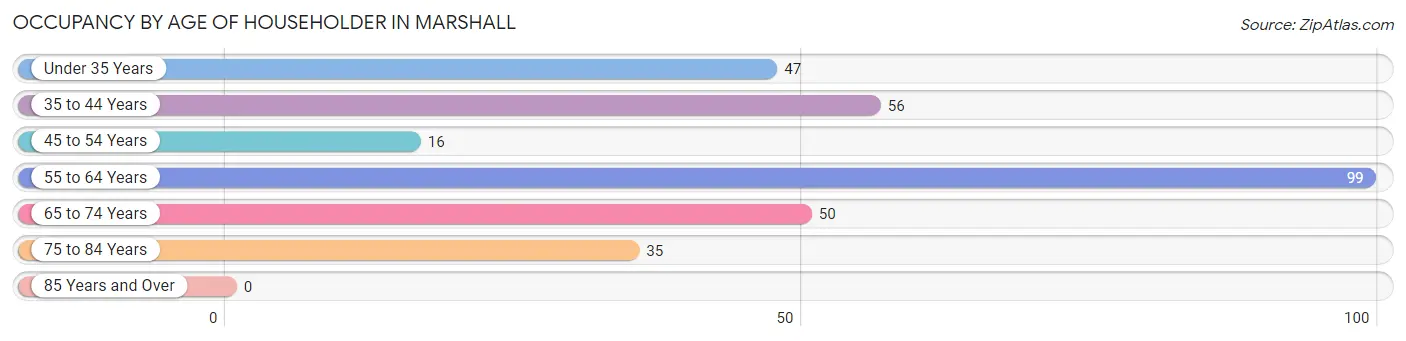
| Age Bracket | # Households | % Households |
| Under 35 Years | 47 | 15.5% |
| 35 to 44 Years | 56 | 18.5% |
| 45 to 54 Years | 16 | 5.3% |
| 55 to 64 Years | 99 | 32.7% |
| 65 to 74 Years | 50 | 16.5% |
| 75 to 84 Years | 35 | 11.6% |
| 85 Years and Over | 0 | 0.0% |
| Total | 303 | 100.0% |
Housing Finances in Marshall
Median Income by Occupancy in Marshall
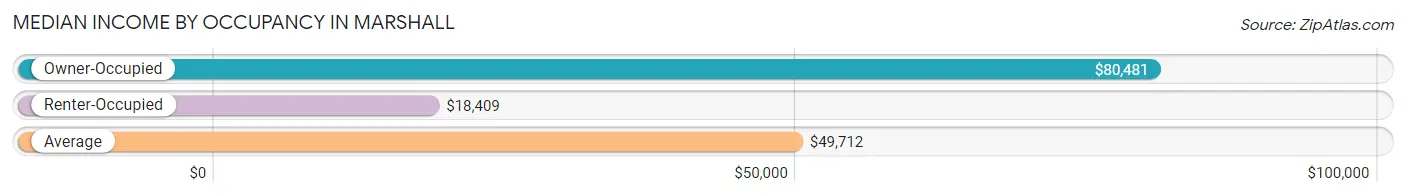
| Occupancy Type | # Households | Median Income |
| Owner-Occupied | 183 (60.4%) | $80,481 |
| Renter-Occupied | 120 (39.6%) | $18,409 |
| Average | 303 (100.0%) | $49,712 |
Occupancy by Householder Income Bracket in Marshall
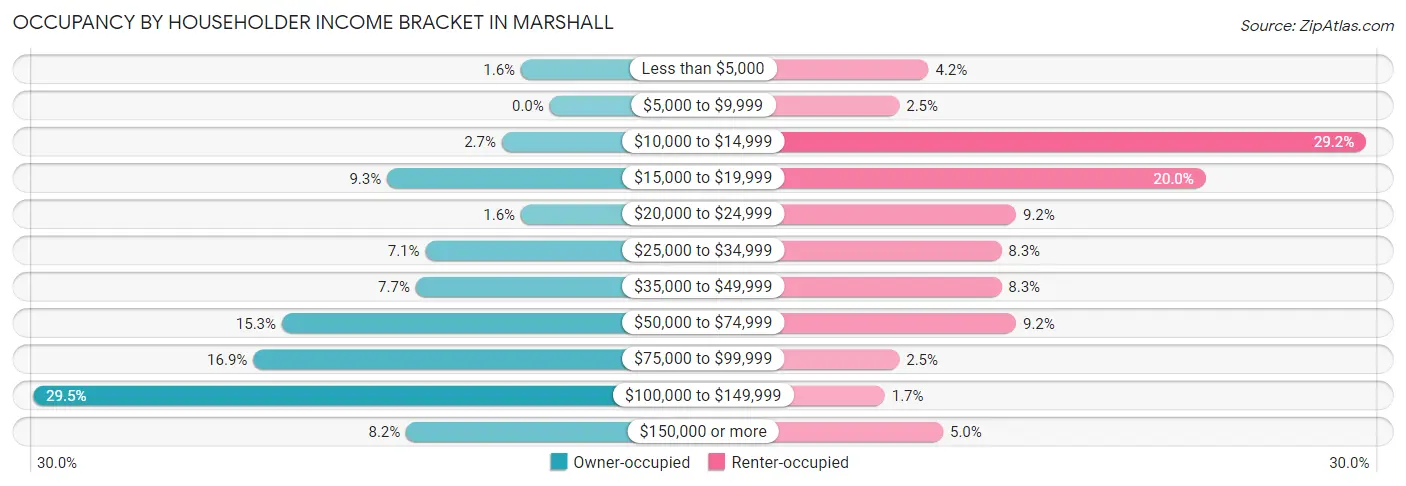
| Income Bracket | Owner-occupied | Renter-occupied |
| Less than $5,000 | 3 (1.6%) | 5 (4.2%) |
| $5,000 to $9,999 | 0 (0.0%) | 3 (2.5%) |
| $10,000 to $14,999 | 5 (2.7%) | 35 (29.2%) |
| $15,000 to $19,999 | 17 (9.3%) | 24 (20.0%) |
| $20,000 to $24,999 | 3 (1.6%) | 11 (9.2%) |
| $25,000 to $34,999 | 13 (7.1%) | 10 (8.3%) |
| $35,000 to $49,999 | 14 (7.6%) | 10 (8.3%) |
| $50,000 to $74,999 | 28 (15.3%) | 11 (9.2%) |
| $75,000 to $99,999 | 31 (16.9%) | 3 (2.5%) |
| $100,000 to $149,999 | 54 (29.5%) | 2 (1.7%) |
| $150,000 or more | 15 (8.2%) | 6 (5.0%) |
| Total | 183 (100.0%) | 120 (100.0%) |
Monthly Housing Cost Tiers in Marshall
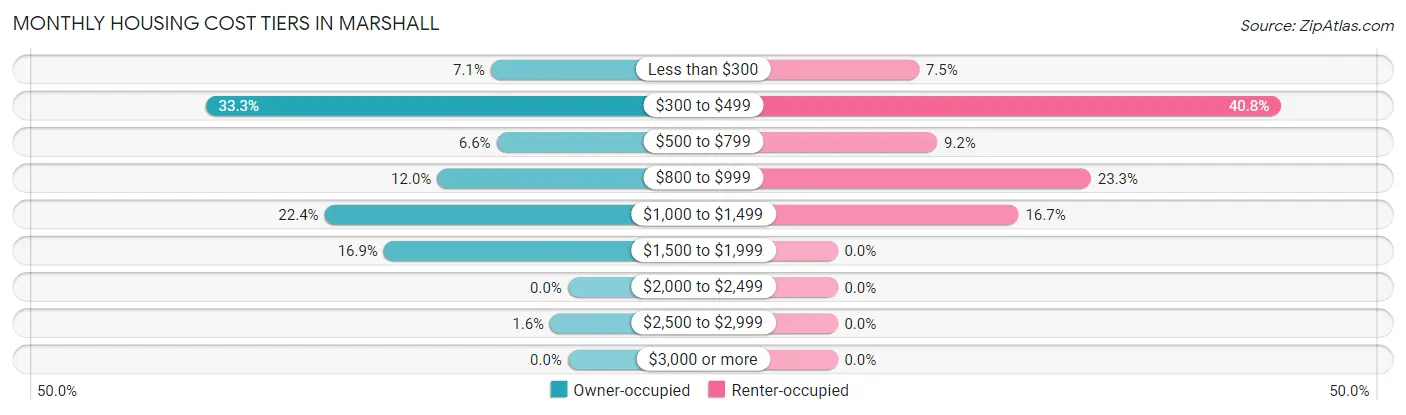
| Monthly Cost | Owner-occupied | Renter-occupied |
| Less than $300 | 13 (7.1%) | 9 (7.5%) |
| $300 to $499 | 61 (33.3%) | 49 (40.8%) |
| $500 to $799 | 12 (6.6%) | 11 (9.2%) |
| $800 to $999 | 22 (12.0%) | 28 (23.3%) |
| $1,000 to $1,499 | 41 (22.4%) | 20 (16.7%) |
| $1,500 to $1,999 | 31 (16.9%) | 0 (0.0%) |
| $2,000 to $2,499 | 0 (0.0%) | 0 (0.0%) |
| $2,500 to $2,999 | 3 (1.6%) | 0 (0.0%) |
| $3,000 or more | 0 (0.0%) | 0 (0.0%) |
| Total | 183 (100.0%) | 120 (100.0%) |
Physical Housing Characteristics in Marshall
Housing Structures in Marshall
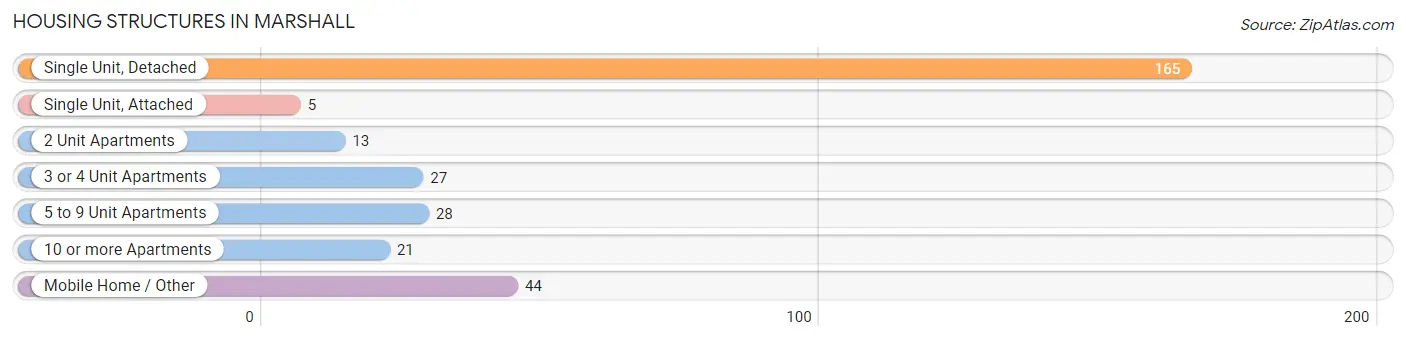
| Structure Type | # Housing Units | % Housing Units |
| Single Unit, Detached | 165 | 54.5% |
| Single Unit, Attached | 5 | 1.7% |
| 2 Unit Apartments | 13 | 4.3% |
| 3 or 4 Unit Apartments | 27 | 8.9% |
| 5 to 9 Unit Apartments | 28 | 9.2% |
| 10 or more Apartments | 21 | 6.9% |
| Mobile Home / Other | 44 | 14.5% |
| Total | 303 | 100.0% |
Housing Structures by Occupancy in Marshall
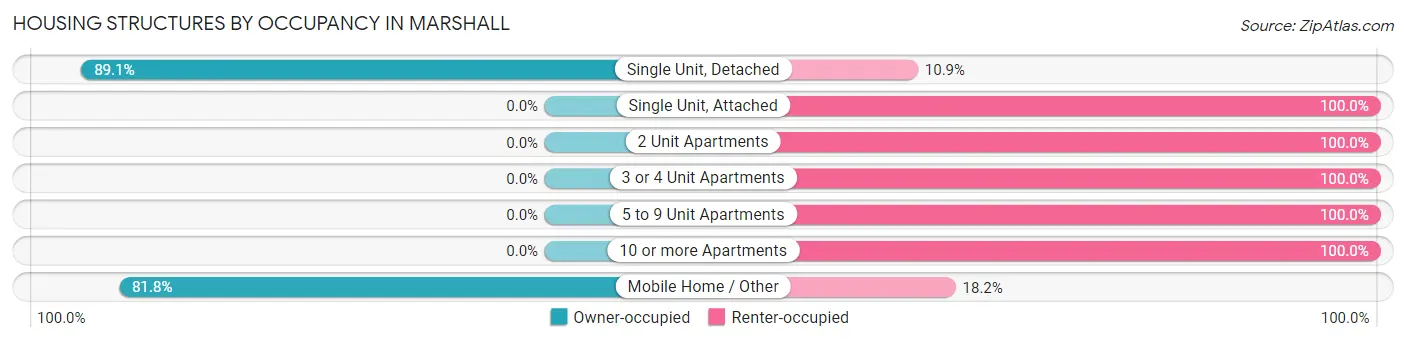
| Structure Type | Owner-occupied | Renter-occupied |
| Single Unit, Detached | 147 (89.1%) | 18 (10.9%) |
| Single Unit, Attached | 0 (0.0%) | 5 (100.0%) |
| 2 Unit Apartments | 0 (0.0%) | 13 (100.0%) |
| 3 or 4 Unit Apartments | 0 (0.0%) | 27 (100.0%) |
| 5 to 9 Unit Apartments | 0 (0.0%) | 28 (100.0%) |
| 10 or more Apartments | 0 (0.0%) | 21 (100.0%) |
| Mobile Home / Other | 36 (81.8%) | 8 (18.2%) |
| Total | 183 (60.4%) | 120 (39.6%) |
Housing Structures by Number of Rooms in Marshall
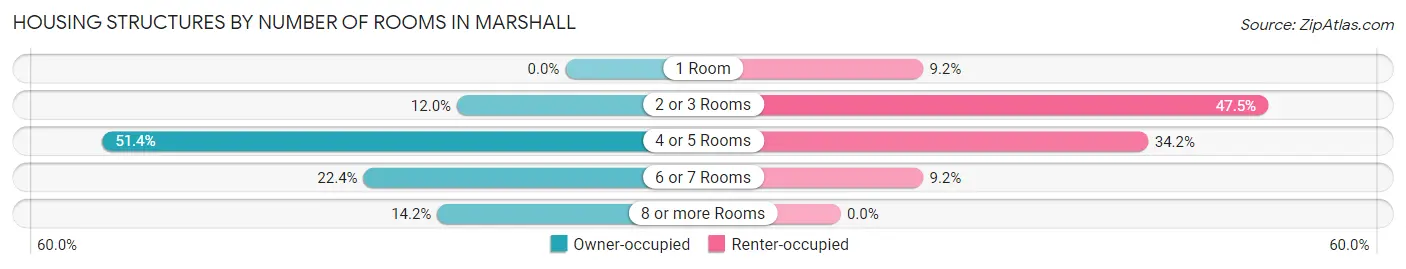
| Number of Rooms | Owner-occupied | Renter-occupied |
| 1 Room | 0 (0.0%) | 11 (9.2%) |
| 2 or 3 Rooms | 22 (12.0%) | 57 (47.5%) |
| 4 or 5 Rooms | 94 (51.4%) | 41 (34.2%) |
| 6 or 7 Rooms | 41 (22.4%) | 11 (9.2%) |
| 8 or more Rooms | 26 (14.2%) | 0 (0.0%) |
| Total | 183 (100.0%) | 120 (100.0%) |
Housing Structure by Heating Type in Marshall
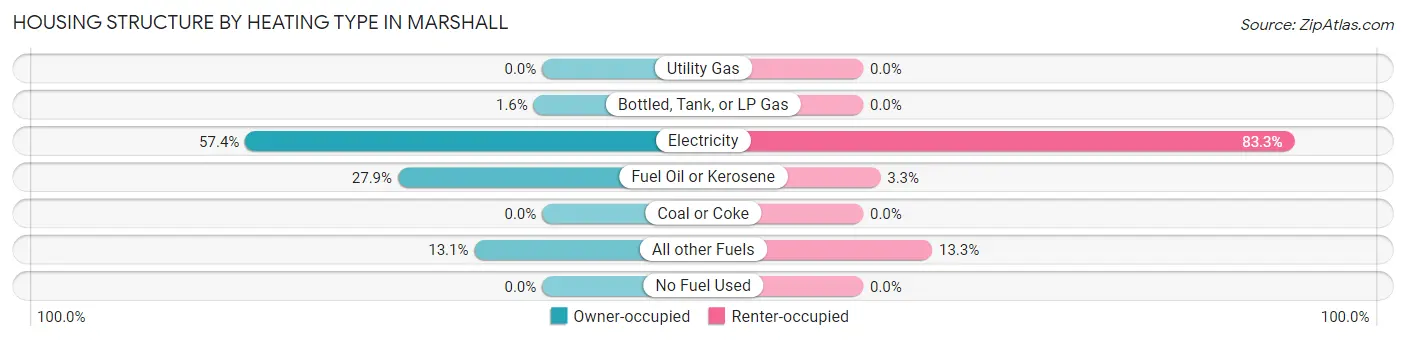
| Heating Type | Owner-occupied | Renter-occupied |
| Utility Gas | 0 (0.0%) | 0 (0.0%) |
| Bottled, Tank, or LP Gas | 3 (1.6%) | 0 (0.0%) |
| Electricity | 105 (57.4%) | 100 (83.3%) |
| Fuel Oil or Kerosene | 51 (27.9%) | 4 (3.3%) |
| Coal or Coke | 0 (0.0%) | 0 (0.0%) |
| All other Fuels | 24 (13.1%) | 16 (13.3%) |
| No Fuel Used | 0 (0.0%) | 0 (0.0%) |
| Total | 183 (100.0%) | 120 (100.0%) |
Household Vehicle Usage in Marshall
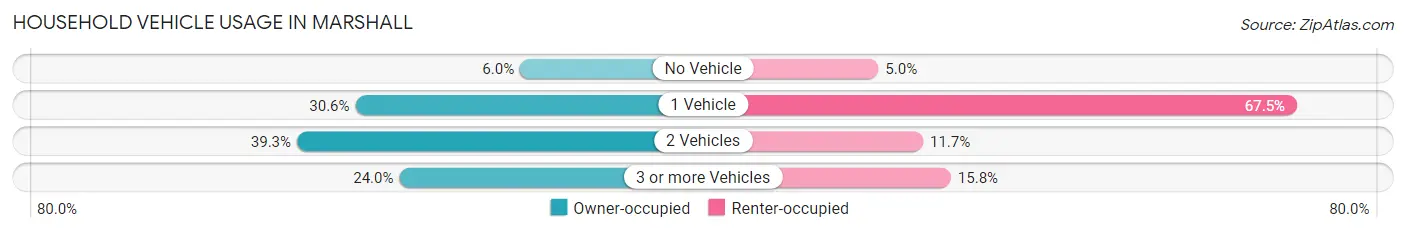
| Vehicles per Household | Owner-occupied | Renter-occupied |
| No Vehicle | 11 (6.0%) | 6 (5.0%) |
| 1 Vehicle | 56 (30.6%) | 81 (67.5%) |
| 2 Vehicles | 72 (39.3%) | 14 (11.7%) |
| 3 or more Vehicles | 44 (24.0%) | 19 (15.8%) |
| Total | 183 (100.0%) | 120 (100.0%) |
Real Estate & Mortgages in Marshall
Real Estate and Mortgage Overview in Marshall
| Characteristic | Without Mortgage | With Mortgage |
| Housing Units | 86 | 97 |
| Median Property Value | $211,100 | $231,100 |
| Median Household Income | - | - |
| Monthly Housing Costs | $395 | $0 |
| Real Estate Taxes | $1,330 | $0 |
Property Value by Mortgage Status in Marshall
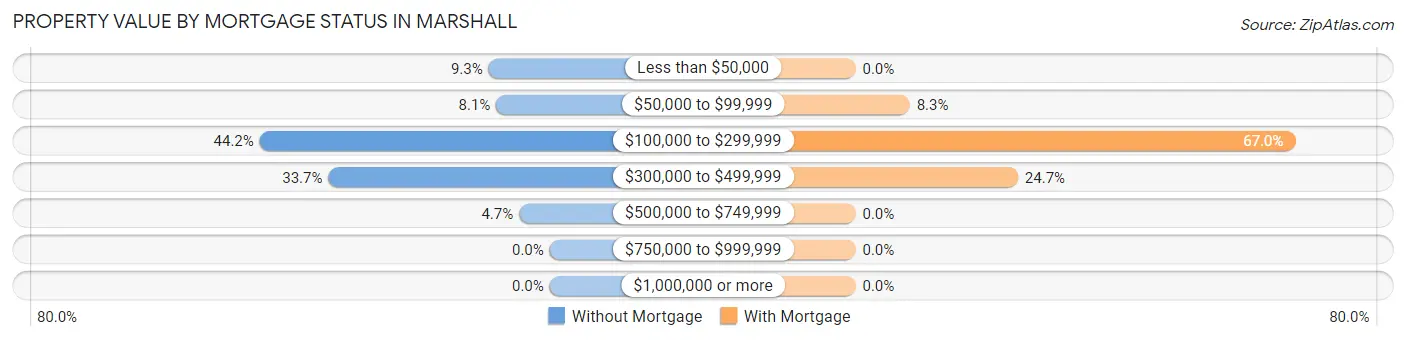
| Property Value | Without Mortgage | With Mortgage |
| Less than $50,000 | 8 (9.3%) | 0 (0.0%) |
| $50,000 to $99,999 | 7 (8.1%) | 8 (8.3%) |
| $100,000 to $299,999 | 38 (44.2%) | 65 (67.0%) |
| $300,000 to $499,999 | 29 (33.7%) | 24 (24.7%) |
| $500,000 to $749,999 | 4 (4.6%) | 0 (0.0%) |
| $750,000 to $999,999 | 0 (0.0%) | 0 (0.0%) |
| $1,000,000 or more | 0 (0.0%) | 0 (0.0%) |
| Total | 86 (100.0%) | 97 (100.0%) |
Household Income by Mortgage Status in Marshall
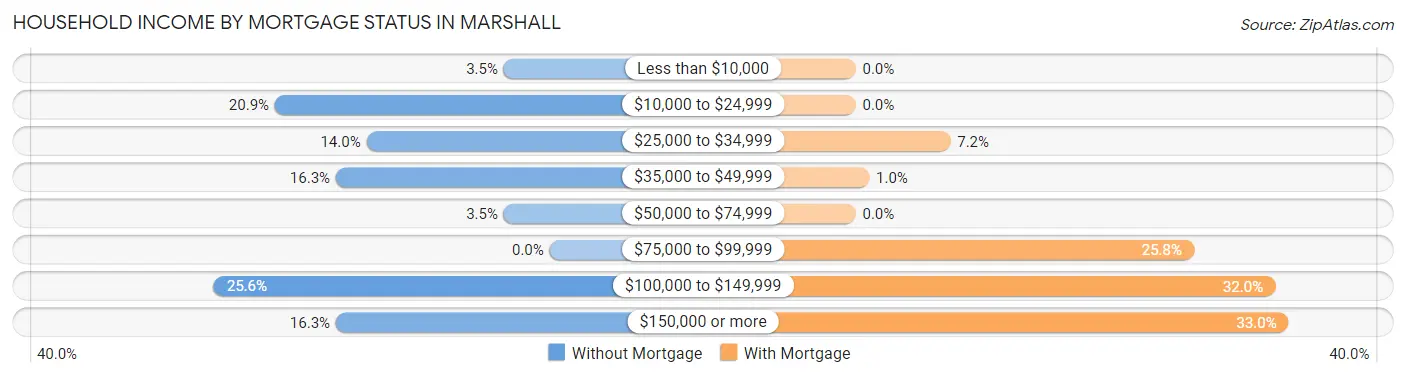
| Household Income | Without Mortgage | With Mortgage |
| Less than $10,000 | 3 (3.5%) | 0 (0.0%) |
| $10,000 to $24,999 | 18 (20.9%) | 0 (0.0%) |
| $25,000 to $34,999 | 12 (14.0%) | 7 (7.2%) |
| $35,000 to $49,999 | 14 (16.3%) | 1 (1.0%) |
| $50,000 to $74,999 | 3 (3.5%) | 0 (0.0%) |
| $75,000 to $99,999 | 0 (0.0%) | 25 (25.8%) |
| $100,000 to $149,999 | 22 (25.6%) | 31 (32.0%) |
| $150,000 or more | 14 (16.3%) | 32 (33.0%) |
| Total | 86 (100.0%) | 97 (100.0%) |
Property Value to Household Income Ratio in Marshall
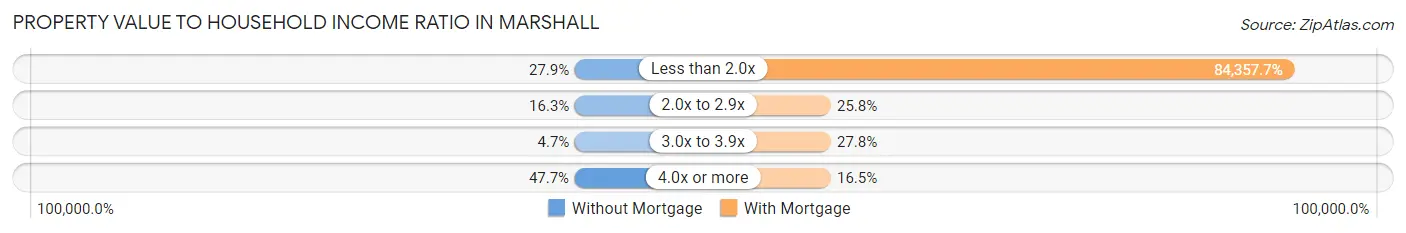
| Value-to-Income Ratio | Without Mortgage | With Mortgage |
| Less than 2.0x | 24 (27.9%) | 81,827 (84,357.7%) |
| 2.0x to 2.9x | 14 (16.3%) | 25 (25.8%) |
| 3.0x to 3.9x | 4 (4.6%) | 27 (27.8%) |
| 4.0x or more | 41 (47.7%) | 16 (16.5%) |
| Total | 86 (100.0%) | 97 (100.0%) |
Real Estate Taxes by Mortgage Status in Marshall
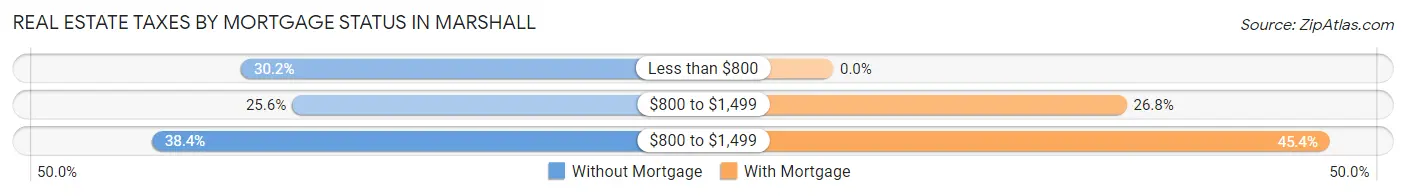
| Property Taxes | Without Mortgage | With Mortgage |
| Less than $800 | 26 (30.2%) | 0 (0.0%) |
| $800 to $1,499 | 22 (25.6%) | 26 (26.8%) |
| $800 to $1,499 | 33 (38.4%) | 44 (45.4%) |
| Total | 86 (100.0%) | 97 (100.0%) |
Health & Disability in Marshall
Health Insurance Coverage by Age in Marshall
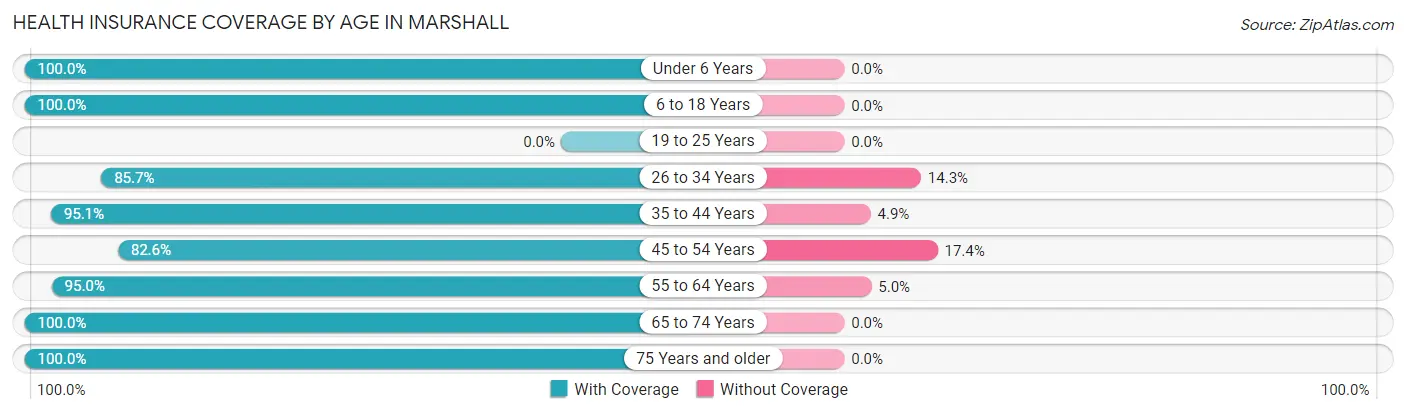
| Age Bracket | With Coverage | Without Coverage |
| Under 6 Years | 9 (100.0%) | 0 (0.0%) |
| 6 to 18 Years | 71 (100.0%) | 0 (0.0%) |
| 19 to 25 Years | 0 (0.0%) | 0 (0.0%) |
| 26 to 34 Years | 54 (85.7%) | 9 (14.3%) |
| 35 to 44 Years | 136 (95.1%) | 7 (4.9%) |
| 45 to 54 Years | 38 (82.6%) | 8 (17.4%) |
| 55 to 64 Years | 113 (95.0%) | 6 (5.0%) |
| 65 to 74 Years | 69 (100.0%) | 0 (0.0%) |
| 75 Years and older | 48 (100.0%) | 0 (0.0%) |
| Total | 538 (94.7%) | 30 (5.3%) |
Health Insurance Coverage by Citizenship Status in Marshall
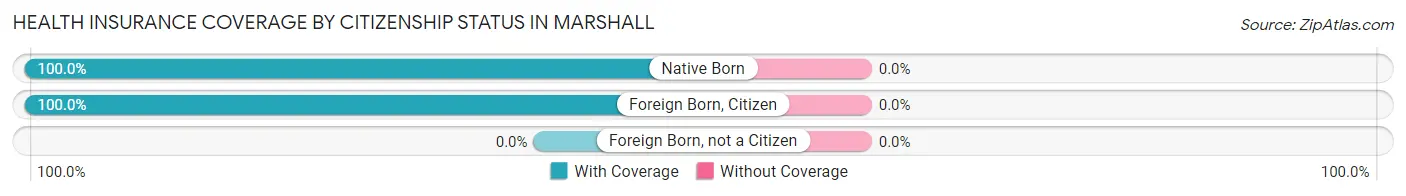
| Citizenship Status | With Coverage | Without Coverage |
| Native Born | 9 (100.0%) | 0 (0.0%) |
| Foreign Born, Citizen | 71 (100.0%) | 0 (0.0%) |
| Foreign Born, not a Citizen | 0 (0.0%) | 0 (0.0%) |
Health Insurance Coverage by Household Income in Marshall
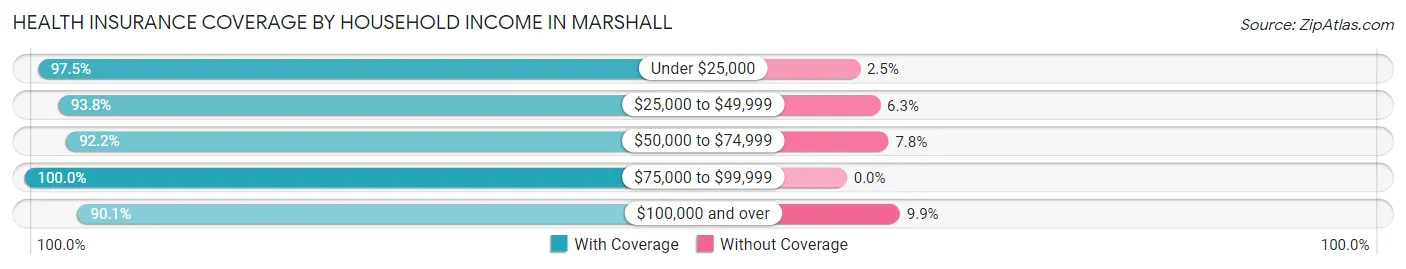
| Household Income | With Coverage | Without Coverage |
| Under $25,000 | 119 (97.5%) | 3 (2.5%) |
| $25,000 to $49,999 | 90 (93.8%) | 6 (6.2%) |
| $50,000 to $74,999 | 59 (92.2%) | 5 (7.8%) |
| $75,000 to $99,999 | 88 (100.0%) | 0 (0.0%) |
| $100,000 and over | 145 (90.1%) | 16 (9.9%) |
Public vs Private Health Insurance Coverage by Age in Marshall
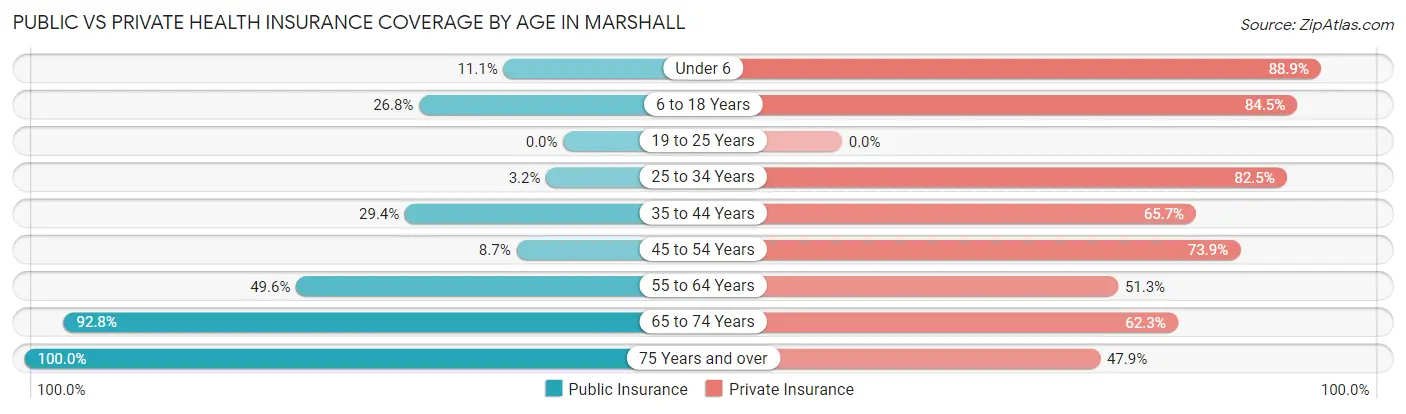
| Age Bracket | Public Insurance | Private Insurance |
| Under 6 | 1 (11.1%) | 8 (88.9%) |
| 6 to 18 Years | 19 (26.8%) | 60 (84.5%) |
| 19 to 25 Years | 0 (0.0%) | 0 (0.0%) |
| 25 to 34 Years | 2 (3.2%) | 52 (82.5%) |
| 35 to 44 Years | 42 (29.4%) | 94 (65.7%) |
| 45 to 54 Years | 4 (8.7%) | 34 (73.9%) |
| 55 to 64 Years | 59 (49.6%) | 61 (51.3%) |
| 65 to 74 Years | 64 (92.7%) | 43 (62.3%) |
| 75 Years and over | 48 (100.0%) | 23 (47.9%) |
| Total | 239 (42.1%) | 375 (66.0%) |
Disability Status by Sex by Age in Marshall
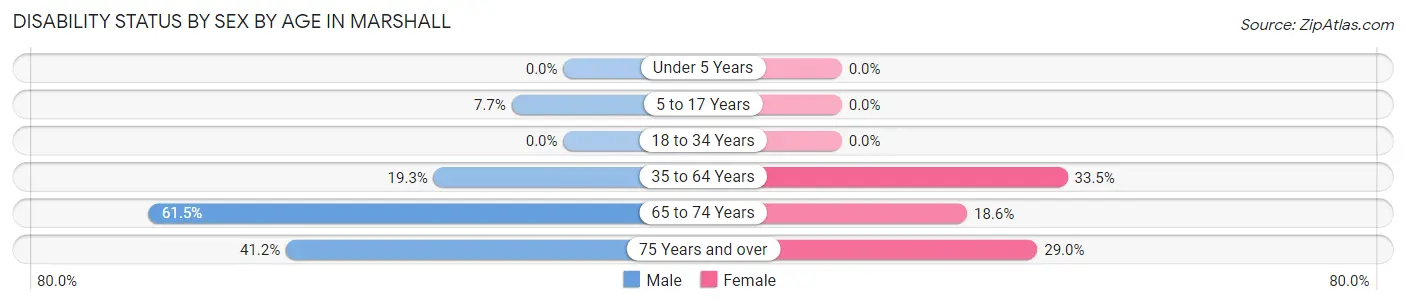
| Age Bracket | Male | Female |
| Under 5 Years | 0 (0.0%) | 0 (0.0%) |
| 5 to 17 Years | 3 (7.7%) | 0 (0.0%) |
| 18 to 34 Years | 0 (0.0%) | 0 (0.0%) |
| 35 to 64 Years | 26 (19.3%) | 58 (33.5%) |
| 65 to 74 Years | 16 (61.5%) | 8 (18.6%) |
| 75 Years and over | 7 (41.2%) | 9 (29.0%) |
Disability Class by Sex by Age in Marshall
Disability Class: Hearing Difficulty
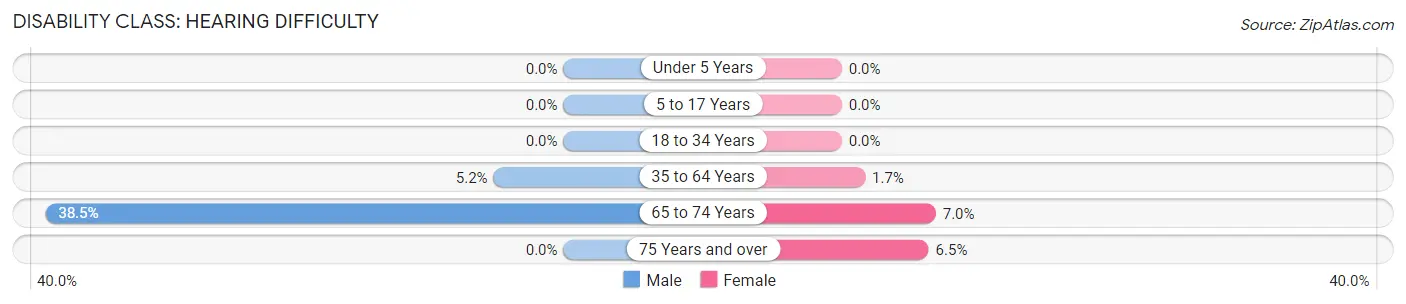
| Age Bracket | Male | Female |
| Under 5 Years | 0 (0.0%) | 0 (0.0%) |
| 5 to 17 Years | 0 (0.0%) | 0 (0.0%) |
| 18 to 34 Years | 0 (0.0%) | 0 (0.0%) |
| 35 to 64 Years | 7 (5.2%) | 3 (1.7%) |
| 65 to 74 Years | 10 (38.5%) | 3 (7.0%) |
| 75 Years and over | 0 (0.0%) | 2 (6.5%) |
Disability Class: Vision Difficulty
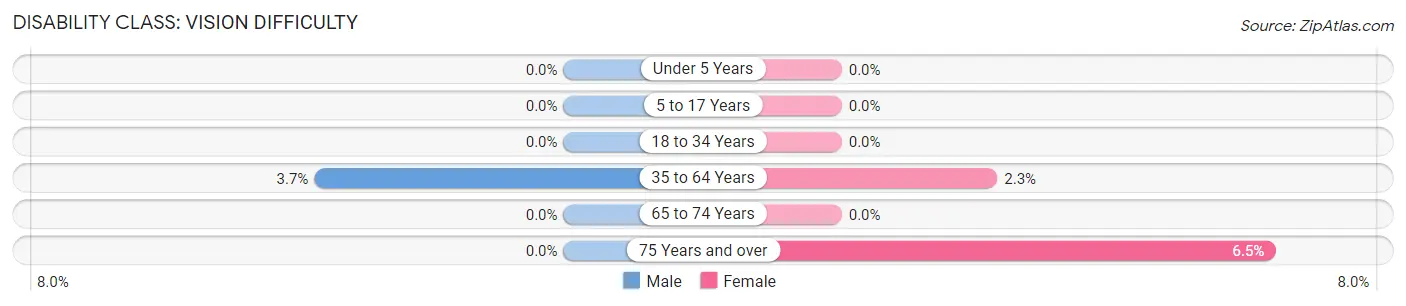
| Age Bracket | Male | Female |
| Under 5 Years | 0 (0.0%) | 0 (0.0%) |
| 5 to 17 Years | 0 (0.0%) | 0 (0.0%) |
| 18 to 34 Years | 0 (0.0%) | 0 (0.0%) |
| 35 to 64 Years | 5 (3.7%) | 4 (2.3%) |
| 65 to 74 Years | 0 (0.0%) | 0 (0.0%) |
| 75 Years and over | 0 (0.0%) | 2 (6.5%) |
Disability Class: Cognitive Difficulty
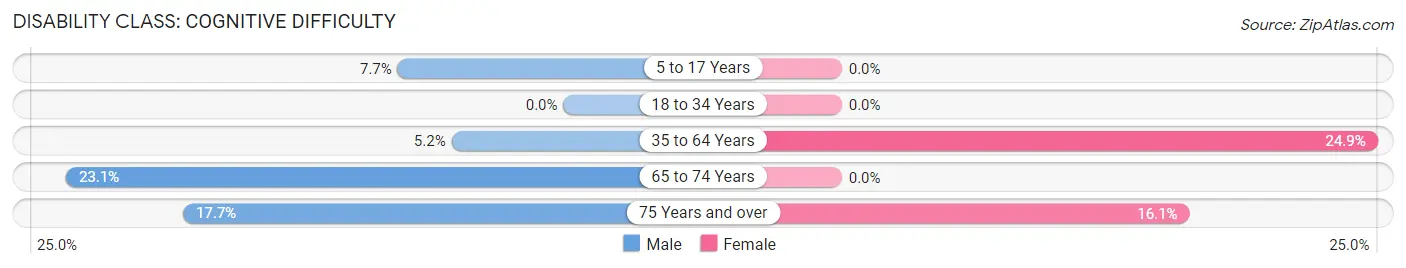
| Age Bracket | Male | Female |
| 5 to 17 Years | 3 (7.7%) | 0 (0.0%) |
| 18 to 34 Years | 0 (0.0%) | 0 (0.0%) |
| 35 to 64 Years | 7 (5.2%) | 43 (24.9%) |
| 65 to 74 Years | 6 (23.1%) | 0 (0.0%) |
| 75 Years and over | 3 (17.6%) | 5 (16.1%) |
Disability Class: Ambulatory Difficulty
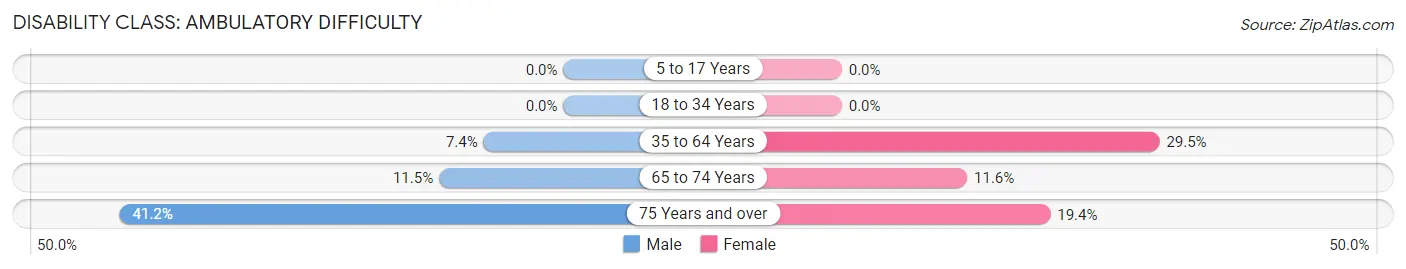
| Age Bracket | Male | Female |
| 5 to 17 Years | 0 (0.0%) | 0 (0.0%) |
| 18 to 34 Years | 0 (0.0%) | 0 (0.0%) |
| 35 to 64 Years | 10 (7.4%) | 51 (29.5%) |
| 65 to 74 Years | 3 (11.5%) | 5 (11.6%) |
| 75 Years and over | 7 (41.2%) | 6 (19.4%) |
Disability Class: Self-Care Difficulty
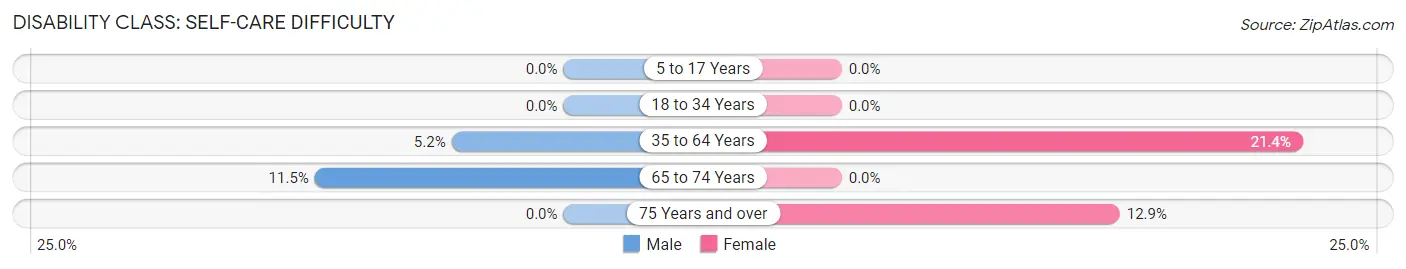
| Age Bracket | Male | Female |
| 5 to 17 Years | 0 (0.0%) | 0 (0.0%) |
| 18 to 34 Years | 0 (0.0%) | 0 (0.0%) |
| 35 to 64 Years | 7 (5.2%) | 37 (21.4%) |
| 65 to 74 Years | 3 (11.5%) | 0 (0.0%) |
| 75 Years and over | 0 (0.0%) | 4 (12.9%) |
Technology Access in Marshall
Computing Device Access in Marshall
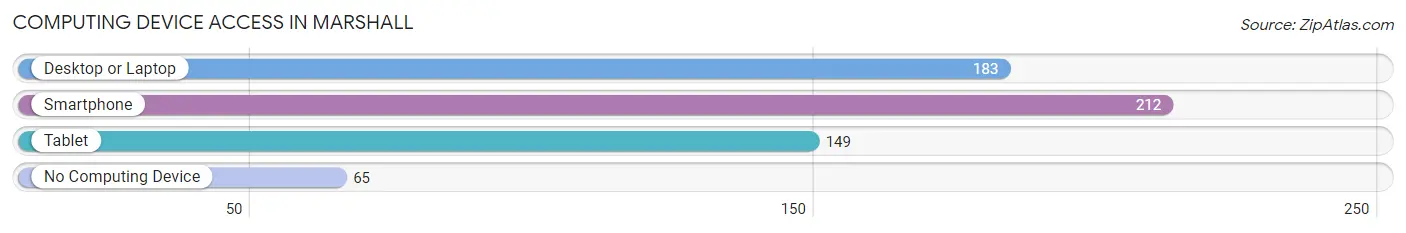
| Device Type | # Households | % Households |
| Desktop or Laptop | 183 | 60.4% |
| Smartphone | 212 | 70.0% |
| Tablet | 149 | 49.2% |
| No Computing Device | 65 | 21.4% |
| Total | 303 | 100.0% |
Internet Access in Marshall
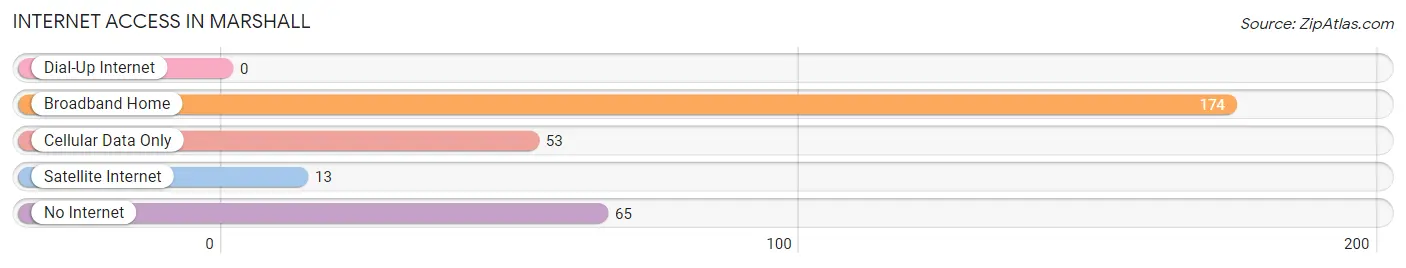
| Internet Type | # Households | % Households |
| Dial-Up Internet | 0 | 0.0% |
| Broadband Home | 174 | 57.4% |
| Cellular Data Only | 53 | 17.5% |
| Satellite Internet | 13 | 4.3% |
| No Internet | 65 | 21.4% |
| Total | 303 | 100.0% |
Marshall Summary
Marshall, North Carolina is a small town located in Madison County, in the western part of the state. It is situated in the Appalachian Mountains, and is surrounded by the Pisgah National Forest. The town has a population of approximately 890 people, and is the county seat of Madison County.
History
Marshall was founded in 1851, and was named after Chief Justice John Marshall of the United States Supreme Court. The town was originally a small farming community, and was home to a number of small businesses. In the late 19th century, Marshall became a popular tourist destination due to its proximity to the nearby Hot Springs. The town was also home to a number of resorts, which attracted visitors from all over the country.
In the early 20th century, Marshall began to experience a period of growth and development. The town was incorporated in 1911, and the first mayor was elected in 1912. During this time, the town saw the construction of a number of new buildings, including a courthouse, a post office, and a number of churches.
Geography
Marshall is located in the Appalachian Mountains, and is surrounded by the Pisgah National Forest. The town is situated at an elevation of 2,000 feet, and is located at the intersection of US Highway 25 and NC Highway 213. The town is located approximately 25 miles north of Asheville, and is approximately 75 miles east of Knoxville, Tennessee.
The town is located in a temperate climate, and experiences four distinct seasons. Summers are typically hot and humid, while winters are cold and wet. The average annual temperature is around 57 degrees Fahrenheit, and the average annual precipitation is around 45 inches.
Economy
Marshall’s economy is largely based on tourism and agriculture. The town is home to a number of small businesses, including restaurants, shops, and galleries. The town is also home to a number of farms, which produce a variety of crops, including corn, soybeans, and hay.
The town is also home to a number of manufacturing companies, which produce a variety of products, including furniture, textiles, and automotive parts. The town is also home to a number of service-based businesses, including banks, insurance companies, and real estate agencies.
Demographics
As of the 2010 census, the population of Marshall was 890 people. The racial makeup of the town was 95.2% White, 1.7% African American, 0.3% Native American, 0.7% Asian, 0.1% Pacific Islander, and 1.9% from other races. The median household income was $35,000, and the median family income was $41,000.
The town is home to a number of churches, including Baptist, Methodist, Presbyterian, and Catholic. The town is also home to a number of schools, including a public elementary school, a middle school, and a high school. The town is also home to a number of parks, including a community park, a nature center, and a golf course.
Common Questions
What is Per Capita Income in Marshall?
Per Capita income in Marshall is $32,132.
What is the Median Family Income in Marshall?
Median Family Income in Marshall is $83,125.
What is the Median Household income in Marshall?
Median Household Income in Marshall is $49,712.
What is Income or Wage Gap in Marshall?
Income or Wage Gap in Marshall is 33.3%.
Women in Marshall earn 66.7 cents for every dollar earned by a man.
What is Inequality or Gini Index in Marshall?
Inequality or Gini Index in Marshall is 0.44.
What is the Total Population of Marshall?
Total Population of Marshall is 616.
What is the Total Male Population of Marshall?
Total Male Population of Marshall is 297.
What is the Total Female Population of Marshall?
Total Female Population of Marshall is 319.
What is the Ratio of Males per 100 Females in Marshall?
There are 93.10 Males per 100 Females in Marshall.
What is the Ratio of Females per 100 Males in Marshall?
There are 107.41 Females per 100 Males in Marshall.
What is the Median Population Age in Marshall?
Median Population Age in Marshall is 41.8 Years.
What is the Average Family Size in Marshall
Average Family Size in Marshall is 2.5 People.
What is the Average Household Size in Marshall
Average Household Size in Marshall is 1.8 People.
How Large is the Labor Force in Marshall?
There are 319 People in the Labor Forcein in Marshall.
What is the Percentage of People in the Labor Force in Marshall?
59.0% of People are in the Labor Force in Marshall.
What is the Unemployment Rate in Marshall?
Unemployment Rate in Marshall is 1.4%.