Vass, NC Map & Demographics
Vass Map
Vass Overview
$26,973
PER CAPITA INCOME
$77,083
AVG FAMILY INCOME
$59,375
AVG HOUSEHOLD INCOME
19.6%
WAGE / INCOME GAP [ % ]
80.4¢/ $1
WAGE / INCOME GAP [ $ ]
$8,016
FAMILY INCOME DEFICIT
0.39
INEQUALITY / GINI INDEX
1,276
TOTAL POPULATION
678
MALE POPULATION
598
FEMALE POPULATION
113.38
MALES / 100 FEMALES
88.20
FEMALES / 100 MALES
29.0
MEDIAN AGE
4.2
AVG FAMILY SIZE
3.2
AVG HOUSEHOLD SIZE
573
LABOR FORCE [ PEOPLE ]
73.9%
PERCENT IN LABOR FORCE
2.3%
UNEMPLOYMENT RATE
Vass Zip Codes
Vass Area Codes
Income in Vass
Income Overview in Vass
Per Capita Income in Vass is $26,973, while median incomes of families and households are $77,083 and $59,375 respectively.
| Characteristic | Number | Measure |
| Per Capita Income | 1,276 | $26,973 |
| Median Family Income | 251 | $77,083 |
| Mean Family Income | 251 | $92,054 |
| Median Household Income | 398 | $59,375 |
| Mean Household Income | 398 | $77,502 |
| Income Deficit | 251 | $8,016 |
| Wage / Income Gap (%) | 1,276 | 19.59% |
| Wage / Income Gap ($) | 1,276 | 80.41¢ per $1 |
| Gini / Inequality Index | 1,276 | 0.39 |
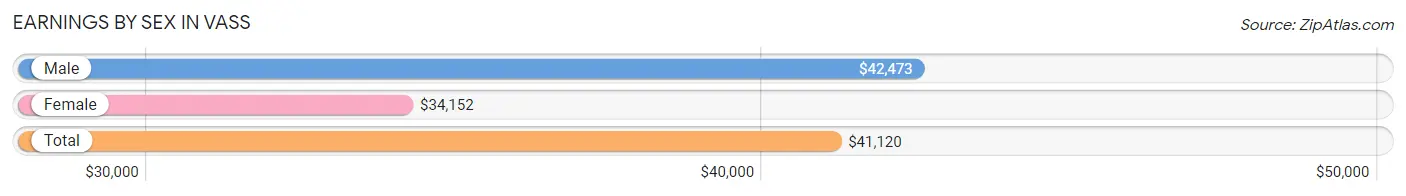
Earnings by Sex in Vass
Average Earnings in Vass are $41,120, $42,473 for men and $34,152 for women, a difference of 19.6%.
| Sex | Number | Average Earnings |
| Male | 298 (51.9%) | $42,473 |
| Female | 276 (48.1%) | $34,152 |
| Total | 574 (100.0%) | $41,120 |
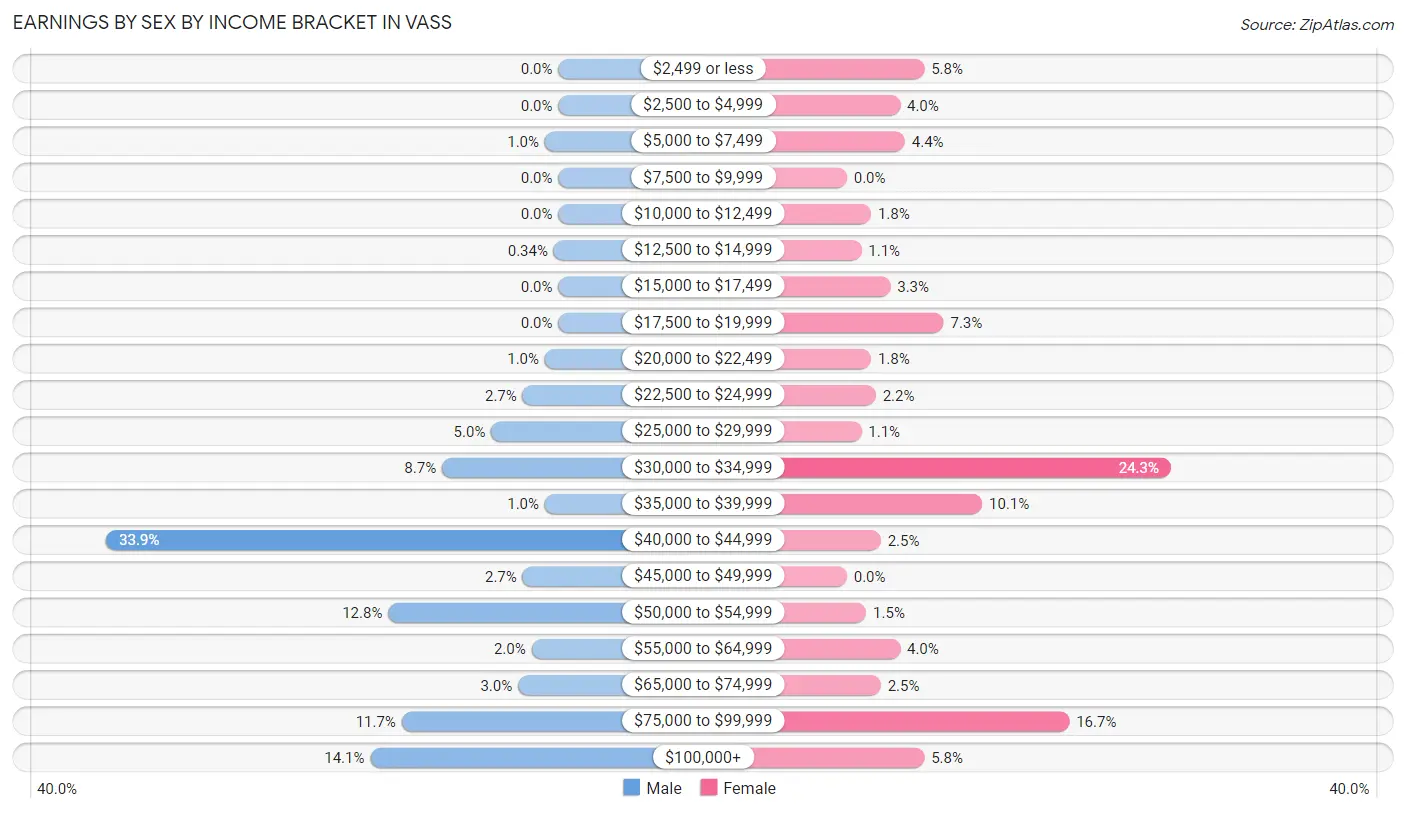
Earnings by Sex by Income Bracket in Vass
The most common earnings brackets in Vass are $40,000 to $44,999 for men (101 | 33.9%) and $30,000 to $34,999 for women (67 | 24.3%).
| Income | Male | Female |
| $2,499 or less | 0 (0.0%) | 16 (5.8%) |
| $2,500 to $4,999 | 0 (0.0%) | 11 (4.0%) |
| $5,000 to $7,499 | 3 (1.0%) | 12 (4.3%) |
| $7,500 to $9,999 | 0 (0.0%) | 0 (0.0%) |
| $10,000 to $12,499 | 0 (0.0%) | 5 (1.8%) |
| $12,500 to $14,999 | 1 (0.3%) | 3 (1.1%) |
| $15,000 to $17,499 | 0 (0.0%) | 9 (3.3%) |
| $17,500 to $19,999 | 0 (0.0%) | 20 (7.2%) |
| $20,000 to $22,499 | 3 (1.0%) | 5 (1.8%) |
| $22,500 to $24,999 | 8 (2.7%) | 6 (2.2%) |
| $25,000 to $29,999 | 15 (5.0%) | 3 (1.1%) |
| $30,000 to $34,999 | 26 (8.7%) | 67 (24.3%) |
| $35,000 to $39,999 | 3 (1.0%) | 28 (10.1%) |
| $40,000 to $44,999 | 101 (33.9%) | 7 (2.5%) |
| $45,000 to $49,999 | 8 (2.7%) | 0 (0.0%) |
| $50,000 to $54,999 | 38 (12.8%) | 4 (1.5%) |
| $55,000 to $64,999 | 6 (2.0%) | 11 (4.0%) |
| $65,000 to $74,999 | 9 (3.0%) | 7 (2.5%) |
| $75,000 to $99,999 | 35 (11.7%) | 46 (16.7%) |
| $100,000+ | 42 (14.1%) | 16 (5.8%) |
| Total | 298 (100.0%) | 276 (100.0%) |
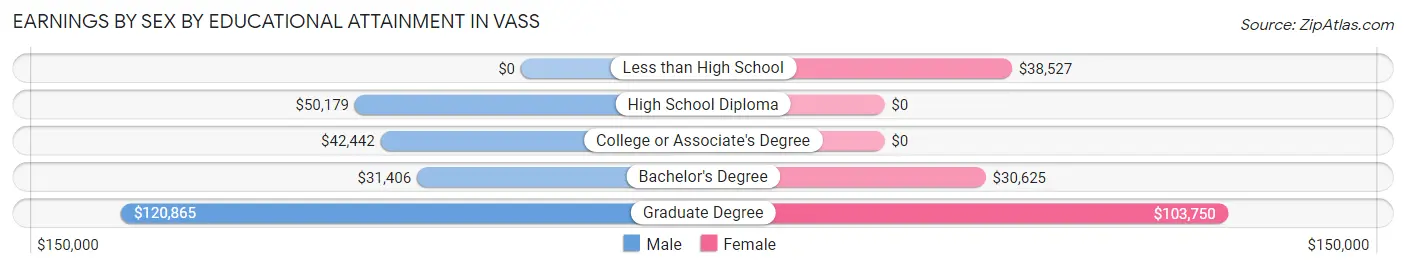
Earnings by Sex by Educational Attainment in Vass
Average earnings in Vass are $43,500 for men and $39,196 for women, a difference of 9.9%. Men with an educational attainment of graduate degree enjoy the highest average annual earnings of $120,865, while those with bachelor's degree education earn the least with $31,406. Women with an educational attainment of graduate degree earn the most with the average annual earnings of $103,750, while those with bachelor's degree education have the smallest earnings of $30,625.
| Educational Attainment | Male Income | Female Income |
| Less than High School | - | - |
| High School Diploma | $50,179 | $0 |
| College or Associate's Degree | $42,442 | $0 |
| Bachelor's Degree | $31,406 | $30,625 |
| Graduate Degree | $120,865 | $103,750 |
| Total | $43,500 | $39,196 |
Family Income in Vass
Family Income Brackets in Vass
According to the Vass family income data, there are 58 families falling into the $100,000 to $149,999 income range, which is the most common income bracket and makes up 23.1% of all families. Conversely, the less than $10,000 income bracket is the least frequent group with only 6 families (2.4%) belonging to this category.
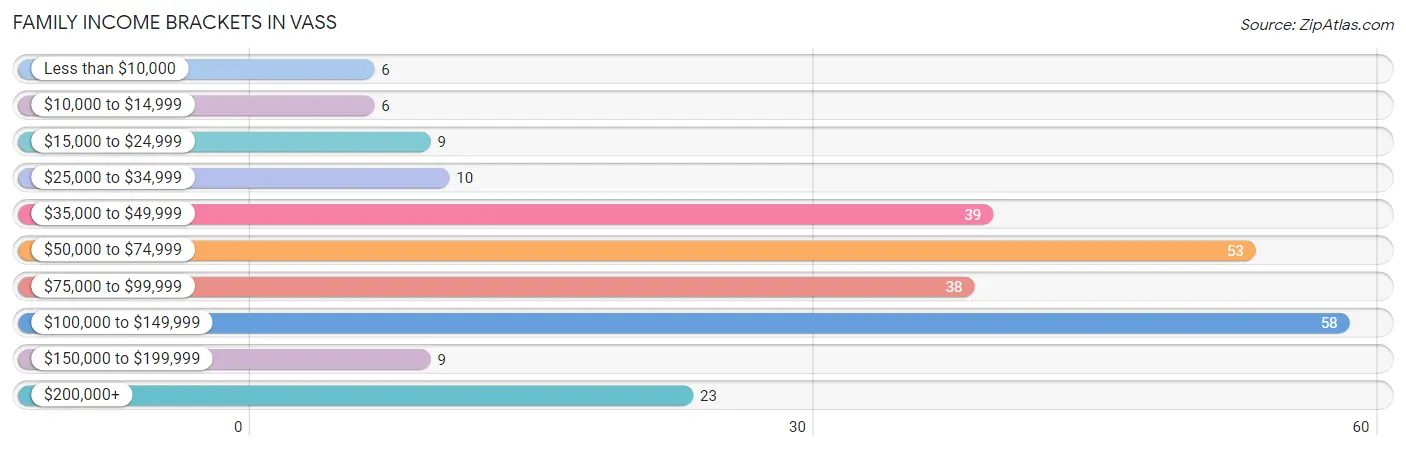
| Income Bracket | # Families | % Families |
| Less than $10,000 | 6 | 2.4% |
| $10,000 to $14,999 | 6 | 2.4% |
| $15,000 to $24,999 | 9 | 3.6% |
| $25,000 to $34,999 | 10 | 4.0% |
| $35,000 to $49,999 | 39 | 15.5% |
| $50,000 to $74,999 | 53 | 21.1% |
| $75,000 to $99,999 | 38 | 15.1% |
| $100,000 to $149,999 | 58 | 23.1% |
| $150,000 to $199,999 | 9 | 3.6% |
| $200,000+ | 23 | 9.2% |
Family Income by Famaliy Size in Vass
5-person families (14 | 5.6%) account for the highest median family income in Vass with $132,188 per family, while 2-person families (109 | 43.4%) have the highest median income of $29,910 per family member.
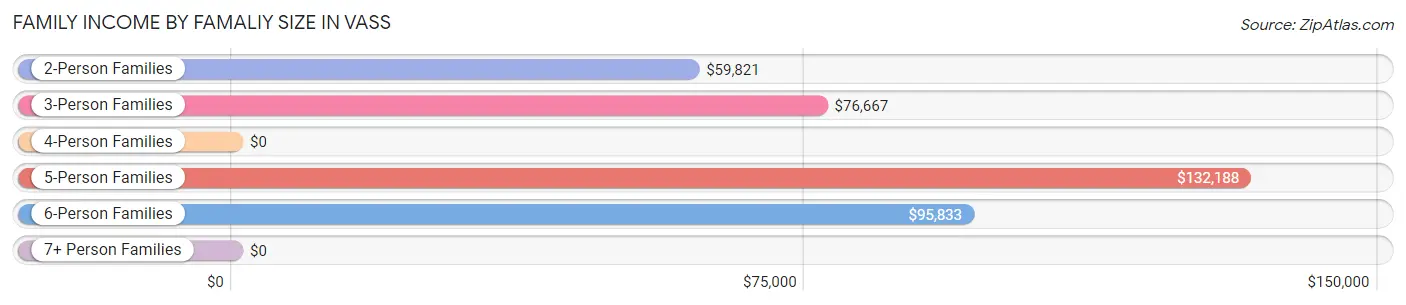
| Income Bracket | # Families | Median Income |
| 2-Person Families | 109 (43.4%) | $59,821 |
| 3-Person Families | 8 (3.2%) | $76,667 |
| 4-Person Families | 109 (43.4%) | $0 |
| 5-Person Families | 14 (5.6%) | $132,188 |
| 6-Person Families | 10 (4.0%) | $95,833 |
| 7+ Person Families | 1 (0.4%) | $0 |
| Total | 251 (100.0%) | $77,083 |
Family Income by Number of Earners in Vass
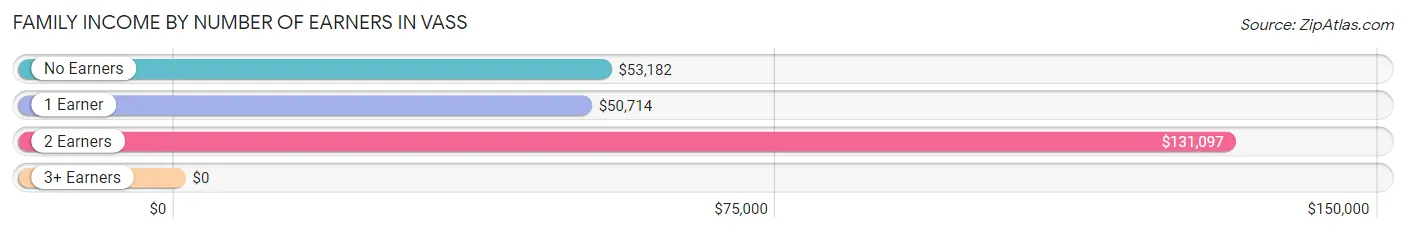
| Number of Earners | # Families | Median Income |
| No Earners | 38 (15.1%) | $53,182 |
| 1 Earner | 90 (35.9%) | $50,714 |
| 2 Earners | 107 (42.6%) | $131,097 |
| 3+ Earners | 16 (6.4%) | $0 |
| Total | 251 (100.0%) | $77,083 |
Household Income in Vass
Household Income Brackets in Vass
With 76 households falling in the category, the $50,000 to $74,999 income range is the most frequent in Vass, accounting for 19.1% of all households. In contrast, only 6 households (1.5%) fall into the less than $10,000 income bracket, making it the least populous group.
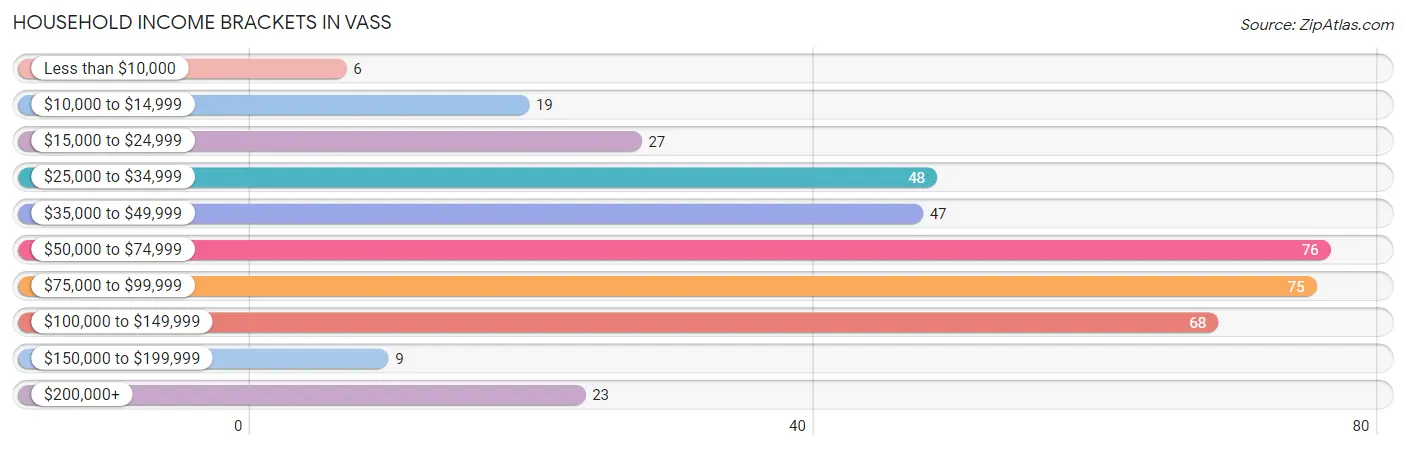
| Income Bracket | # Households | % Households |
| Less than $10,000 | 6 | 1.5% |
| $10,000 to $14,999 | 19 | 4.8% |
| $15,000 to $24,999 | 27 | 6.8% |
| $25,000 to $34,999 | 48 | 12.1% |
| $35,000 to $49,999 | 47 | 11.8% |
| $50,000 to $74,999 | 76 | 19.1% |
| $75,000 to $99,999 | 75 | 18.8% |
| $100,000 to $149,999 | 68 | 17.1% |
| $150,000 to $199,999 | 9 | 2.3% |
| $200,000+ | 23 | 5.8% |
Household Income by Householder Age in Vass
The median household income in Vass is $59,375, with the highest median household income of $80,833 found in the 25 to 44 years age bracket for the primary householder. A total of 226 households (56.8%) fall into this category. Meanwhile, the 15 to 24 years age bracket for the primary householder has the lowest median household income of $0, with 11 households (2.8%) in this group.
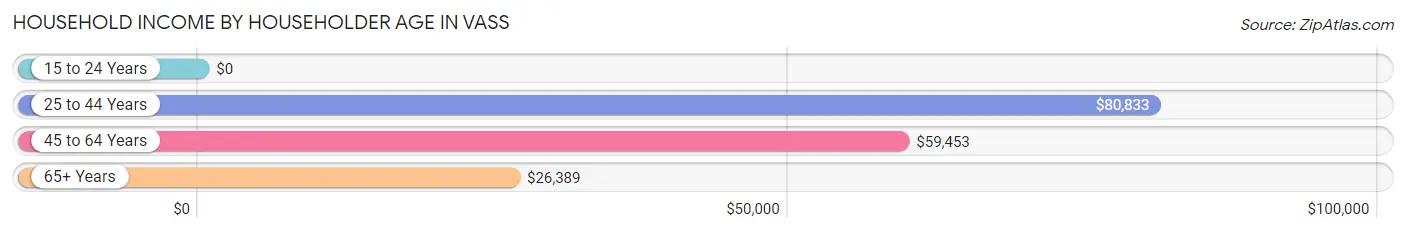
| Income Bracket | # Households | Median Income |
| 15 to 24 Years | 11 (2.8%) | $0 |
| 25 to 44 Years | 226 (56.8%) | $80,833 |
| 45 to 64 Years | 77 (19.4%) | $59,453 |
| 65+ Years | 84 (21.1%) | $26,389 |
| Total | 398 (100.0%) | $59,375 |
Poverty in Vass
Income Below Poverty by Sex and Age in Vass
With 3.5% poverty level for males and 8.2% for females among the residents of Vass, 75 year old and over males and 75 year old and over females are the most vulnerable to poverty, with 10 males (55.6%) and 19 females (54.3%) in their respective age groups living below the poverty level.
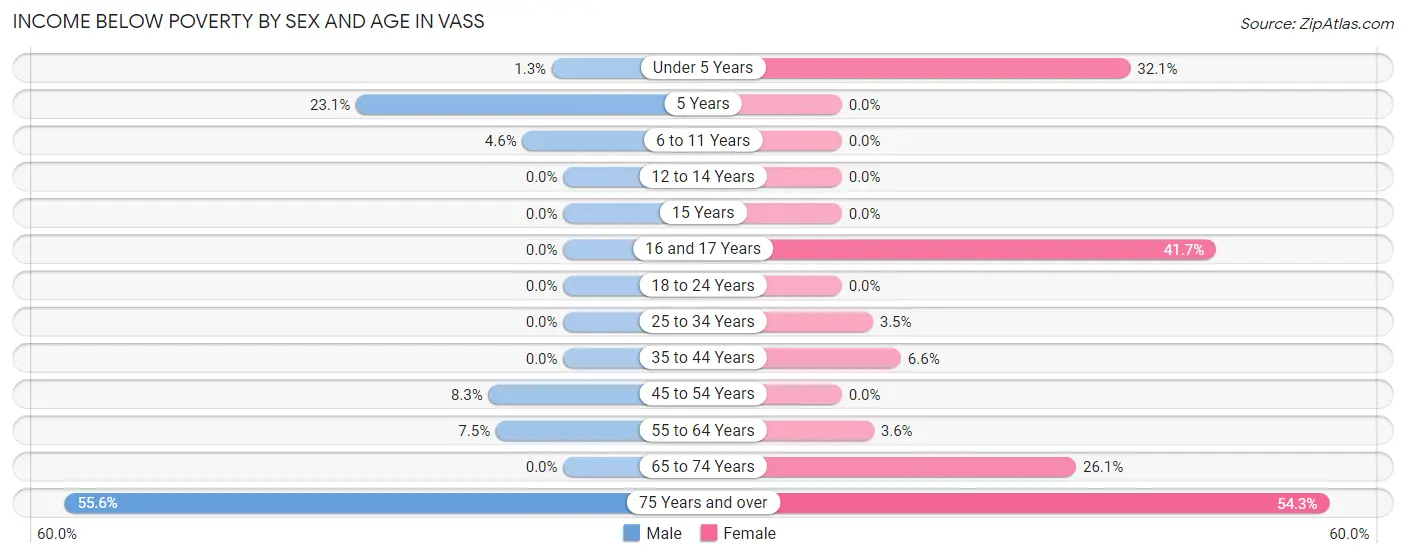
| Age Bracket | Male | Female |
| Under 5 Years | 2 (1.3%) | 9 (32.1%) |
| 5 Years | 3 (23.1%) | 0 (0.0%) |
| 6 to 11 Years | 4 (4.5%) | 0 (0.0%) |
| 12 to 14 Years | 0 (0.0%) | 0 (0.0%) |
| 15 Years | 0 (0.0%) | 0 (0.0%) |
| 16 and 17 Years | 0 (0.0%) | 5 (41.7%) |
| 18 to 24 Years | 0 (0.0%) | 0 (0.0%) |
| 25 to 34 Years | 0 (0.0%) | 3 (3.5%) |
| 35 to 44 Years | 0 (0.0%) | 5 (6.6%) |
| 45 to 54 Years | 2 (8.3%) | 0 (0.0%) |
| 55 to 64 Years | 3 (7.5%) | 2 (3.6%) |
| 65 to 74 Years | 0 (0.0%) | 6 (26.1%) |
| 75 Years and over | 10 (55.6%) | 19 (54.3%) |
| Total | 24 (3.5%) | 49 (8.2%) |
Income Above Poverty by Sex and Age in Vass
According to the poverty statistics in Vass, males aged 15 years and females aged 5 years are the age groups that are most secure financially, with 100.0% of males and 100.0% of females in these age groups living above the poverty line.
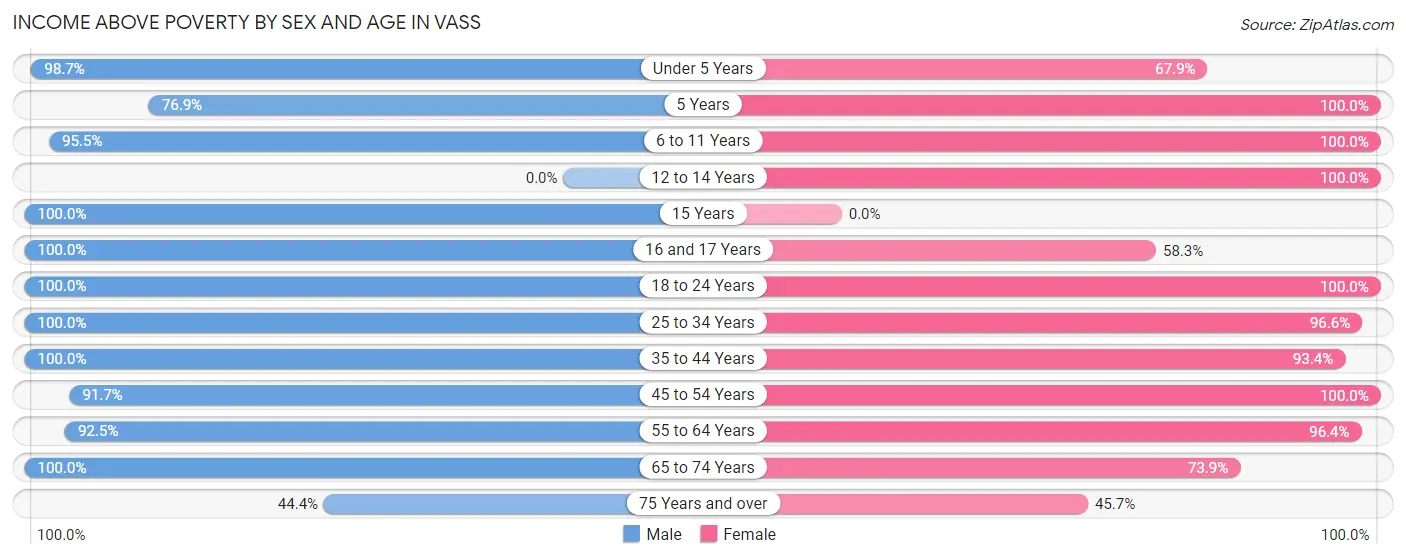
| Age Bracket | Male | Female |
| Under 5 Years | 156 (98.7%) | 19 (67.9%) |
| 5 Years | 10 (76.9%) | 3 (100.0%) |
| 6 to 11 Years | 84 (95.5%) | 161 (100.0%) |
| 12 to 14 Years | 0 (0.0%) | 15 (100.0%) |
| 15 Years | 35 (100.0%) | 0 (0.0%) |
| 16 and 17 Years | 7 (100.0%) | 7 (58.3%) |
| 18 to 24 Years | 15 (100.0%) | 69 (100.0%) |
| 25 to 34 Years | 84 (100.0%) | 84 (96.6%) |
| 35 to 44 Years | 148 (100.0%) | 71 (93.4%) |
| 45 to 54 Years | 22 (91.7%) | 33 (100.0%) |
| 55 to 64 Years | 37 (92.5%) | 54 (96.4%) |
| 65 to 74 Years | 48 (100.0%) | 17 (73.9%) |
| 75 Years and over | 8 (44.4%) | 16 (45.7%) |
| Total | 654 (96.5%) | 549 (91.8%) |
Income Below Poverty Among Married-Couple Families in Vass
The poverty statistics for married-couple families in Vass show that 5.3% or 10 of the total 190 families live below the poverty line. Families with no children have the highest poverty rate of 10.9%, comprising of 10 families. On the other hand, families with 1 or 2 children have the lowest poverty rate of 0.0%, which includes 0 families.
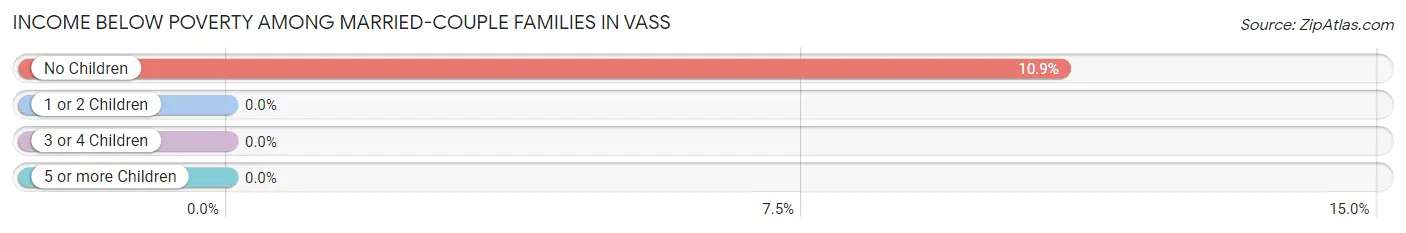
| Children | Above Poverty | Below Poverty |
| No Children | 82 (89.1%) | 10 (10.9%) |
| 1 or 2 Children | 83 (100.0%) | 0 (0.0%) |
| 3 or 4 Children | 15 (100.0%) | 0 (0.0%) |
| 5 or more Children | 0 (0.0%) | 0 (0.0%) |
| Total | 180 (94.7%) | 10 (5.3%) |
Income Below Poverty Among Single-Parent Households in Vass
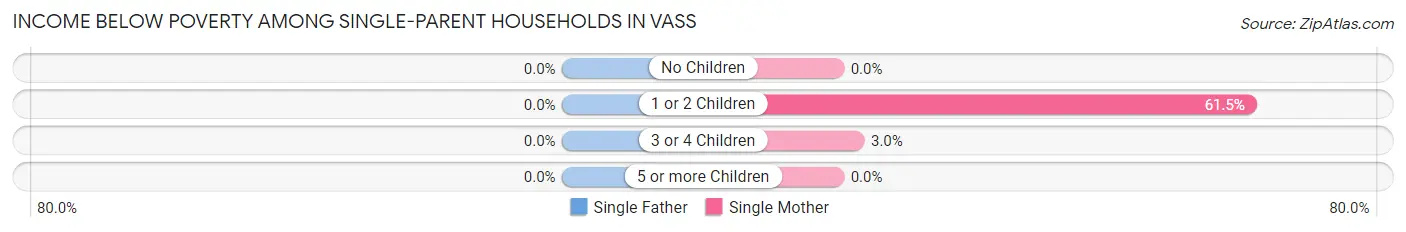
| Children | Single Father | Single Mother |
| No Children | 0 (0.0%) | 0 (0.0%) |
| 1 or 2 Children | 0 (0.0%) | 8 (61.5%) |
| 3 or 4 Children | 0 (0.0%) | 1 (3.0%) |
| 5 or more Children | 0 (0.0%) | 0 (0.0%) |
| Total | 0 (0.0%) | 9 (14.7%) |
Income Below Poverty Among Married-Couple vs Single-Parent Households in Vass
The poverty data for Vass shows that 10 of the married-couple family households (5.3%) and 9 of the single-parent households (14.7%) are living below the poverty level. Within the married-couple family households, those with no children have the highest poverty rate, with 10 households (10.9%) falling below the poverty line. Among the single-parent households, those with 1 or 2 children have the highest poverty rate, with 8 household (61.5%) living below poverty.
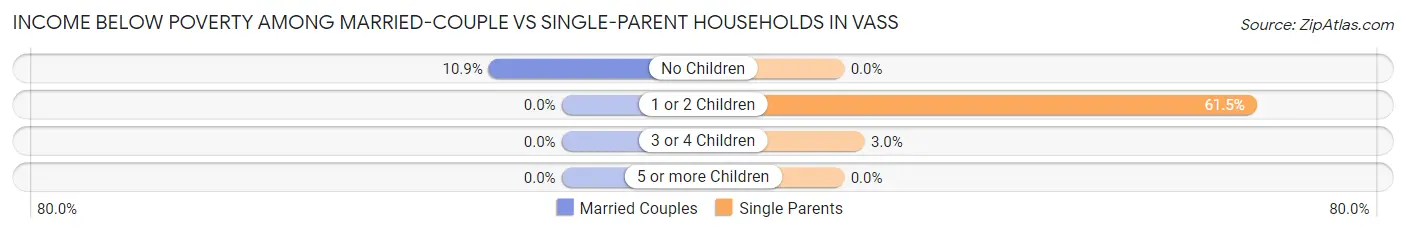
| Children | Married-Couple Families | Single-Parent Households |
| No Children | 10 (10.9%) | 0 (0.0%) |
| 1 or 2 Children | 0 (0.0%) | 8 (61.5%) |
| 3 or 4 Children | 0 (0.0%) | 1 (3.0%) |
| 5 or more Children | 0 (0.0%) | 0 (0.0%) |
| Total | 10 (5.3%) | 9 (14.7%) |
Race in Vass
The most populous races in Vass are White / Caucasian (637 | 49.9%), Black / African American (328 | 25.7%), and Two or more Races (299 | 23.4%).
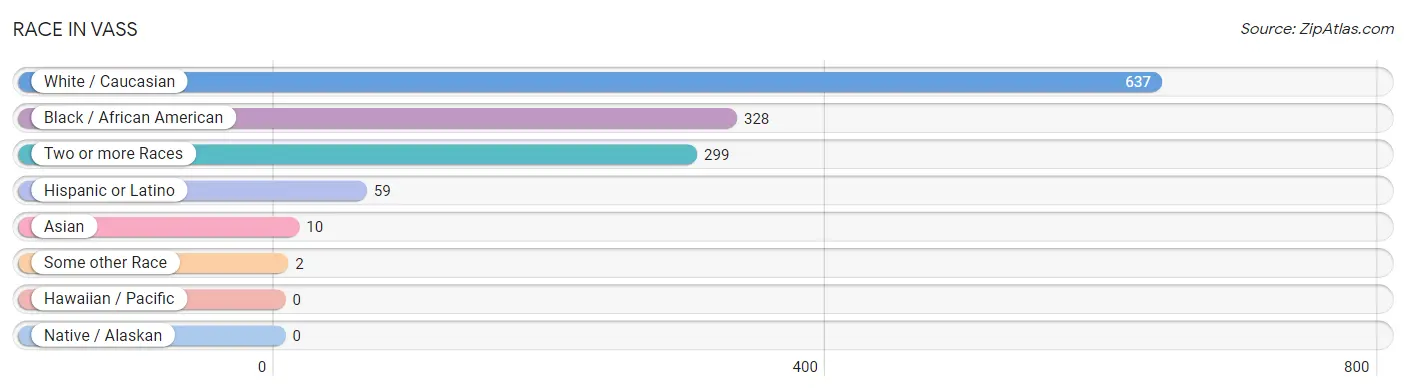
| Race | # Population | % Population |
| Asian | 10 | 0.8% |
| Black / African American | 328 | 25.7% |
| Hawaiian / Pacific | 0 | 0.0% |
| Hispanic or Latino | 59 | 4.6% |
| Native / Alaskan | 0 | 0.0% |
| White / Caucasian | 637 | 49.9% |
| Two or more Races | 299 | 23.4% |
| Some other Race | 2 | 0.2% |
| Total | 1,276 | 100.0% |
Ancestry in Vass
The most populous ancestries reported in Vass are English (143 | 11.2%), Irish (95 | 7.4%), German (66 | 5.2%), Italian (53 | 4.2%), and Mexican (44 | 3.5%), together accounting for 31.4% of all Vass residents.
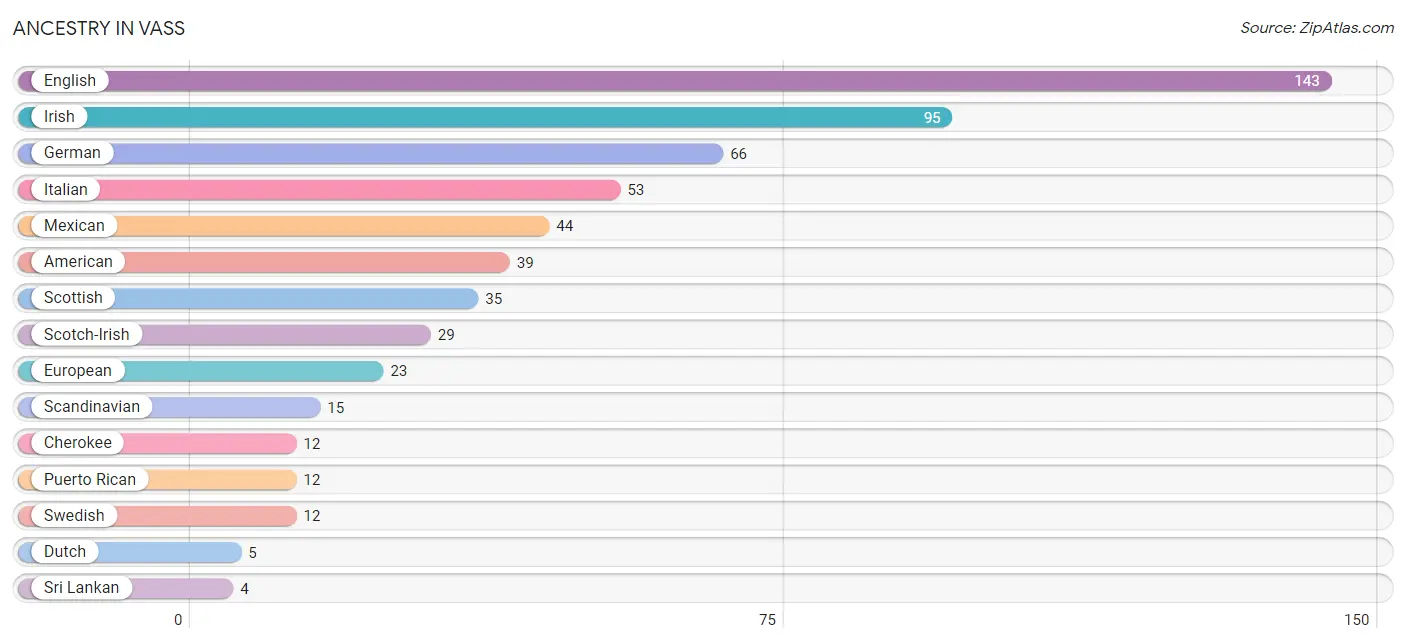
| Ancestry | # Population | % Population |
| American | 39 | 3.1% |
| Burmese | 3 | 0.2% |
| Canadian | 3 | 0.2% |
| Cherokee | 12 | 0.9% |
| Dutch | 5 | 0.4% |
| English | 143 | 11.2% |
| European | 23 | 1.8% |
| French | 2 | 0.2% |
| German | 66 | 5.2% |
| Irish | 95 | 7.4% |
| Italian | 53 | 4.2% |
| Lumbee | 3 | 0.2% |
| Mexican | 44 | 3.5% |
| Norwegian | 2 | 0.2% |
| Puerto Rican | 12 | 0.9% |
| Scandinavian | 15 | 1.2% |
| Scotch-Irish | 29 | 2.3% |
| Scottish | 35 | 2.7% |
| Sri Lankan | 4 | 0.3% |
| Swedish | 12 | 0.9% |
| Thai | 3 | 0.2% | View All 21 Rows |
Immigrants in Vass
The most numerous immigrant groups reported in Vass came from Central America (10 | 0.8%), Latin America (10 | 0.8%), Mexico (10 | 0.8%), Asia (6 | 0.5%), and Eastern Asia (3 | 0.2%), together accounting for 3.0% of all Vass residents.
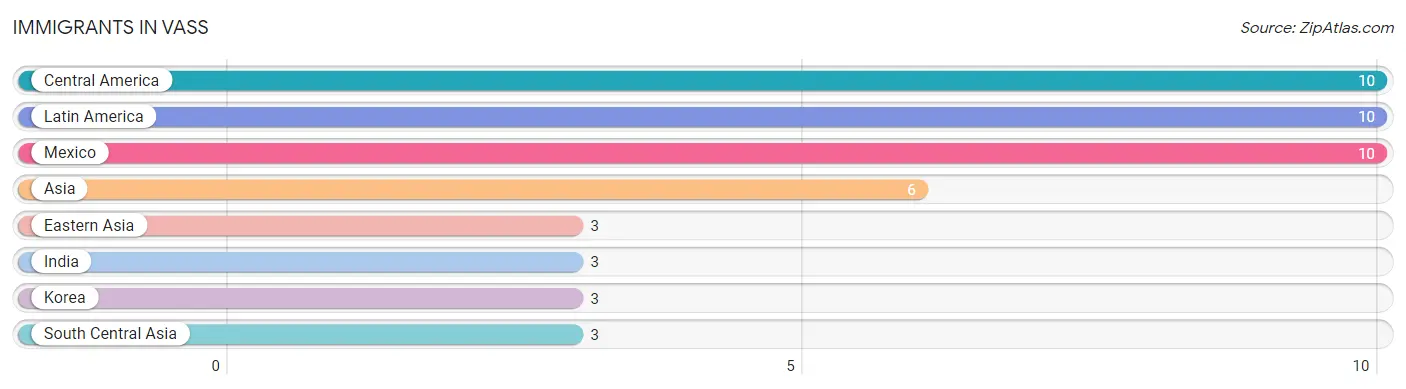
| Immigration Origin | # Population | % Population |
| Asia | 6 | 0.5% |
| Central America | 10 | 0.8% |
| Eastern Asia | 3 | 0.2% |
| India | 3 | 0.2% |
| Korea | 3 | 0.2% |
| Latin America | 10 | 0.8% |
| Mexico | 10 | 0.8% |
| South Central Asia | 3 | 0.2% | View All 8 Rows |
Sex and Age in Vass
Sex and Age in Vass
The most populous age groups in Vass are Under 5 Years (158 | 23.3%) for men and 10 to 14 Years (153 | 25.6%) for women.
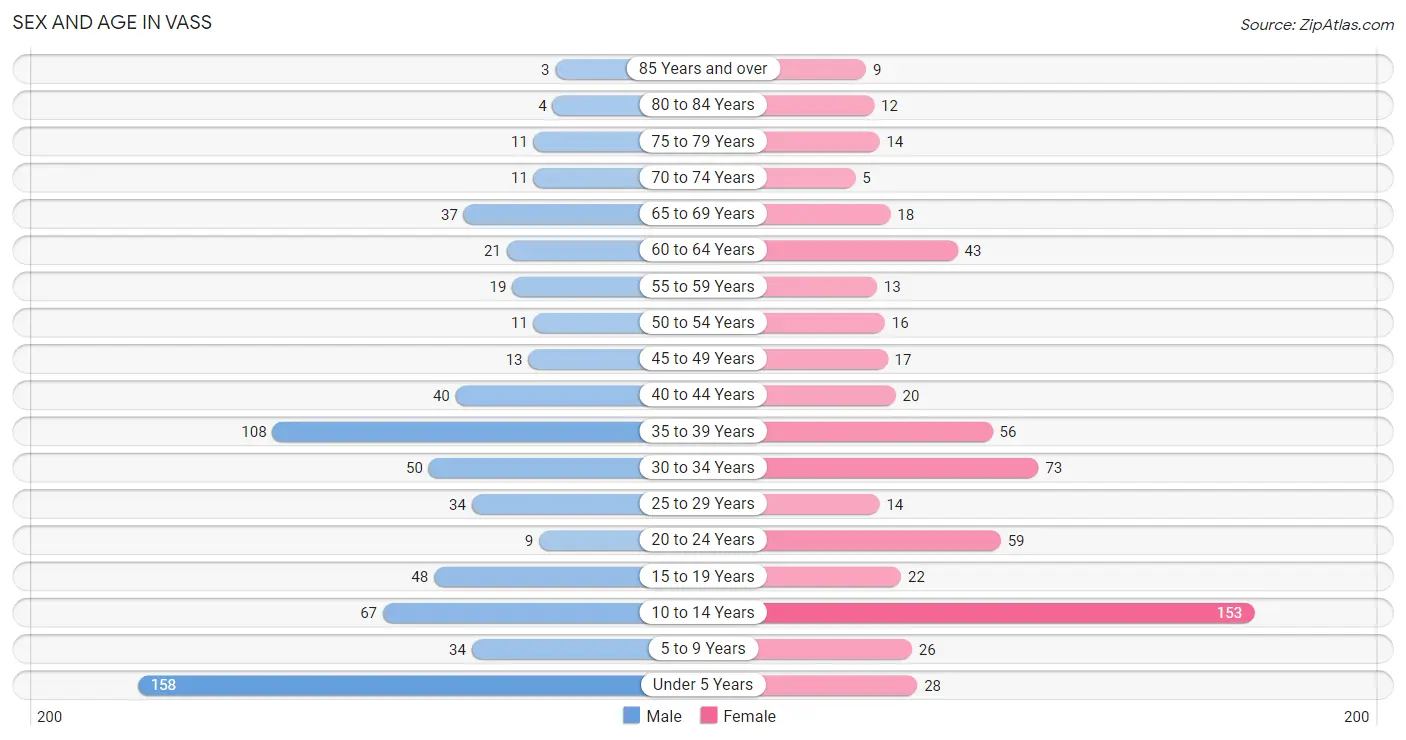
| Age Bracket | Male | Female |
| Under 5 Years | 158 (23.3%) | 28 (4.7%) |
| 5 to 9 Years | 34 (5.0%) | 26 (4.3%) |
| 10 to 14 Years | 67 (9.9%) | 153 (25.6%) |
| 15 to 19 Years | 48 (7.1%) | 22 (3.7%) |
| 20 to 24 Years | 9 (1.3%) | 59 (9.9%) |
| 25 to 29 Years | 34 (5.0%) | 14 (2.3%) |
| 30 to 34 Years | 50 (7.4%) | 73 (12.2%) |
| 35 to 39 Years | 108 (15.9%) | 56 (9.4%) |
| 40 to 44 Years | 40 (5.9%) | 20 (3.3%) |
| 45 to 49 Years | 13 (1.9%) | 17 (2.8%) |
| 50 to 54 Years | 11 (1.6%) | 16 (2.7%) |
| 55 to 59 Years | 19 (2.8%) | 13 (2.2%) |
| 60 to 64 Years | 21 (3.1%) | 43 (7.2%) |
| 65 to 69 Years | 37 (5.5%) | 18 (3.0%) |
| 70 to 74 Years | 11 (1.6%) | 5 (0.8%) |
| 75 to 79 Years | 11 (1.6%) | 14 (2.3%) |
| 80 to 84 Years | 4 (0.6%) | 12 (2.0%) |
| 85 Years and over | 3 (0.4%) | 9 (1.5%) |
| Total | 678 (100.0%) | 598 (100.0%) |
Families and Households in Vass
Median Family Size in Vass
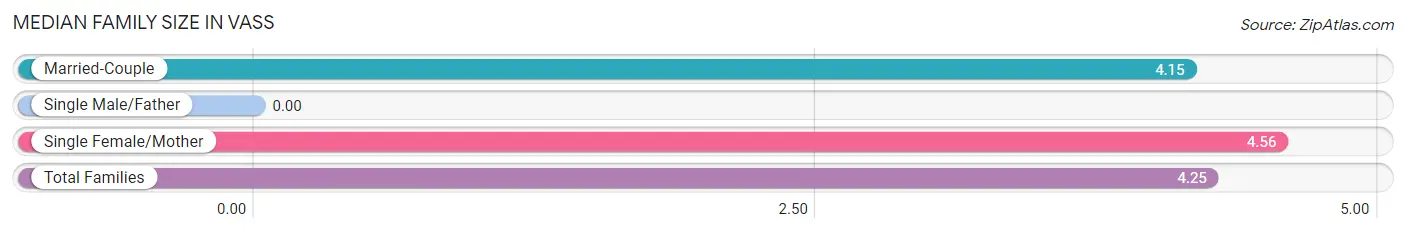
| Family Type | # Families | Family Size |
| Married-Couple | 190 (75.7%) | 4.15 |
| Single Male/Father | 0 (0.0%) | - |
| Single Female/Mother | 61 (24.3%) | 4.56 |
| Total Families | 251 (100.0%) | 4.25 |
Median Household Size in Vass
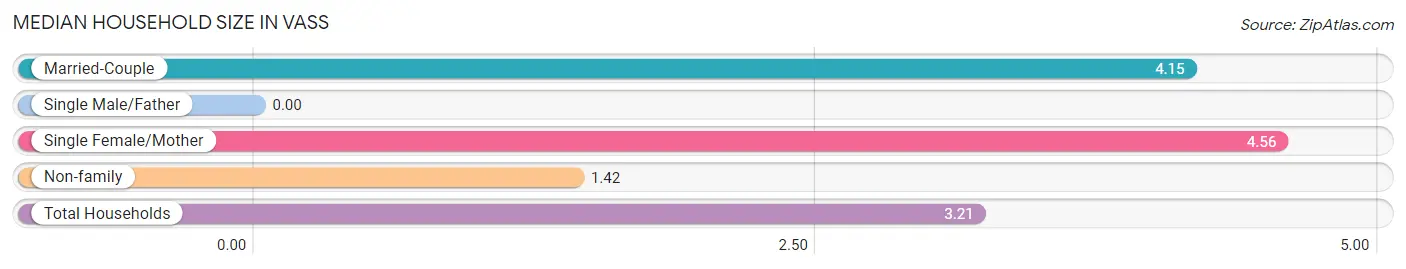
| Household Type | # Households | Household Size |
| Married-Couple | 190 (47.7%) | 4.15 |
| Single Male/Father | 0 (0.0%) | - |
| Single Female/Mother | 61 (15.3%) | 4.56 |
| Non-family | 147 (36.9%) | 1.42 |
| Total Households | 398 (100.0%) | 3.21 |
Household Size by Marriage Status in Vass
Out of a total of 398 households in Vass, 251 (63.1%) are family households, while 147 (36.9%) are nonfamily households. The most numerous type of family households are 2-person households, comprising 109, and the most common type of nonfamily households are 1-person households, comprising 118.
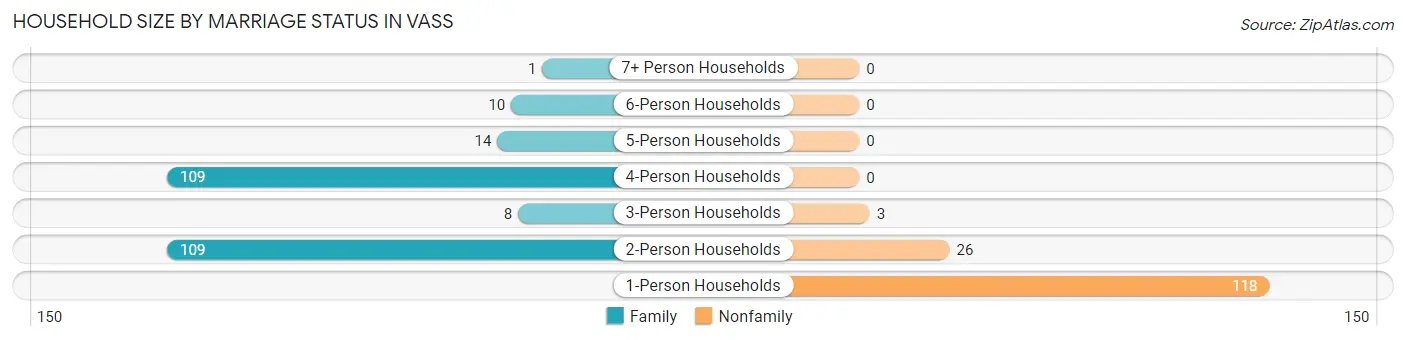
| Household Size | Family Households | Nonfamily Households |
| 1-Person Households | - | 118 (29.6%) |
| 2-Person Households | 109 (27.4%) | 26 (6.5%) |
| 3-Person Households | 8 (2.0%) | 3 (0.7%) |
| 4-Person Households | 109 (27.4%) | 0 (0.0%) |
| 5-Person Households | 14 (3.5%) | 0 (0.0%) |
| 6-Person Households | 10 (2.5%) | 0 (0.0%) |
| 7+ Person Households | 1 (0.3%) | 0 (0.0%) |
| Total | 251 (63.1%) | 147 (36.9%) |
Female Fertility in Vass
Fertility by Age in Vass
Average fertility rate in Vass is 96.0 births per 1,000 women. Women in the age bracket of 20 to 34 years have the highest fertility rate with 144.0 births per 1,000 women. Women in the age bracket of 20 to 34 years acount for 84.0% of all women with births.
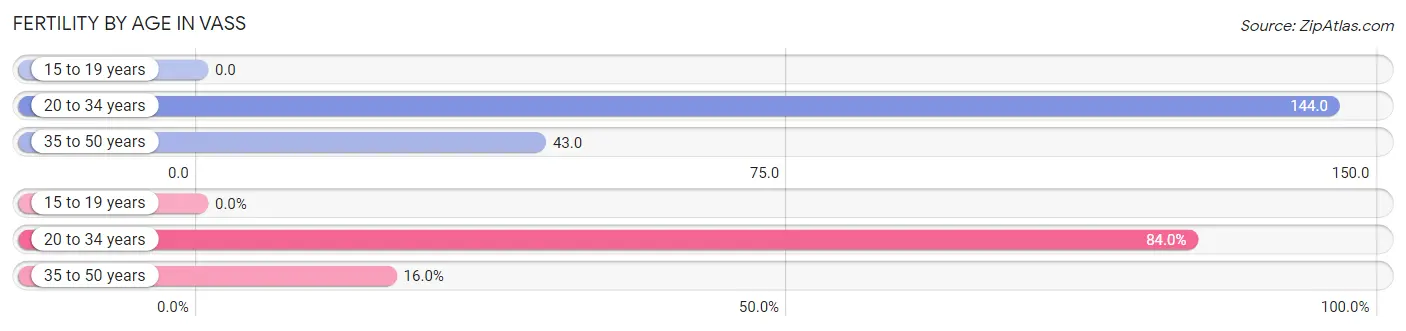
| Age Bracket | Women with Births | Births / 1,000 Women |
| 15 to 19 years | 0 (0.0%) | 0.0 |
| 20 to 34 years | 21 (84.0%) | 144.0 |
| 35 to 50 years | 4 (16.0%) | 43.0 |
| Total | 25 (100.0%) | 96.0 |
Fertility by Age by Marriage Status in Vass
76.0% of women with births (25) in Vass are married. The highest percentage of unmarried women with births falls into 20 to 34 years age bracket with 28.6% of them unmarried at the time of birth, while the lowest percentage of unmarried women with births belong to 35 to 50 years age bracket with 0.0% of them unmarried.
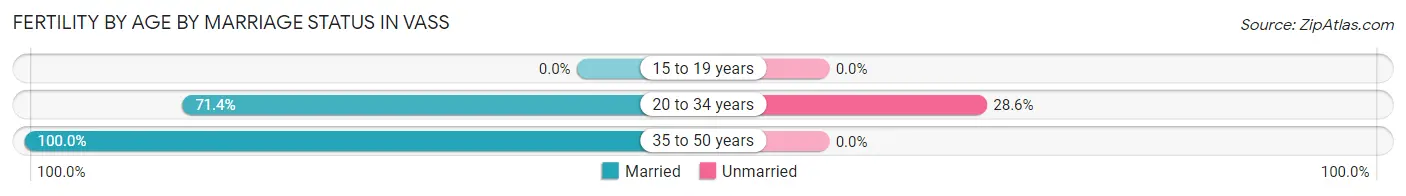
| Age Bracket | Married | Unmarried |
| 15 to 19 years | 0 (0.0%) | 0 (0.0%) |
| 20 to 34 years | 15 (71.4%) | 6 (28.6%) |
| 35 to 50 years | 4 (100.0%) | 0 (0.0%) |
| Total | 19 (76.0%) | 6 (24.0%) |
Fertility by Education in Vass
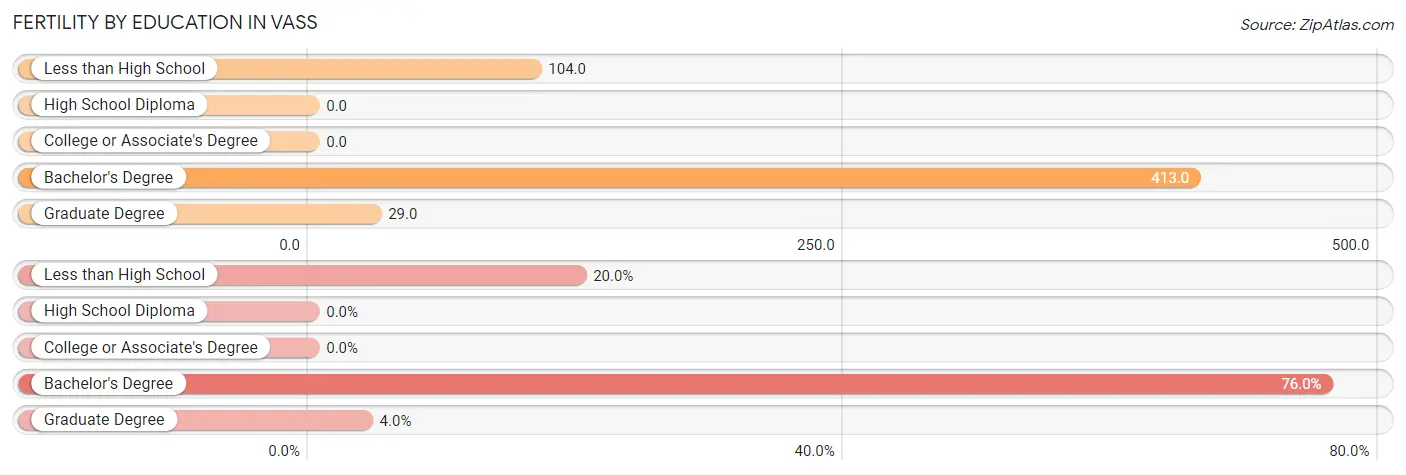
| Educational Attainment | Women with Births | Births / 1,000 Women |
| Less than High School | 5 (20.0%) | 104.0 |
| High School Diploma | 0 (0.0%) | 0.0 |
| College or Associate's Degree | 0 (0.0%) | 0.0 |
| Bachelor's Degree | 19 (76.0%) | 413.0 |
| Graduate Degree | 1 (4.0%) | 29.0 |
| Total | 25 (100.0%) | 96.0 |
Fertility by Education by Marriage Status in Vass
24.0% of women with births in Vass are unmarried. Women with the educational attainment of graduate degree are most likely to be married with 100.0% of them married at childbirth, while women with the educational attainment of bachelor's degree are least likely to be married with 26.3% of them unmarried at childbirth.
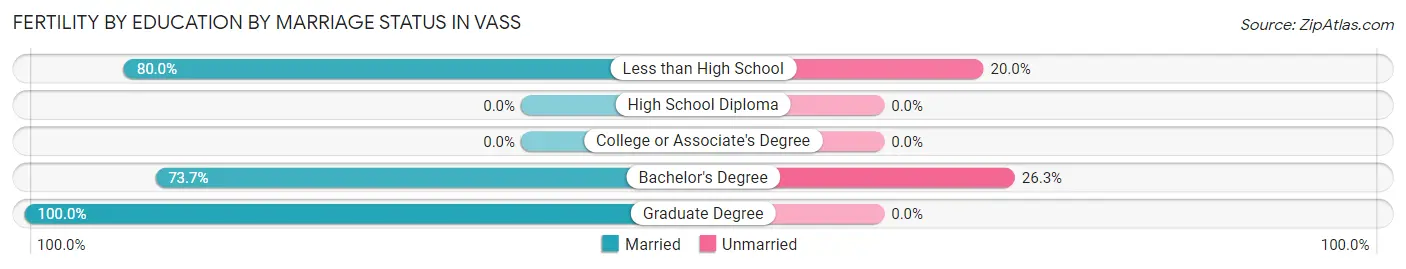
| Educational Attainment | Married | Unmarried |
| Less than High School | 4 (80.0%) | 1 (20.0%) |
| High School Diploma | 0 (0.0%) | 0 (0.0%) |
| College or Associate's Degree | 0 (0.0%) | 0 (0.0%) |
| Bachelor's Degree | 14 (73.7%) | 5 (26.3%) |
| Graduate Degree | 1 (100.0%) | 0 (0.0%) |
| Total | 19 (76.0%) | 6 (24.0%) |
Employment Characteristics in Vass
Employment by Class of Employer in Vass
Among the 557 employed individuals in Vass, private company employees (287 | 51.5%), federal government employees (194 | 34.8%), and self-employed (not incorporated) (33 | 5.9%) make up the most common classes of employment.
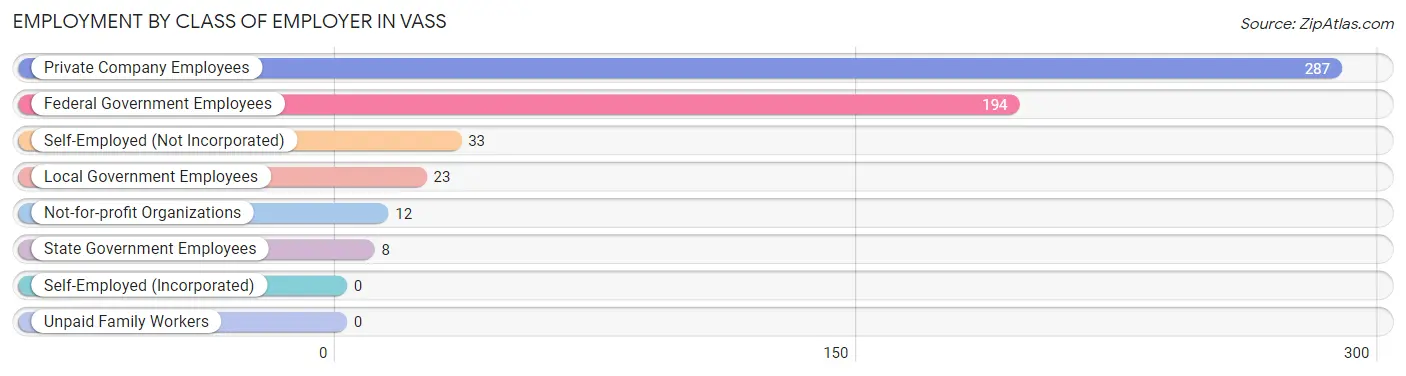
| Employer Class | # Employees | % Employees |
| Private Company Employees | 287 | 51.5% |
| Self-Employed (Incorporated) | 0 | 0.0% |
| Self-Employed (Not Incorporated) | 33 | 5.9% |
| Not-for-profit Organizations | 12 | 2.1% |
| Local Government Employees | 23 | 4.1% |
| State Government Employees | 8 | 1.4% |
| Federal Government Employees | 194 | 34.8% |
| Unpaid Family Workers | 0 | 0.0% |
| Total | 557 | 100.0% |
Employment Status by Age in Vass
According to the labor force statistics for Vass, out of the total population over 16 years of age (775), 73.9% or 573 individuals are in the labor force, with 2.3% or 13 of them unemployed. The age group with the highest labor force participation rate is 20 to 24 years, with 100.0% or 68 individuals in the labor force. Within the labor force, the 20 to 24 years age range has the highest percentage of unemployed individuals, with 13.2% or 9 of them being unemployed.
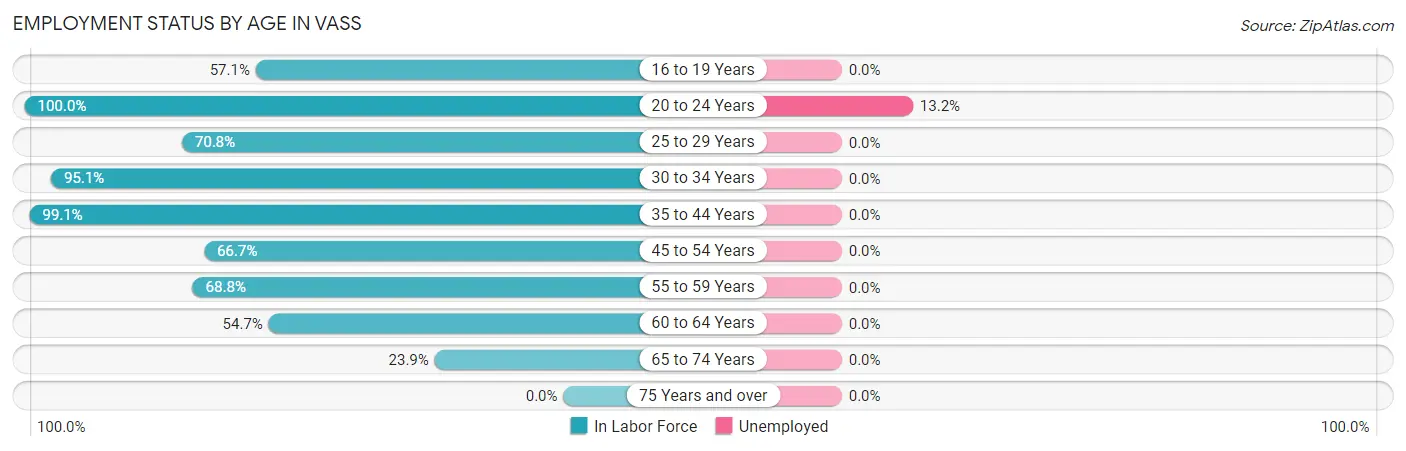
| Age Bracket | In Labor Force | Unemployed |
| 16 to 19 Years | 20 (57.1%) | 0 (0.0%) |
| 20 to 24 Years | 68 (100.0%) | 9 (13.2%) |
| 25 to 29 Years | 34 (70.8%) | 0 (0.0%) |
| 30 to 34 Years | 117 (95.1%) | 0 (0.0%) |
| 35 to 44 Years | 222 (99.1%) | 0 (0.0%) |
| 45 to 54 Years | 38 (66.7%) | 0 (0.0%) |
| 55 to 59 Years | 22 (68.8%) | 0 (0.0%) |
| 60 to 64 Years | 35 (54.7%) | 0 (0.0%) |
| 65 to 74 Years | 17 (23.9%) | 0 (0.0%) |
| 75 Years and over | 0 (0.0%) | 0 (0.0%) |
| Total | 573 (73.9%) | 13 (2.3%) |
Employment Status by Educational Attainment in Vass
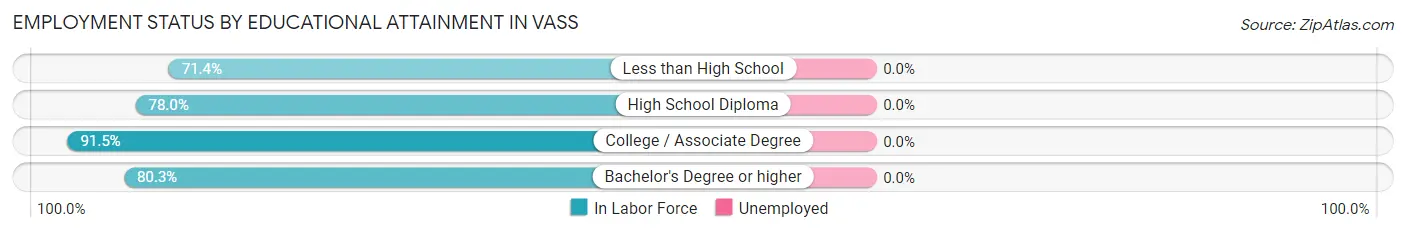
| Educational Attainment | In Labor Force | Unemployed |
| Less than High School | 40 (71.4%) | 0 (0.0%) |
| High School Diploma | 39 (78.0%) | 0 (0.0%) |
| College / Associate Degree | 279 (91.5%) | 0 (0.0%) |
| Bachelor's Degree or higher | 110 (80.3%) | 0 (0.0%) |
| Total | 468 (85.4%) | 0 (0.0%) |
Employment Occupations by Sex in Vass
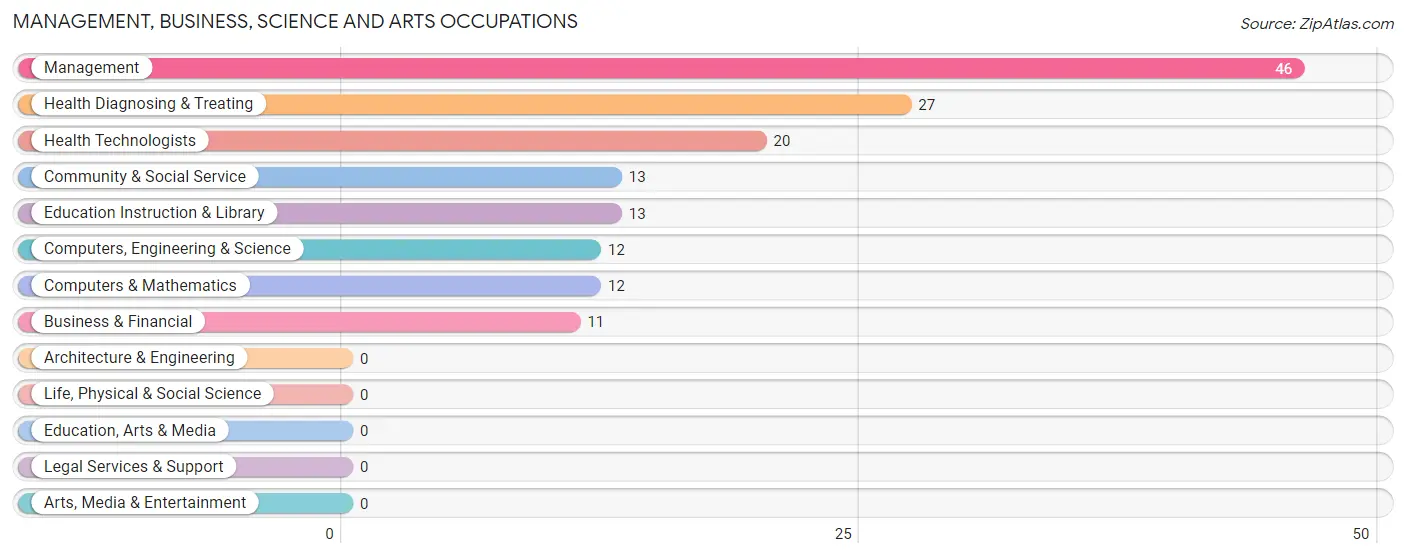
Management, Business, Science and Arts Occupations
The most common Management, Business, Science and Arts occupations in Vass are Management (46 | 11.8%), Health Diagnosing & Treating (27 | 6.9%), Health Technologists (20 | 5.1%), Community & Social Service (13 | 3.3%), and Education Instruction & Library (13 | 3.3%).
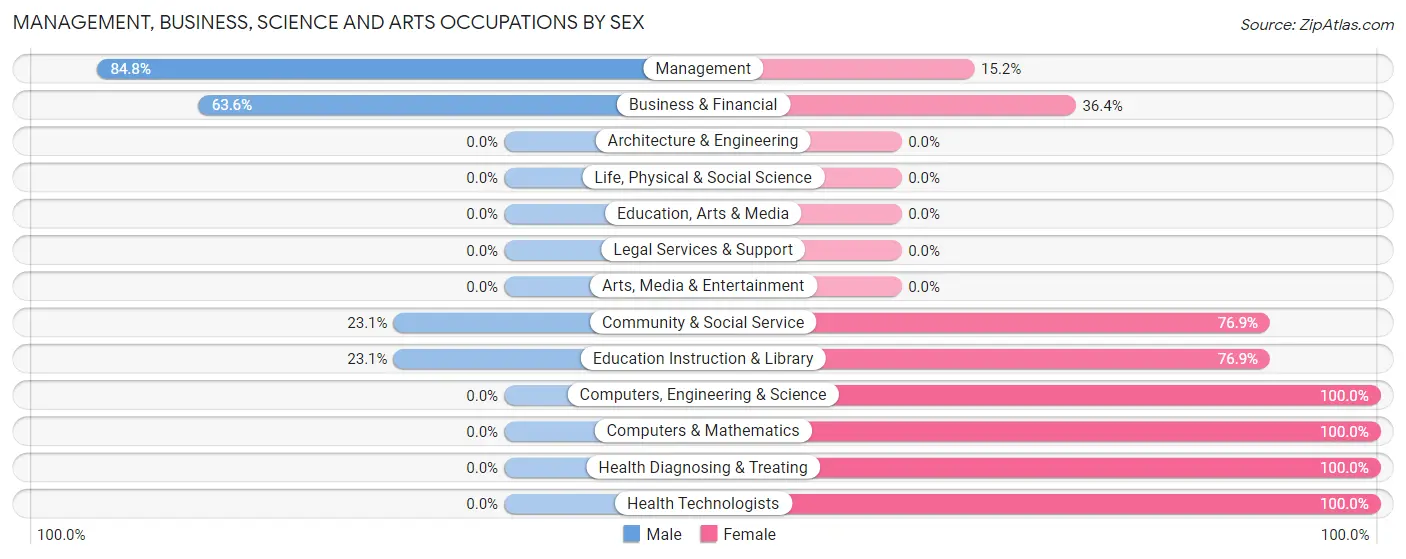
Management, Business, Science and Arts Occupations by Sex
Within the Management, Business, Science and Arts occupations in Vass, the most male-oriented occupations are Management (84.8%), Business & Financial (63.6%), and Community & Social Service (23.1%), while the most female-oriented occupations are Computers, Engineering & Science (100.0%), Computers & Mathematics (100.0%), and Health Diagnosing & Treating (100.0%).
| Occupation | Male | Female |
| Management | 39 (84.8%) | 7 (15.2%) |
| Business & Financial | 7 (63.6%) | 4 (36.4%) |
| Computers, Engineering & Science | 0 (0.0%) | 12 (100.0%) |
| Computers & Mathematics | 0 (0.0%) | 12 (100.0%) |
| Architecture & Engineering | 0 (0.0%) | 0 (0.0%) |
| Life, Physical & Social Science | 0 (0.0%) | 0 (0.0%) |
| Community & Social Service | 3 (23.1%) | 10 (76.9%) |
| Education, Arts & Media | 0 (0.0%) | 0 (0.0%) |
| Legal Services & Support | 0 (0.0%) | 0 (0.0%) |
| Education Instruction & Library | 3 (23.1%) | 10 (76.9%) |
| Arts, Media & Entertainment | 0 (0.0%) | 0 (0.0%) |
| Health Diagnosing & Treating | 0 (0.0%) | 27 (100.0%) |
| Health Technologists | 0 (0.0%) | 20 (100.0%) |
| Total (Category) | 49 (45.0%) | 60 (55.0%) |
| Total (Overall) | 170 (43.6%) | 220 (56.4%) |
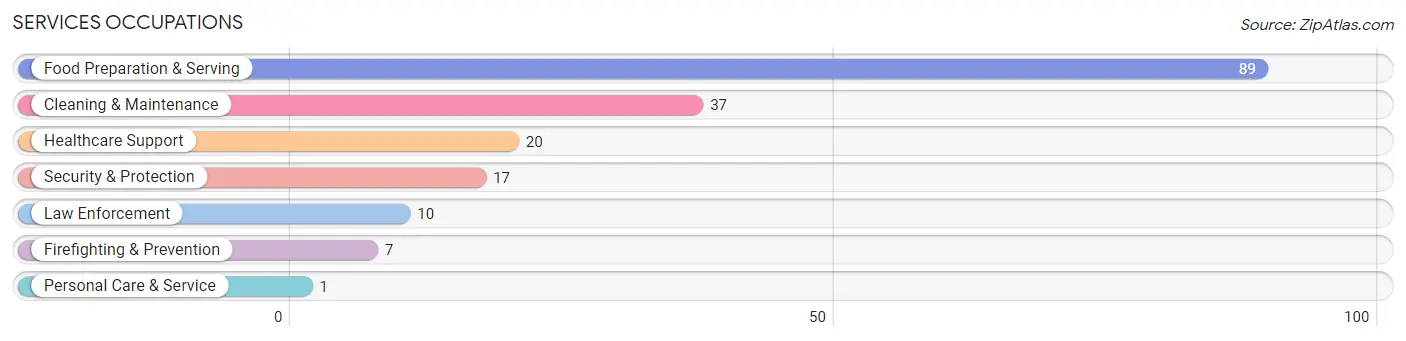
Services Occupations
The most common Services occupations in Vass are Food Preparation & Serving (89 | 22.8%), Cleaning & Maintenance (37 | 9.5%), Healthcare Support (20 | 5.1%), Security & Protection (17 | 4.4%), and Law Enforcement (10 | 2.6%).
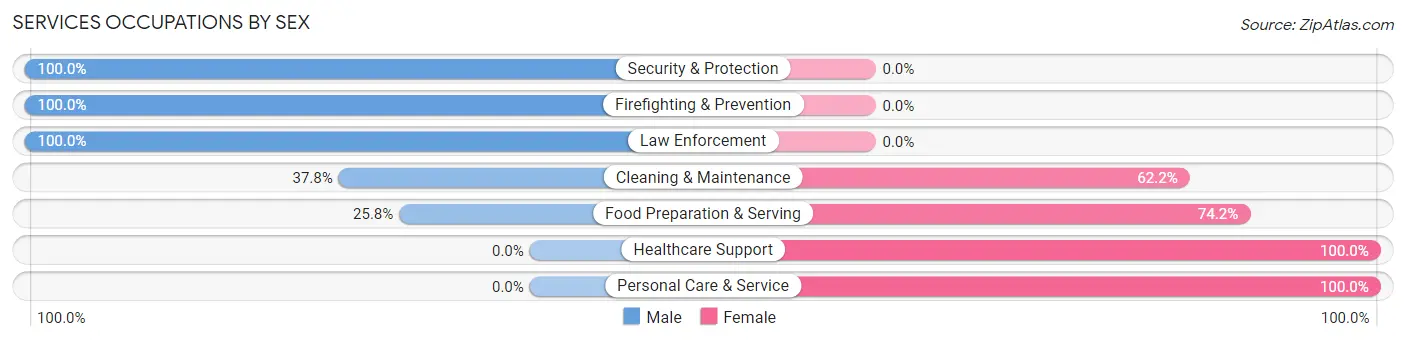
Services Occupations by Sex
Within the Services occupations in Vass, the most male-oriented occupations are Security & Protection (100.0%), Firefighting & Prevention (100.0%), and Law Enforcement (100.0%), while the most female-oriented occupations are Healthcare Support (100.0%), Personal Care & Service (100.0%), and Food Preparation & Serving (74.2%).
| Occupation | Male | Female |
| Healthcare Support | 0 (0.0%) | 20 (100.0%) |
| Security & Protection | 17 (100.0%) | 0 (0.0%) |
| Firefighting & Prevention | 7 (100.0%) | 0 (0.0%) |
| Law Enforcement | 10 (100.0%) | 0 (0.0%) |
| Food Preparation & Serving | 23 (25.8%) | 66 (74.2%) |
| Cleaning & Maintenance | 14 (37.8%) | 23 (62.2%) |
| Personal Care & Service | 0 (0.0%) | 1 (100.0%) |
| Total (Category) | 54 (32.9%) | 110 (67.1%) |
| Total (Overall) | 170 (43.6%) | 220 (56.4%) |
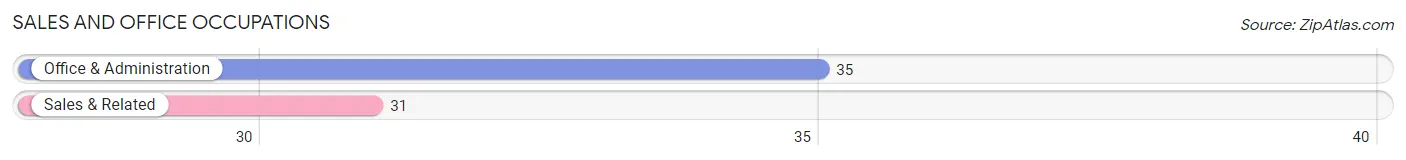
Sales and Office Occupations
The most common Sales and Office occupations in Vass are Office & Administration (35 | 9.0%), and Sales & Related (31 | 8.0%).
Sales and Office Occupations by Sex
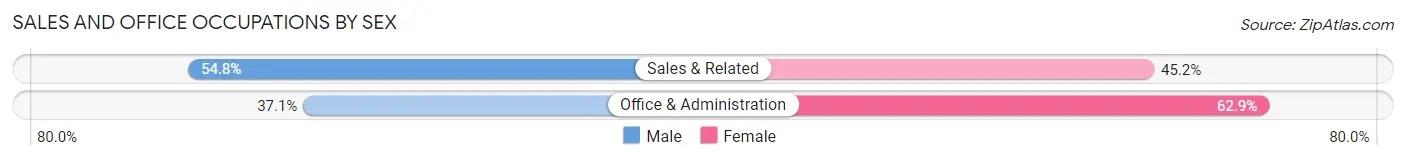
| Occupation | Male | Female |
| Sales & Related | 17 (54.8%) | 14 (45.2%) |
| Office & Administration | 13 (37.1%) | 22 (62.9%) |
| Total (Category) | 30 (45.5%) | 36 (54.5%) |
| Total (Overall) | 170 (43.6%) | 220 (56.4%) |
Natural Resources, Construction and Maintenance Occupations
Natural Resources, Construction and Maintenance Occupations by Sex
| Occupation | Male | Female |
| Farming, Fishing & Forestry | 0 (0.0%) | 0 (0.0%) |
| Construction & Extraction | 0 (0.0%) | 0 (0.0%) |
| Installation, Maintenance & Repair | 0 (0.0%) | 0 (0.0%) |
| Total (Category) | 0 (0.0%) | 0 (0.0%) |
| Total (Overall) | 170 (43.6%) | 220 (56.4%) |
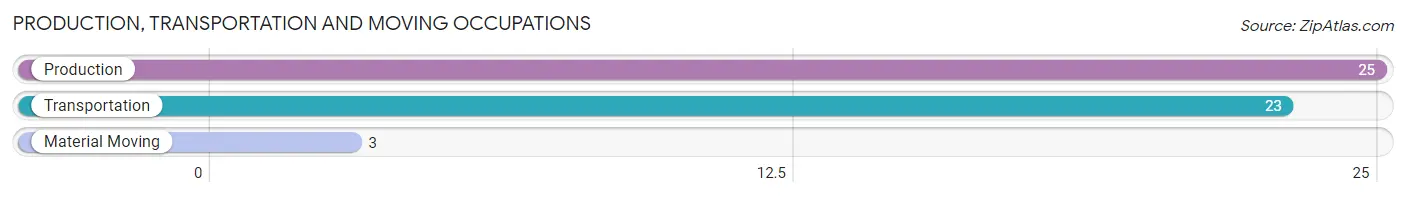
Production, Transportation and Moving Occupations
The most common Production, Transportation and Moving occupations in Vass are Production (25 | 6.4%), Transportation (23 | 5.9%), and Material Moving (3 | 0.8%).
Production, Transportation and Moving Occupations by Sex
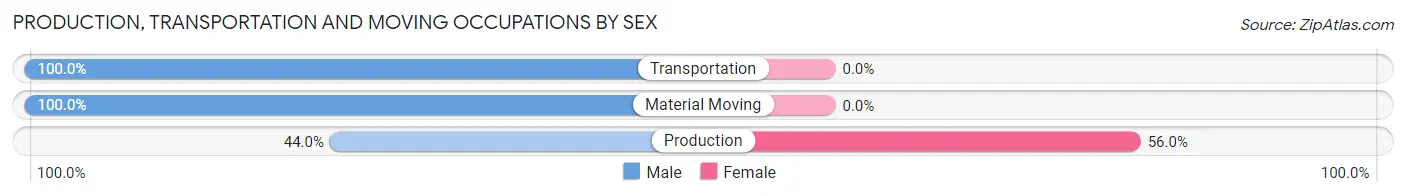
| Occupation | Male | Female |
| Production | 11 (44.0%) | 14 (56.0%) |
| Transportation | 23 (100.0%) | 0 (0.0%) |
| Material Moving | 3 (100.0%) | 0 (0.0%) |
| Total (Category) | 37 (72.6%) | 14 (27.5%) |
| Total (Overall) | 170 (43.6%) | 220 (56.4%) |
Employment Industries by Sex in Vass
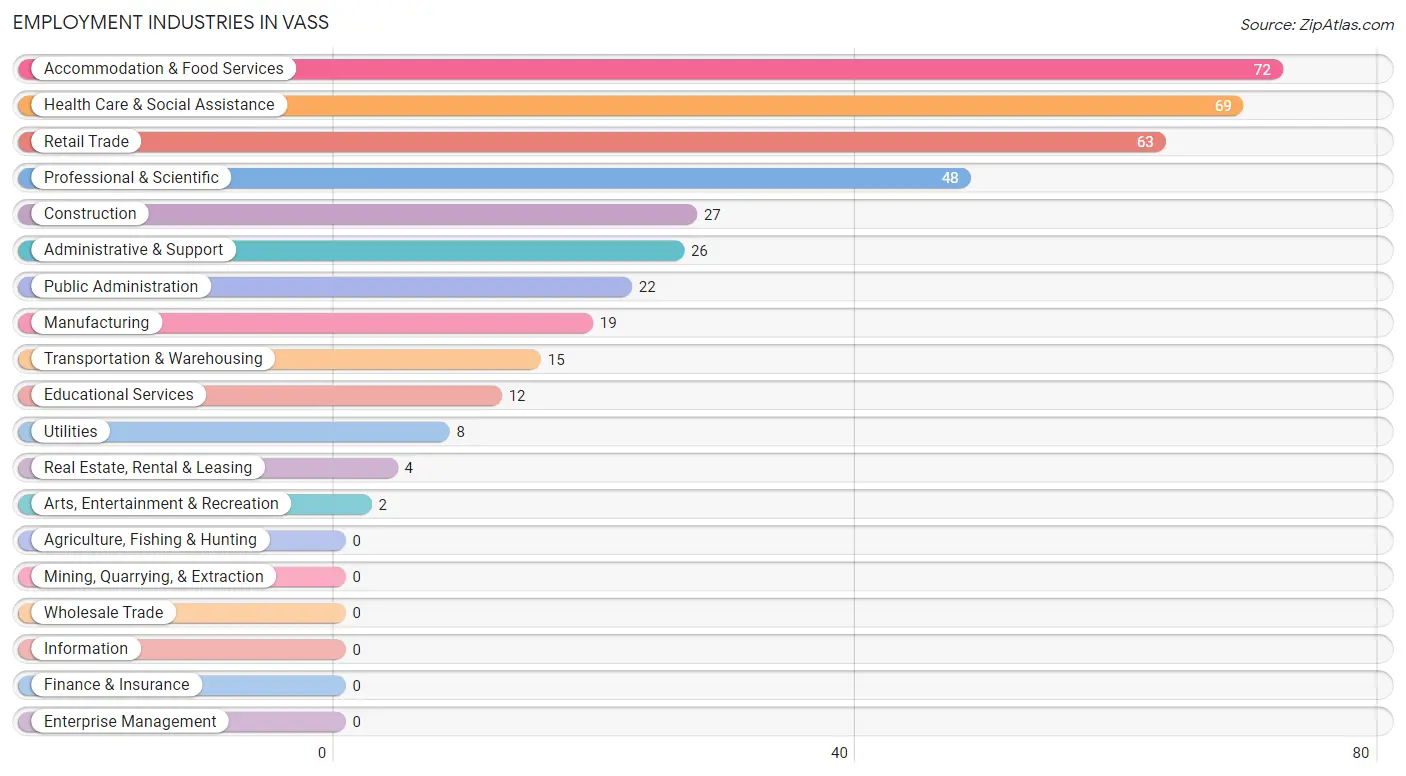
Employment Industries in Vass
The major employment industries in Vass include Accommodation & Food Services (72 | 18.5%), Health Care & Social Assistance (69 | 17.7%), Retail Trade (63 | 16.2%), Professional & Scientific (48 | 12.3%), and Construction (27 | 6.9%).
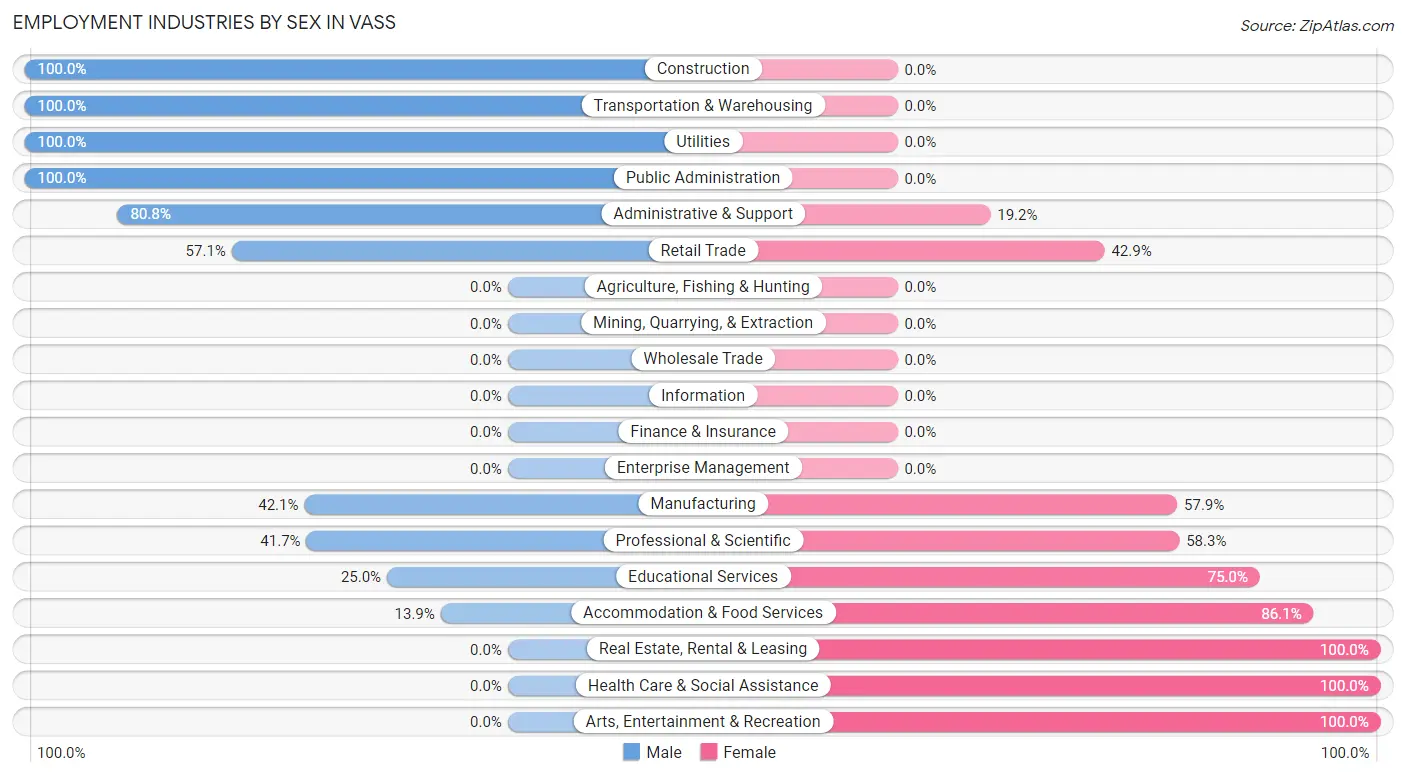
Employment Industries by Sex in Vass
The Vass industries that see more men than women are Construction (100.0%), Transportation & Warehousing (100.0%), and Utilities (100.0%), whereas the industries that tend to have a higher number of women are Real Estate, Rental & Leasing (100.0%), Health Care & Social Assistance (100.0%), and Arts, Entertainment & Recreation (100.0%).
| Industry | Male | Female |
| Agriculture, Fishing & Hunting | 0 (0.0%) | 0 (0.0%) |
| Mining, Quarrying, & Extraction | 0 (0.0%) | 0 (0.0%) |
| Construction | 27 (100.0%) | 0 (0.0%) |
| Manufacturing | 8 (42.1%) | 11 (57.9%) |
| Wholesale Trade | 0 (0.0%) | 0 (0.0%) |
| Retail Trade | 36 (57.1%) | 27 (42.9%) |
| Transportation & Warehousing | 15 (100.0%) | 0 (0.0%) |
| Utilities | 8 (100.0%) | 0 (0.0%) |
| Information | 0 (0.0%) | 0 (0.0%) |
| Finance & Insurance | 0 (0.0%) | 0 (0.0%) |
| Real Estate, Rental & Leasing | 0 (0.0%) | 4 (100.0%) |
| Professional & Scientific | 20 (41.7%) | 28 (58.3%) |
| Enterprise Management | 0 (0.0%) | 0 (0.0%) |
| Administrative & Support | 21 (80.8%) | 5 (19.2%) |
| Educational Services | 3 (25.0%) | 9 (75.0%) |
| Health Care & Social Assistance | 0 (0.0%) | 69 (100.0%) |
| Arts, Entertainment & Recreation | 0 (0.0%) | 2 (100.0%) |
| Accommodation & Food Services | 10 (13.9%) | 62 (86.1%) |
| Public Administration | 22 (100.0%) | 0 (0.0%) |
| Total | 170 (43.6%) | 220 (56.4%) |
Education in Vass
School Enrollment in Vass
The most common levels of schooling among the 375 students in Vass are middle school (162 | 43.2%), elementary school (102 | 27.2%), and high school (57 | 15.2%).
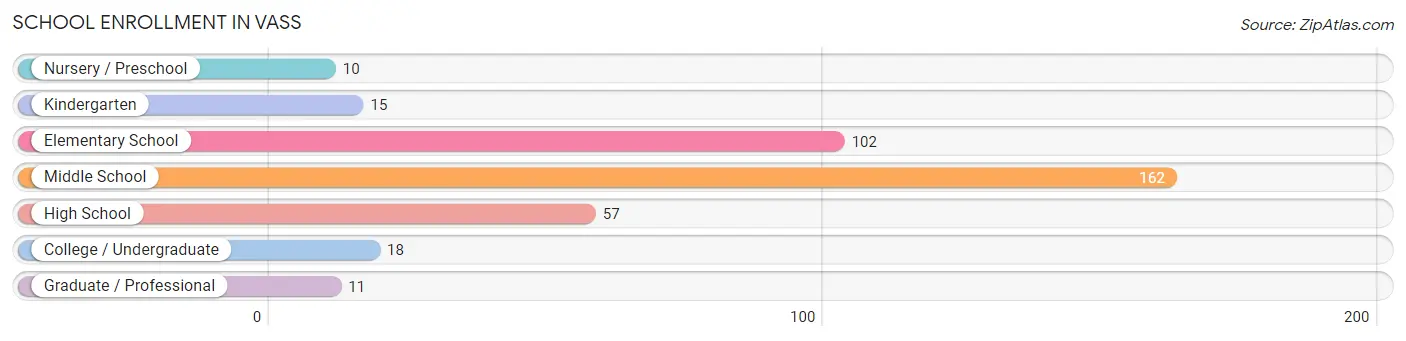
| School Level | # Students | % Students |
| Nursery / Preschool | 10 | 2.7% |
| Kindergarten | 15 | 4.0% |
| Elementary School | 102 | 27.2% |
| Middle School | 162 | 43.2% |
| High School | 57 | 15.2% |
| College / Undergraduate | 18 | 4.8% |
| Graduate / Professional | 11 | 2.9% |
| Total | 375 | 100.0% |
School Enrollment by Age by Funding Source in Vass
Out of a total of 375 students who are enrolled in schools in Vass, 18 (4.8%) attend a private institution, while the remaining 357 (95.2%) are enrolled in public schools. The age group of 3 to 4 year olds has the highest likelihood of being enrolled in private schools, with 7 (100.0% in the age bracket) enrolled. Conversely, the age group of 18 to 19 year olds has the lowest likelihood of being enrolled in a private school, with 9 (100.0% in the age bracket) attending a public institution.
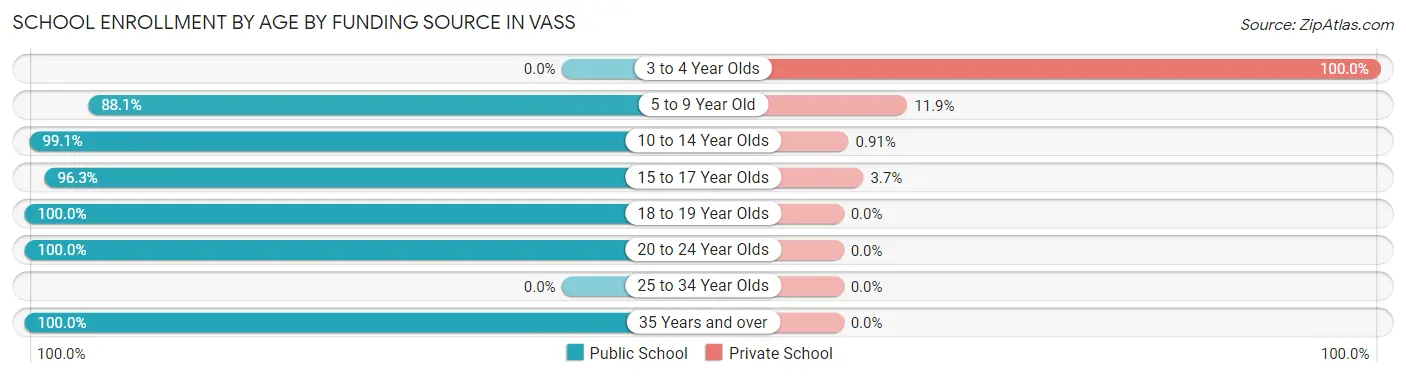
| Age Bracket | Public School | Private School |
| 3 to 4 Year Olds | 0 (0.0%) | 7 (100.0%) |
| 5 to 9 Year Old | 52 (88.1%) | 7 (11.9%) |
| 10 to 14 Year Olds | 218 (99.1%) | 2 (0.9%) |
| 15 to 17 Year Olds | 52 (96.3%) | 2 (3.7%) |
| 18 to 19 Year Olds | 9 (100.0%) | 0 (0.0%) |
| 20 to 24 Year Olds | 7 (100.0%) | 0 (0.0%) |
| 25 to 34 Year Olds | 0 (0.0%) | 0 (0.0%) |
| 35 Years and over | 19 (100.0%) | 0 (0.0%) |
| Total | 357 (95.2%) | 18 (4.8%) |
Educational Attainment by Field of Study in Vass
Bio, nature & agricultural (44 | 24.9%), science & technology (28 | 15.8%), computers & mathematics (27 | 15.2%), social sciences (23 | 13.0%), and education (13 | 7.3%) are the most common fields of study among 177 individuals in Vass who have obtained a bachelor's degree or higher.
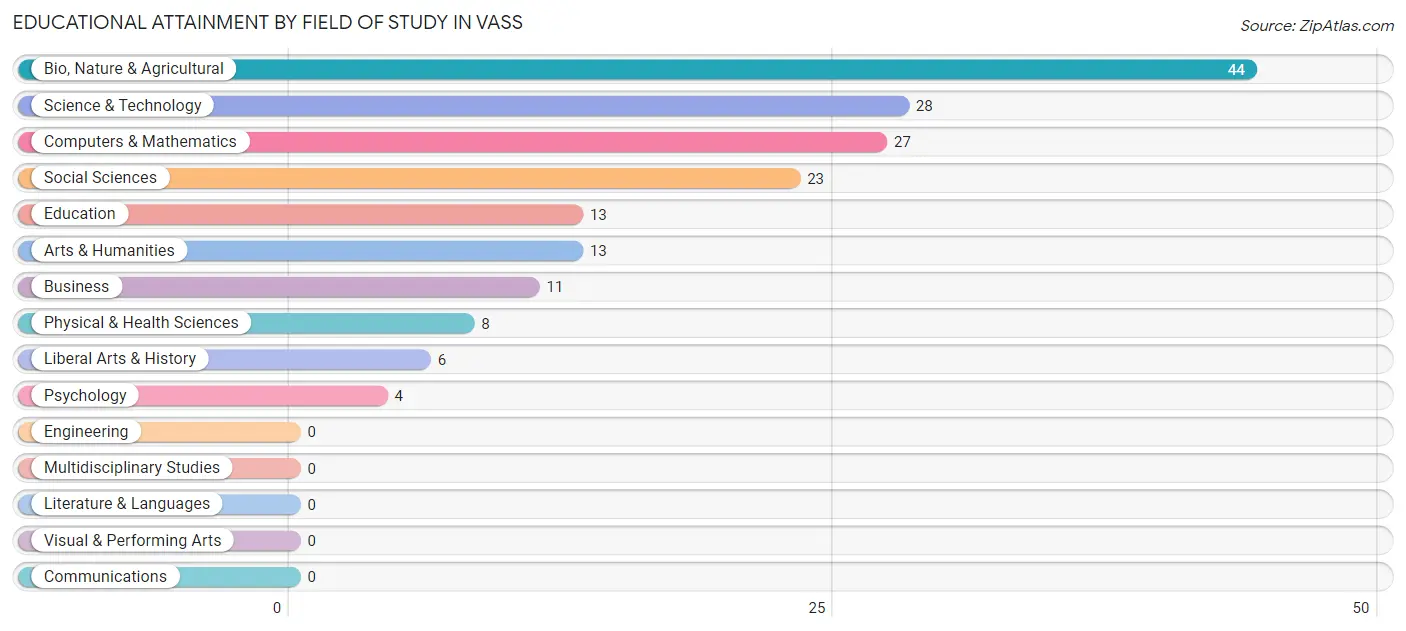
| Field of Study | # Graduates | % Graduates |
| Computers & Mathematics | 27 | 15.2% |
| Bio, Nature & Agricultural | 44 | 24.9% |
| Physical & Health Sciences | 8 | 4.5% |
| Psychology | 4 | 2.3% |
| Social Sciences | 23 | 13.0% |
| Engineering | 0 | 0.0% |
| Multidisciplinary Studies | 0 | 0.0% |
| Science & Technology | 28 | 15.8% |
| Business | 11 | 6.2% |
| Education | 13 | 7.3% |
| Literature & Languages | 0 | 0.0% |
| Liberal Arts & History | 6 | 3.4% |
| Visual & Performing Arts | 0 | 0.0% |
| Communications | 0 | 0.0% |
| Arts & Humanities | 13 | 7.3% |
| Total | 177 | 100.0% |
Transportation & Commute in Vass
Vehicle Availability by Sex in Vass
The most prevalent vehicle ownership categories in Vass are males with 2 vehicles (191, accounting for 65.6%) and females with 2 vehicles (180, making up 71.8%).
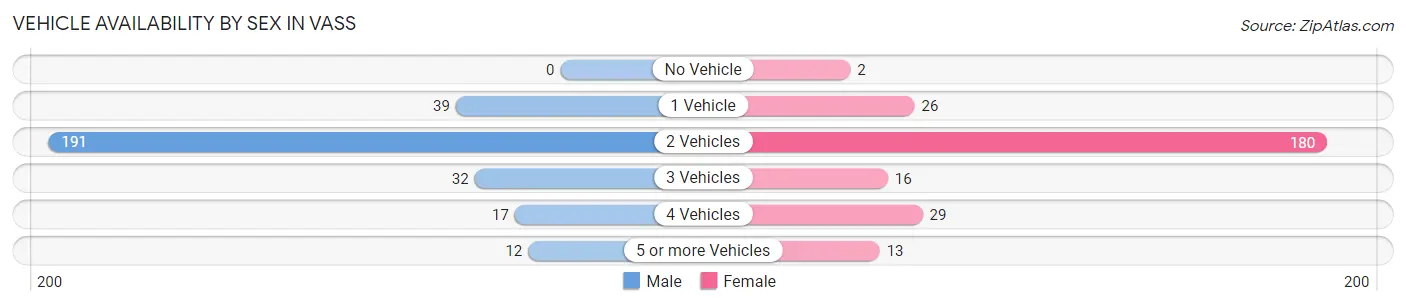
| Vehicles Available | Male | Female |
| No Vehicle | 0 (0.0%) | 2 (0.7%) |
| 1 Vehicle | 39 (13.4%) | 26 (9.8%) |
| 2 Vehicles | 191 (65.6%) | 180 (67.7%) |
| 3 Vehicles | 32 (11.0%) | 16 (6.0%) |
| 4 Vehicles | 17 (5.8%) | 29 (10.9%) |
| 5 or more Vehicles | 12 (4.1%) | 13 (4.9%) |
| Total | 291 (100.0%) | 266 (100.0%) |
Commute Time in Vass
The most frequently occuring commute durations in Vass are 20 to 24 minutes (147 commuters, 29.2%), 15 to 19 minutes (97 commuters, 19.3%), and 30 to 34 minutes (63 commuters, 12.5%).
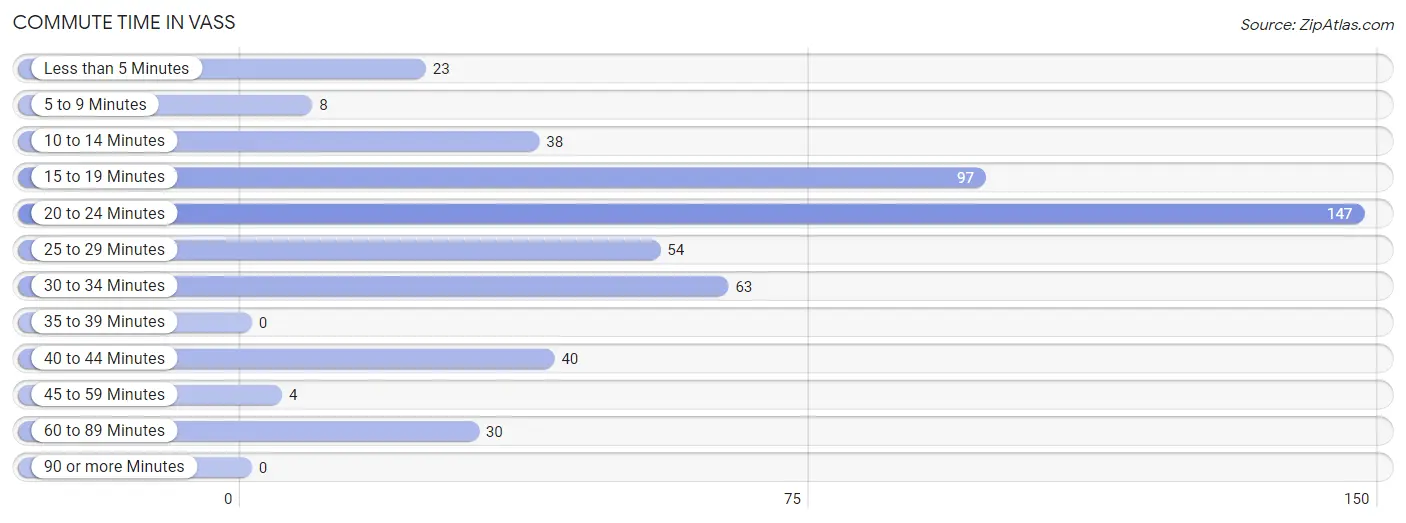
| Commute Time | # Commuters | % Commuters |
| Less than 5 Minutes | 23 | 4.6% |
| 5 to 9 Minutes | 8 | 1.6% |
| 10 to 14 Minutes | 38 | 7.5% |
| 15 to 19 Minutes | 97 | 19.3% |
| 20 to 24 Minutes | 147 | 29.2% |
| 25 to 29 Minutes | 54 | 10.7% |
| 30 to 34 Minutes | 63 | 12.5% |
| 35 to 39 Minutes | 0 | 0.0% |
| 40 to 44 Minutes | 40 | 7.9% |
| 45 to 59 Minutes | 4 | 0.8% |
| 60 to 89 Minutes | 30 | 5.9% |
| 90 or more Minutes | 0 | 0.0% |
Commute Time by Sex in Vass
The most common commute times in Vass are 20 to 24 minutes (113 commuters, 41.7%) for males and 15 to 19 minutes (58 commuters, 24.9%) for females.
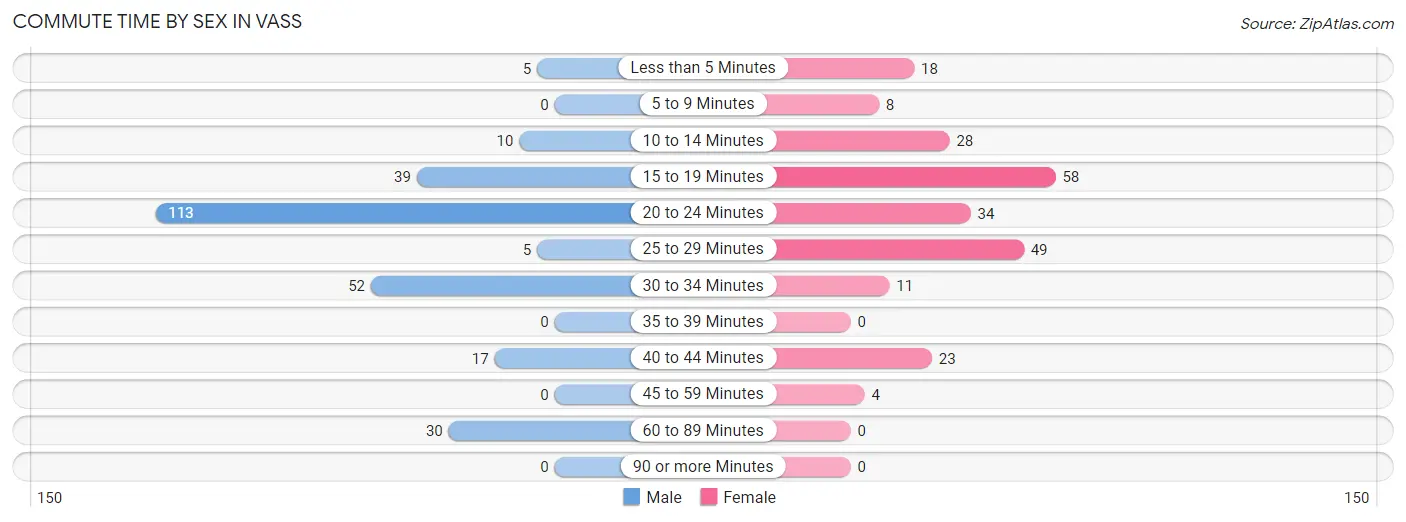
| Commute Time | Male | Female |
| Less than 5 Minutes | 5 (1.8%) | 18 (7.7%) |
| 5 to 9 Minutes | 0 (0.0%) | 8 (3.4%) |
| 10 to 14 Minutes | 10 (3.7%) | 28 (12.0%) |
| 15 to 19 Minutes | 39 (14.4%) | 58 (24.9%) |
| 20 to 24 Minutes | 113 (41.7%) | 34 (14.6%) |
| 25 to 29 Minutes | 5 (1.8%) | 49 (21.0%) |
| 30 to 34 Minutes | 52 (19.2%) | 11 (4.7%) |
| 35 to 39 Minutes | 0 (0.0%) | 0 (0.0%) |
| 40 to 44 Minutes | 17 (6.3%) | 23 (9.9%) |
| 45 to 59 Minutes | 0 (0.0%) | 4 (1.7%) |
| 60 to 89 Minutes | 30 (11.1%) | 0 (0.0%) |
| 90 or more Minutes | 0 (0.0%) | 0 (0.0%) |
Time of Departure to Work by Sex in Vass
The most frequent times of departure to work in Vass are 7:00 AM to 7:29 AM (104, 38.4%) for males and 6:30 AM to 6:59 AM (51, 21.9%) for females.
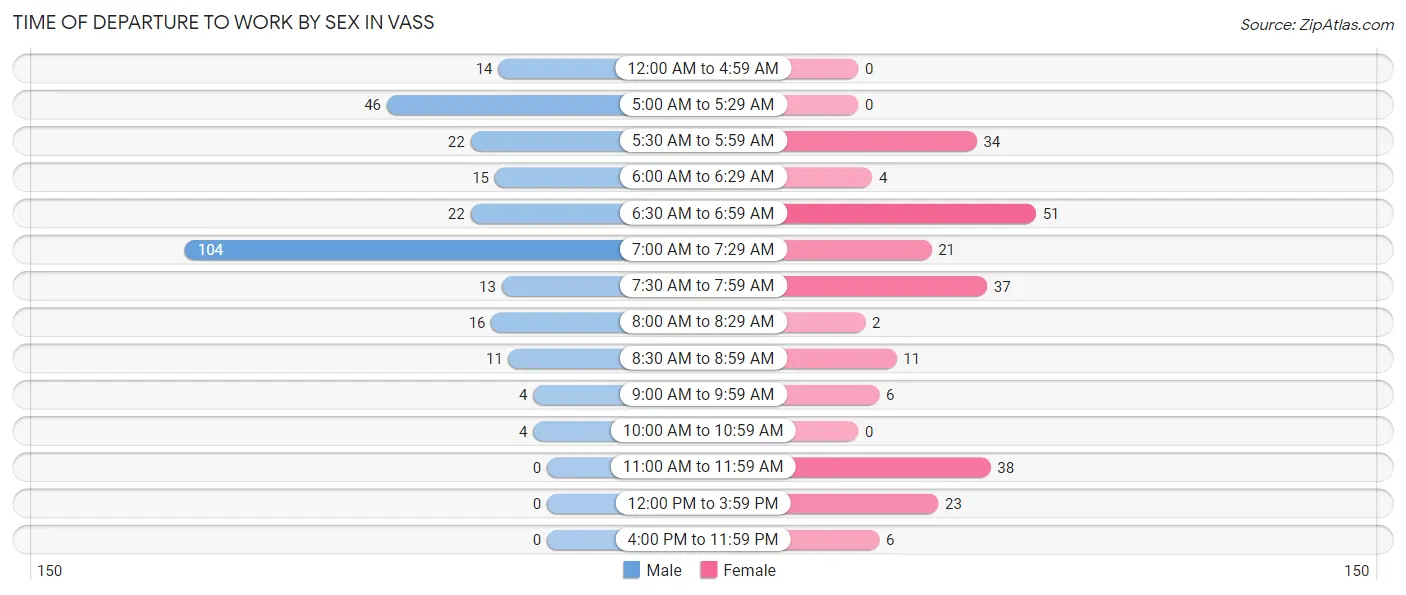
| Time of Departure | Male | Female |
| 12:00 AM to 4:59 AM | 14 (5.2%) | 0 (0.0%) |
| 5:00 AM to 5:29 AM | 46 (17.0%) | 0 (0.0%) |
| 5:30 AM to 5:59 AM | 22 (8.1%) | 34 (14.6%) |
| 6:00 AM to 6:29 AM | 15 (5.5%) | 4 (1.7%) |
| 6:30 AM to 6:59 AM | 22 (8.1%) | 51 (21.9%) |
| 7:00 AM to 7:29 AM | 104 (38.4%) | 21 (9.0%) |
| 7:30 AM to 7:59 AM | 13 (4.8%) | 37 (15.9%) |
| 8:00 AM to 8:29 AM | 16 (5.9%) | 2 (0.9%) |
| 8:30 AM to 8:59 AM | 11 (4.1%) | 11 (4.7%) |
| 9:00 AM to 9:59 AM | 4 (1.5%) | 6 (2.6%) |
| 10:00 AM to 10:59 AM | 4 (1.5%) | 0 (0.0%) |
| 11:00 AM to 11:59 AM | 0 (0.0%) | 38 (16.3%) |
| 12:00 PM to 3:59 PM | 0 (0.0%) | 23 (9.9%) |
| 4:00 PM to 11:59 PM | 0 (0.0%) | 6 (2.6%) |
| Total | 271 (100.0%) | 233 (100.0%) |
Housing Occupancy in Vass
Occupancy by Ownership in Vass
Of the total 398 dwellings in Vass, owner-occupied units account for 284 (71.4%), while renter-occupied units make up 114 (28.6%).
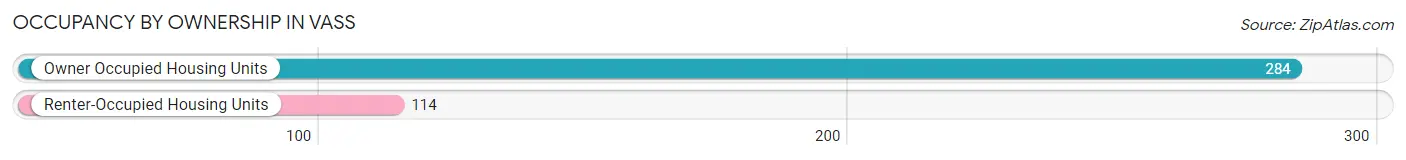
| Occupancy | # Housing Units | % Housing Units |
| Owner Occupied Housing Units | 284 | 71.4% |
| Renter-Occupied Housing Units | 114 | 28.6% |
| Total Occupied Housing Units | 398 | 100.0% |
Occupancy by Household Size in Vass
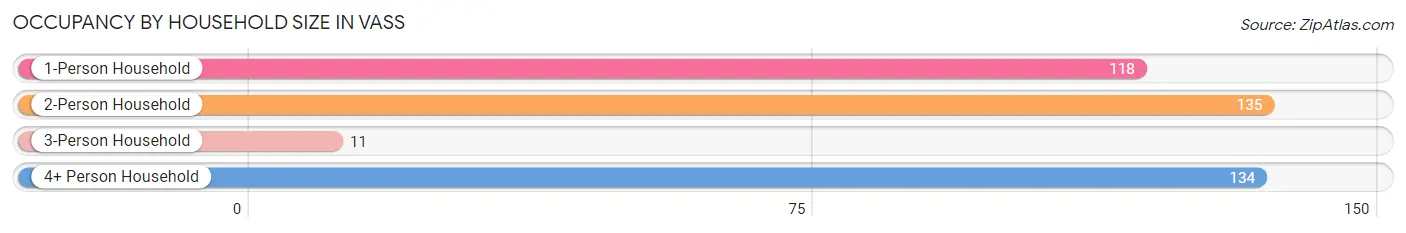
| Household Size | # Housing Units | % Housing Units |
| 1-Person Household | 118 | 29.6% |
| 2-Person Household | 135 | 33.9% |
| 3-Person Household | 11 | 2.8% |
| 4+ Person Household | 134 | 33.7% |
| Total Housing Units | 398 | 100.0% |
Occupancy by Ownership by Household Size in Vass
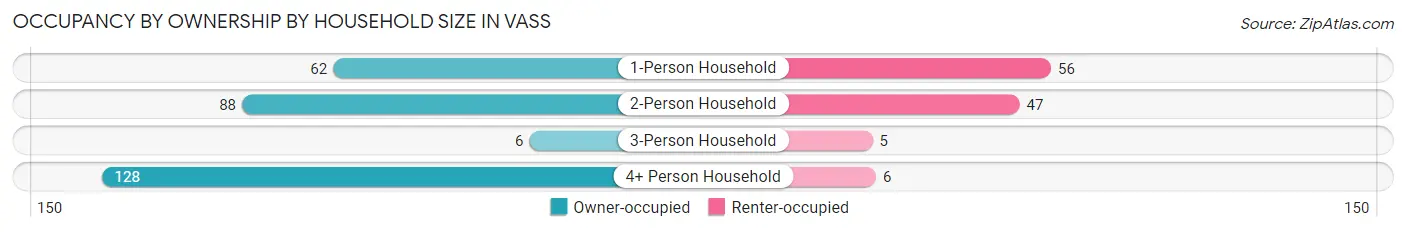
| Household Size | Owner-occupied | Renter-occupied |
| 1-Person Household | 62 (52.5%) | 56 (47.5%) |
| 2-Person Household | 88 (65.2%) | 47 (34.8%) |
| 3-Person Household | 6 (54.5%) | 5 (45.5%) |
| 4+ Person Household | 128 (95.5%) | 6 (4.5%) |
| Total Housing Units | 284 (71.4%) | 114 (28.6%) |
Occupancy by Educational Attainment in Vass
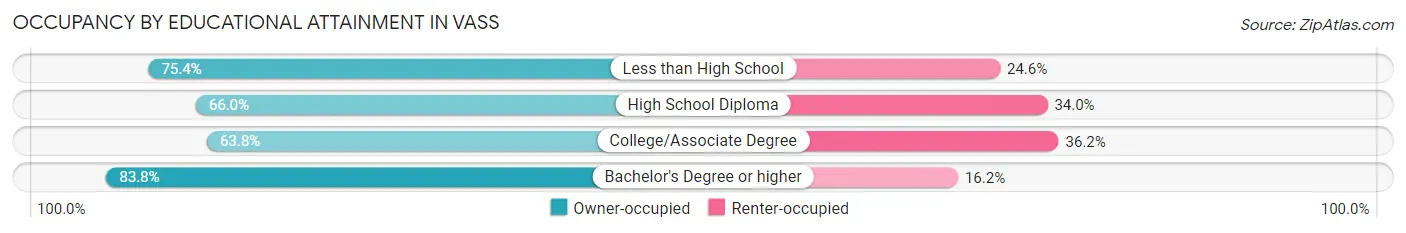
| Household Size | Owner-occupied | Renter-occupied |
| Less than High School | 43 (75.4%) | 14 (24.6%) |
| High School Diploma | 35 (66.0%) | 18 (34.0%) |
| College/Associate Degree | 113 (63.8%) | 64 (36.2%) |
| Bachelor's Degree or higher | 93 (83.8%) | 18 (16.2%) |
Occupancy by Age of Householder in Vass
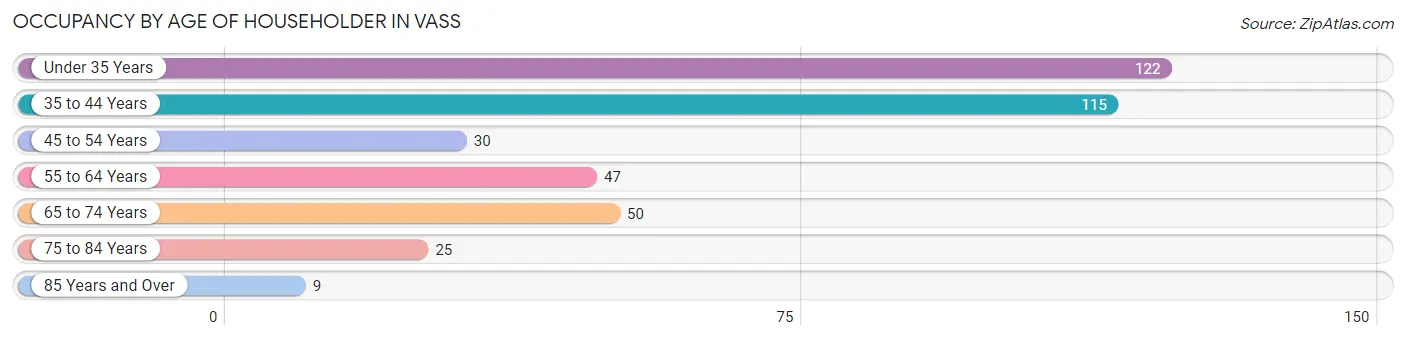
| Age Bracket | # Households | % Households |
| Under 35 Years | 122 | 30.6% |
| 35 to 44 Years | 115 | 28.9% |
| 45 to 54 Years | 30 | 7.5% |
| 55 to 64 Years | 47 | 11.8% |
| 65 to 74 Years | 50 | 12.6% |
| 75 to 84 Years | 25 | 6.3% |
| 85 Years and Over | 9 | 2.3% |
| Total | 398 | 100.0% |
Housing Finances in Vass
Median Income by Occupancy in Vass
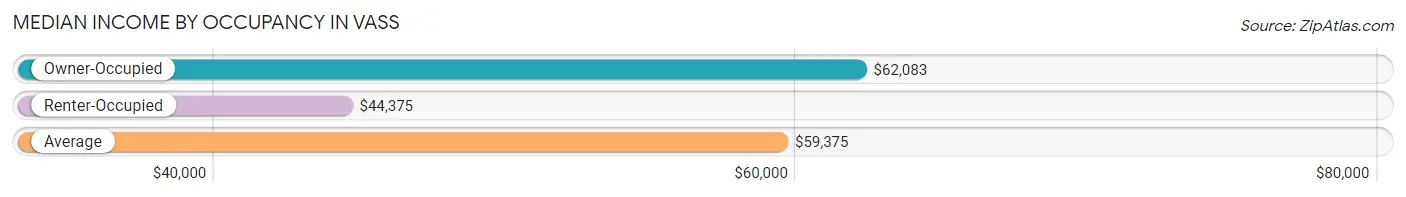
| Occupancy Type | # Households | Median Income |
| Owner-Occupied | 284 (71.4%) | $62,083 |
| Renter-Occupied | 114 (28.6%) | $44,375 |
| Average | 398 (100.0%) | $59,375 |
Occupancy by Householder Income Bracket in Vass
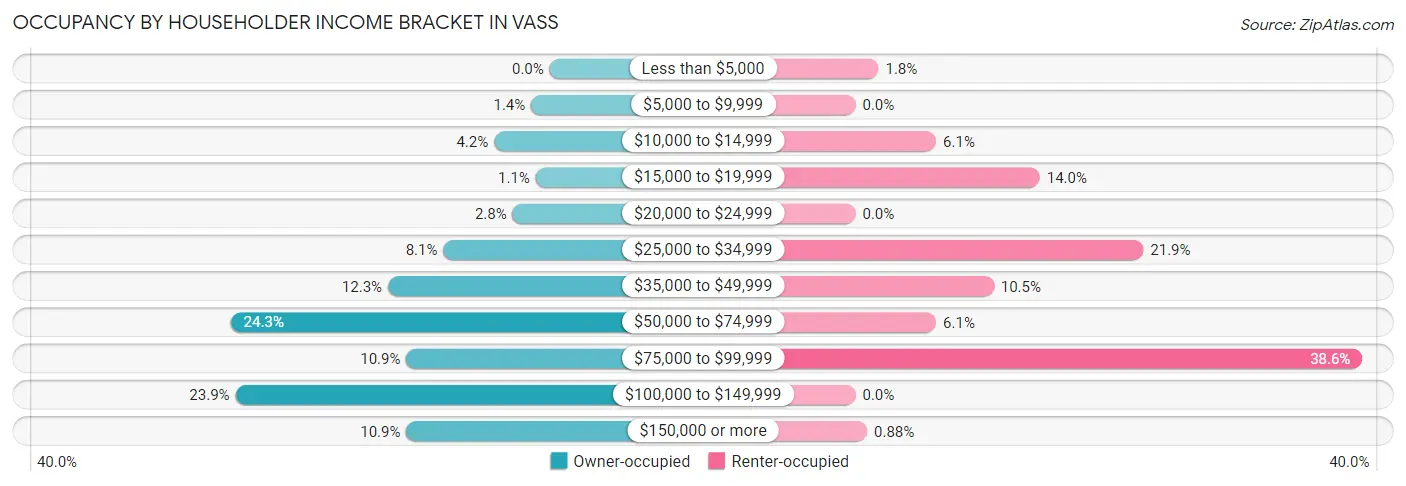
| Income Bracket | Owner-occupied | Renter-occupied |
| Less than $5,000 | 0 (0.0%) | 2 (1.8%) |
| $5,000 to $9,999 | 4 (1.4%) | 0 (0.0%) |
| $10,000 to $14,999 | 12 (4.2%) | 7 (6.1%) |
| $15,000 to $19,999 | 3 (1.1%) | 16 (14.0%) |
| $20,000 to $24,999 | 8 (2.8%) | 0 (0.0%) |
| $25,000 to $34,999 | 23 (8.1%) | 25 (21.9%) |
| $35,000 to $49,999 | 35 (12.3%) | 12 (10.5%) |
| $50,000 to $74,999 | 69 (24.3%) | 7 (6.1%) |
| $75,000 to $99,999 | 31 (10.9%) | 44 (38.6%) |
| $100,000 to $149,999 | 68 (23.9%) | 0 (0.0%) |
| $150,000 or more | 31 (10.9%) | 1 (0.9%) |
| Total | 284 (100.0%) | 114 (100.0%) |
Monthly Housing Cost Tiers in Vass
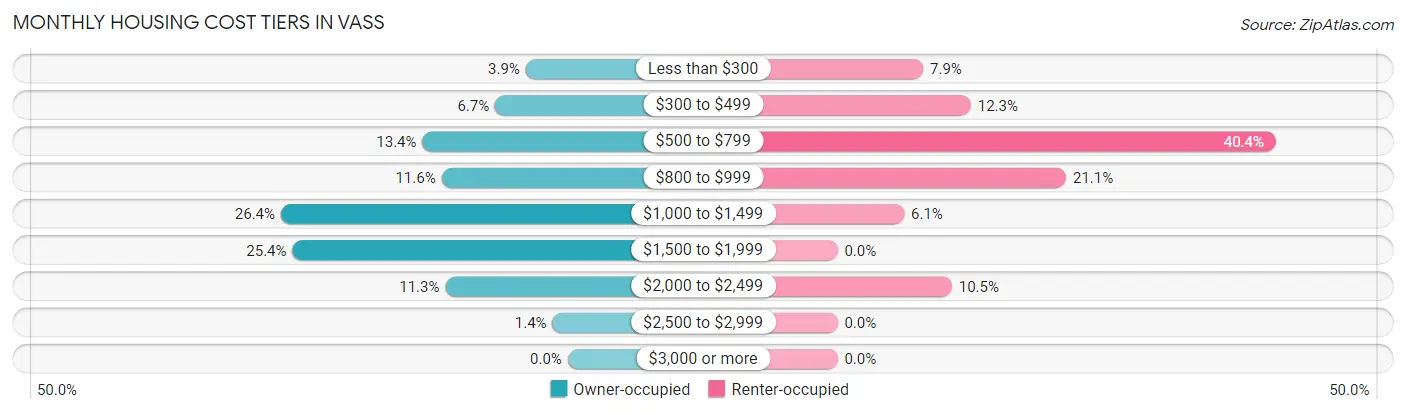
| Monthly Cost | Owner-occupied | Renter-occupied |
| Less than $300 | 11 (3.9%) | 9 (7.9%) |
| $300 to $499 | 19 (6.7%) | 14 (12.3%) |
| $500 to $799 | 38 (13.4%) | 46 (40.4%) |
| $800 to $999 | 33 (11.6%) | 24 (21.0%) |
| $1,000 to $1,499 | 75 (26.4%) | 7 (6.1%) |
| $1,500 to $1,999 | 72 (25.4%) | 0 (0.0%) |
| $2,000 to $2,499 | 32 (11.3%) | 12 (10.5%) |
| $2,500 to $2,999 | 4 (1.4%) | 0 (0.0%) |
| $3,000 or more | 0 (0.0%) | 0 (0.0%) |
| Total | 284 (100.0%) | 114 (100.0%) |
Physical Housing Characteristics in Vass
Housing Structures in Vass
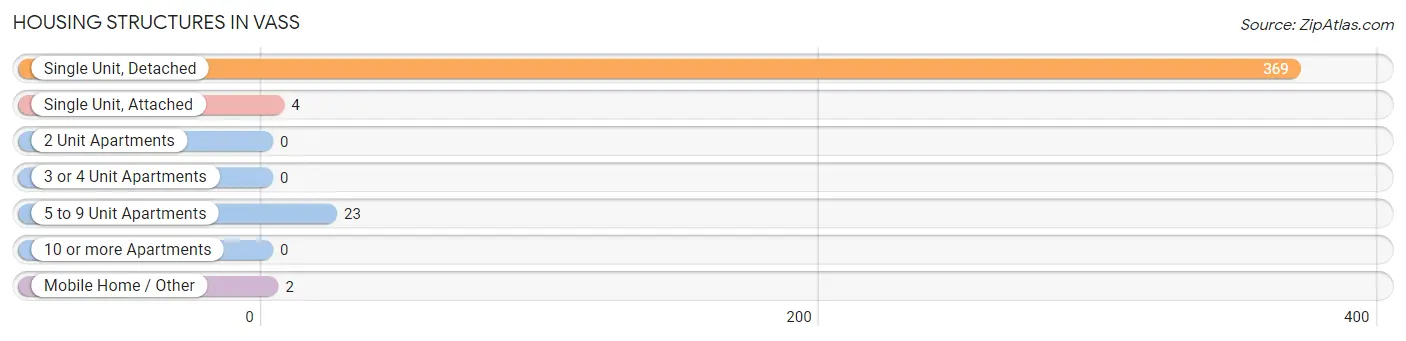
| Structure Type | # Housing Units | % Housing Units |
| Single Unit, Detached | 369 | 92.7% |
| Single Unit, Attached | 4 | 1.0% |
| 2 Unit Apartments | 0 | 0.0% |
| 3 or 4 Unit Apartments | 0 | 0.0% |
| 5 to 9 Unit Apartments | 23 | 5.8% |
| 10 or more Apartments | 0 | 0.0% |
| Mobile Home / Other | 2 | 0.5% |
| Total | 398 | 100.0% |
Housing Structures by Occupancy in Vass
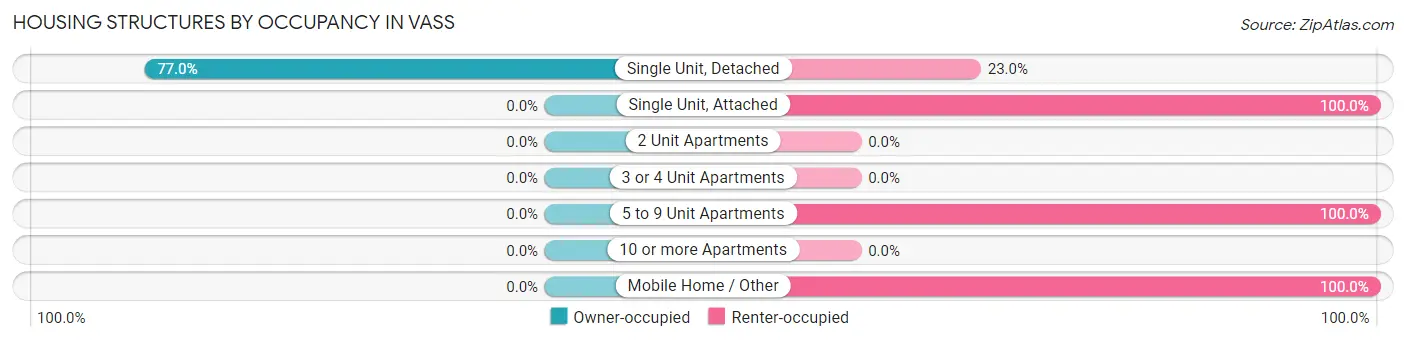
| Structure Type | Owner-occupied | Renter-occupied |
| Single Unit, Detached | 284 (77.0%) | 85 (23.0%) |
| Single Unit, Attached | 0 (0.0%) | 4 (100.0%) |
| 2 Unit Apartments | 0 (0.0%) | 0 (0.0%) |
| 3 or 4 Unit Apartments | 0 (0.0%) | 0 (0.0%) |
| 5 to 9 Unit Apartments | 0 (0.0%) | 23 (100.0%) |
| 10 or more Apartments | 0 (0.0%) | 0 (0.0%) |
| Mobile Home / Other | 0 (0.0%) | 2 (100.0%) |
| Total | 284 (71.4%) | 114 (28.6%) |
Housing Structures by Number of Rooms in Vass
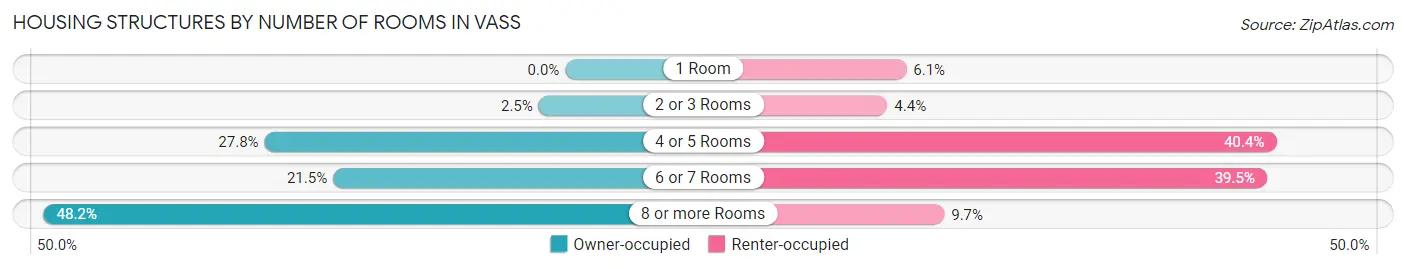
| Number of Rooms | Owner-occupied | Renter-occupied |
| 1 Room | 0 (0.0%) | 7 (6.1%) |
| 2 or 3 Rooms | 7 (2.5%) | 5 (4.4%) |
| 4 or 5 Rooms | 79 (27.8%) | 46 (40.4%) |
| 6 or 7 Rooms | 61 (21.5%) | 45 (39.5%) |
| 8 or more Rooms | 137 (48.2%) | 11 (9.7%) |
| Total | 284 (100.0%) | 114 (100.0%) |
Housing Structure by Heating Type in Vass
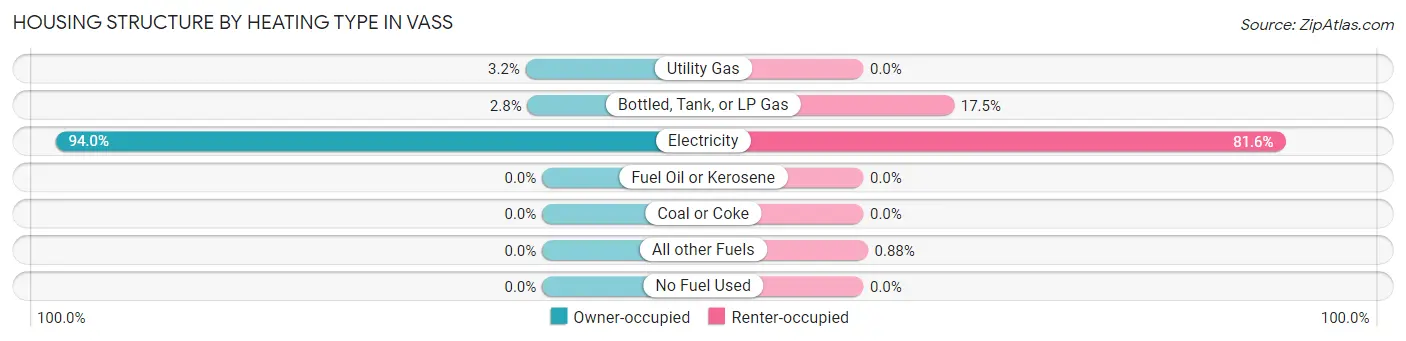
| Heating Type | Owner-occupied | Renter-occupied |
| Utility Gas | 9 (3.2%) | 0 (0.0%) |
| Bottled, Tank, or LP Gas | 8 (2.8%) | 20 (17.5%) |
| Electricity | 267 (94.0%) | 93 (81.6%) |
| Fuel Oil or Kerosene | 0 (0.0%) | 0 (0.0%) |
| Coal or Coke | 0 (0.0%) | 0 (0.0%) |
| All other Fuels | 0 (0.0%) | 1 (0.9%) |
| No Fuel Used | 0 (0.0%) | 0 (0.0%) |
| Total | 284 (100.0%) | 114 (100.0%) |
Household Vehicle Usage in Vass
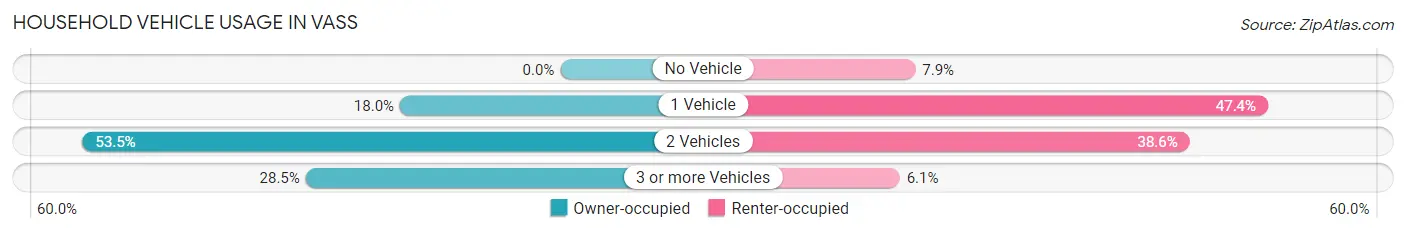
| Vehicles per Household | Owner-occupied | Renter-occupied |
| No Vehicle | 0 (0.0%) | 9 (7.9%) |
| 1 Vehicle | 51 (18.0%) | 54 (47.4%) |
| 2 Vehicles | 152 (53.5%) | 44 (38.6%) |
| 3 or more Vehicles | 81 (28.5%) | 7 (6.1%) |
| Total | 284 (100.0%) | 114 (100.0%) |
Real Estate & Mortgages in Vass
Real Estate and Mortgage Overview in Vass
| Characteristic | Without Mortgage | With Mortgage |
| Housing Units | 63 | 221 |
| Median Property Value | $99,600 | $269,400 |
| Median Household Income | $36,964 | $31 |
| Monthly Housing Costs | $509 | $0 |
| Real Estate Taxes | $763 | $14 |
Property Value by Mortgage Status in Vass
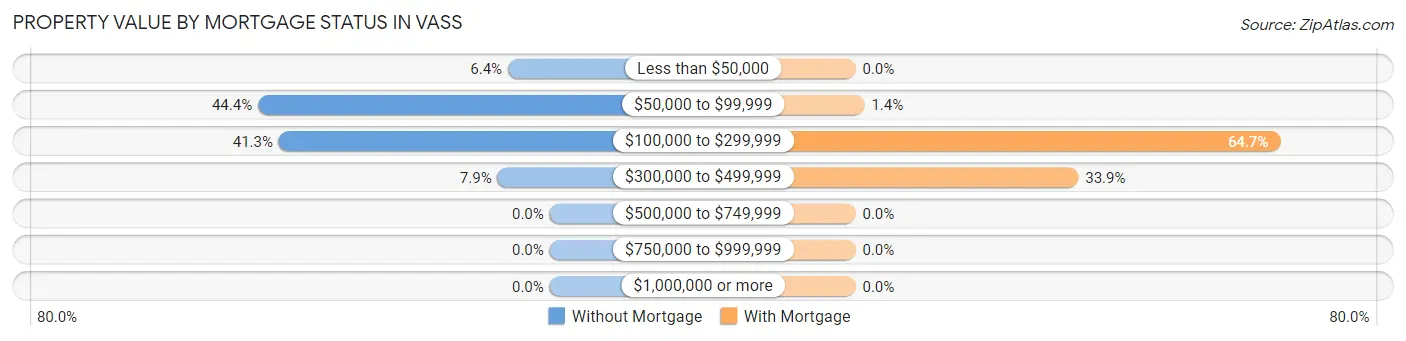
| Property Value | Without Mortgage | With Mortgage |
| Less than $50,000 | 4 (6.4%) | 0 (0.0%) |
| $50,000 to $99,999 | 28 (44.4%) | 3 (1.4%) |
| $100,000 to $299,999 | 26 (41.3%) | 143 (64.7%) |
| $300,000 to $499,999 | 5 (7.9%) | 75 (33.9%) |
| $500,000 to $749,999 | 0 (0.0%) | 0 (0.0%) |
| $750,000 to $999,999 | 0 (0.0%) | 0 (0.0%) |
| $1,000,000 or more | 0 (0.0%) | 0 (0.0%) |
| Total | 63 (100.0%) | 221 (100.0%) |
Household Income by Mortgage Status in Vass
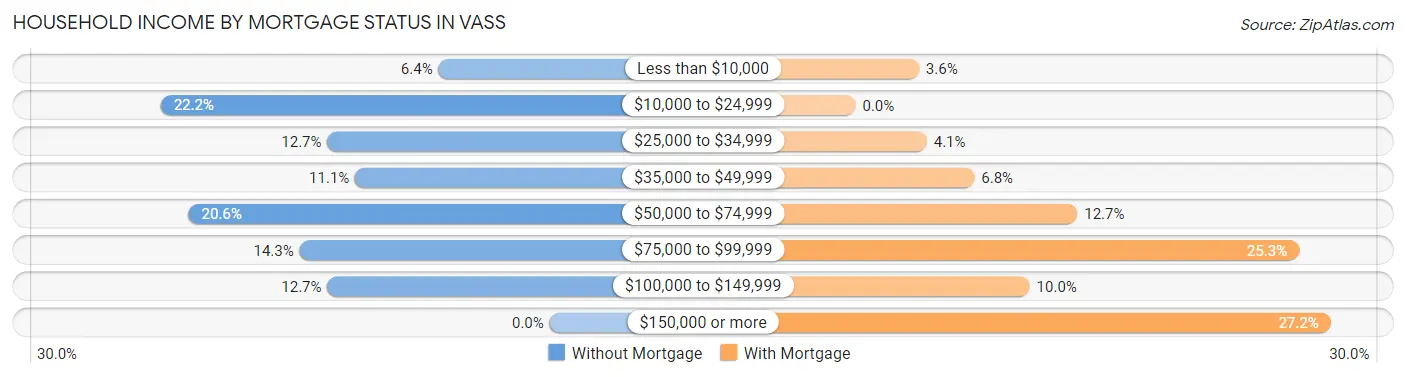
| Household Income | Without Mortgage | With Mortgage |
| Less than $10,000 | 4 (6.4%) | 8 (3.6%) |
| $10,000 to $24,999 | 14 (22.2%) | 0 (0.0%) |
| $25,000 to $34,999 | 8 (12.7%) | 9 (4.1%) |
| $35,000 to $49,999 | 7 (11.1%) | 15 (6.8%) |
| $50,000 to $74,999 | 13 (20.6%) | 28 (12.7%) |
| $75,000 to $99,999 | 9 (14.3%) | 56 (25.3%) |
| $100,000 to $149,999 | 8 (12.7%) | 22 (10.0%) |
| $150,000 or more | 0 (0.0%) | 60 (27.2%) |
| Total | 63 (100.0%) | 221 (100.0%) |
Property Value to Household Income Ratio in Vass
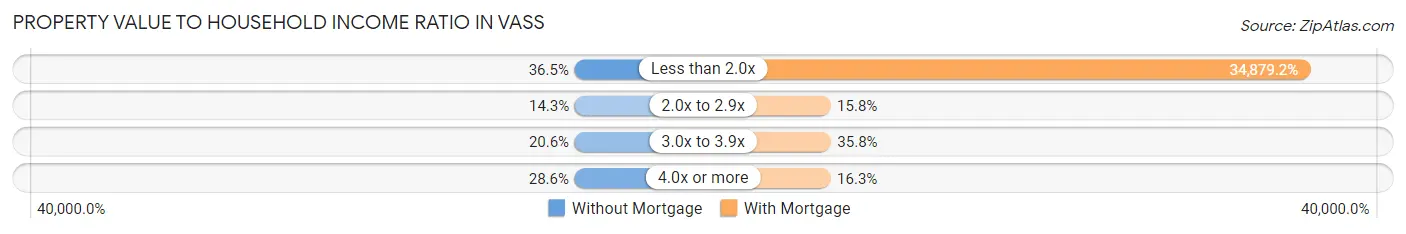
| Value-to-Income Ratio | Without Mortgage | With Mortgage |
| Less than 2.0x | 23 (36.5%) | 77,083 (34,879.2%) |
| 2.0x to 2.9x | 9 (14.3%) | 35 (15.8%) |
| 3.0x to 3.9x | 13 (20.6%) | 79 (35.7%) |
| 4.0x or more | 18 (28.6%) | 36 (16.3%) |
| Total | 63 (100.0%) | 221 (100.0%) |
Real Estate Taxes by Mortgage Status in Vass
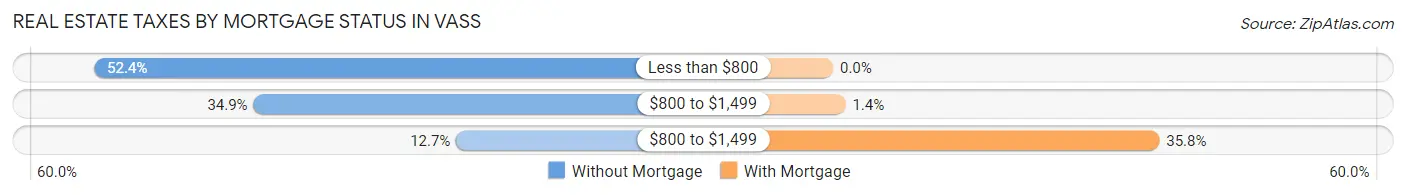
| Property Taxes | Without Mortgage | With Mortgage |
| Less than $800 | 33 (52.4%) | 0 (0.0%) |
| $800 to $1,499 | 22 (34.9%) | 3 (1.4%) |
| $800 to $1,499 | 8 (12.7%) | 79 (35.7%) |
| Total | 63 (100.0%) | 221 (100.0%) |
Health & Disability in Vass
Health Insurance Coverage by Age in Vass
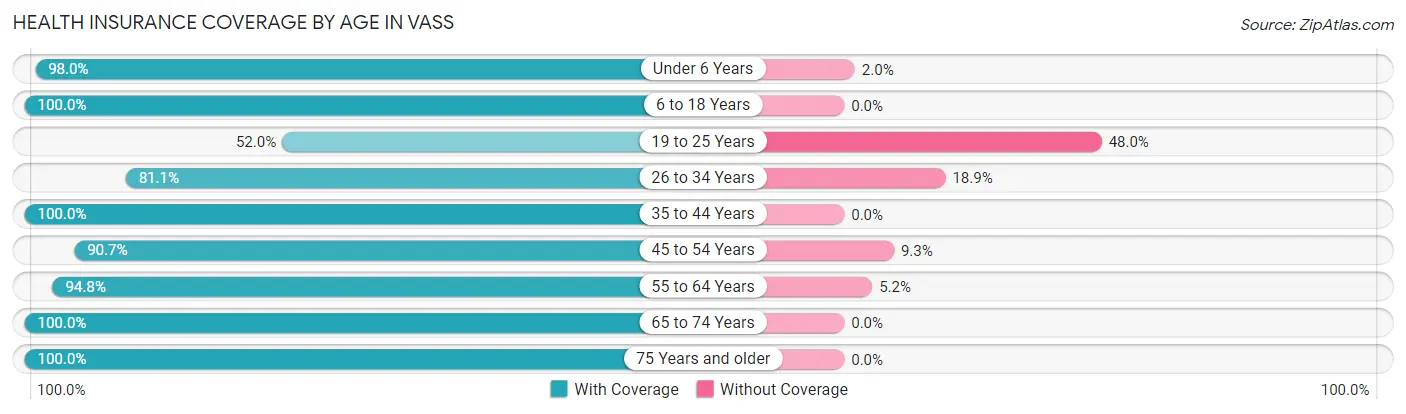
| Age Bracket | With Coverage | Without Coverage |
| Under 6 Years | 198 (98.0%) | 4 (2.0%) |
| 6 to 18 Years | 327 (100.0%) | 0 (0.0%) |
| 19 to 25 Years | 39 (52.0%) | 36 (48.0%) |
| 26 to 34 Years | 86 (81.1%) | 20 (18.9%) |
| 35 to 44 Years | 118 (100.0%) | 0 (0.0%) |
| 45 to 54 Years | 49 (90.7%) | 5 (9.3%) |
| 55 to 64 Years | 91 (94.8%) | 5 (5.2%) |
| 65 to 74 Years | 71 (100.0%) | 0 (0.0%) |
| 75 Years and older | 53 (100.0%) | 0 (0.0%) |
| Total | 1,032 (93.6%) | 70 (6.4%) |
Health Insurance Coverage by Citizenship Status in Vass
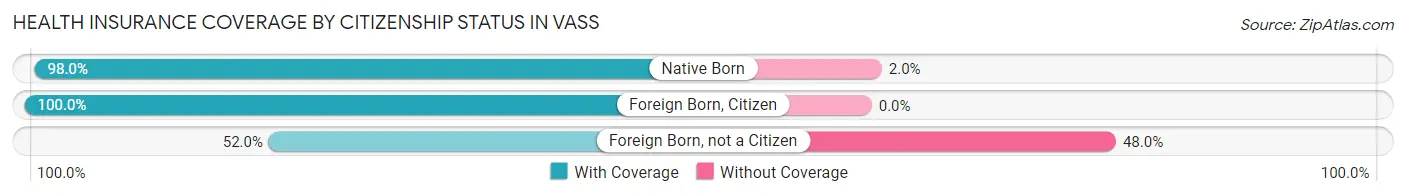
| Citizenship Status | With Coverage | Without Coverage |
| Native Born | 198 (98.0%) | 4 (2.0%) |
| Foreign Born, Citizen | 327 (100.0%) | 0 (0.0%) |
| Foreign Born, not a Citizen | 39 (52.0%) | 36 (48.0%) |
Health Insurance Coverage by Household Income in Vass
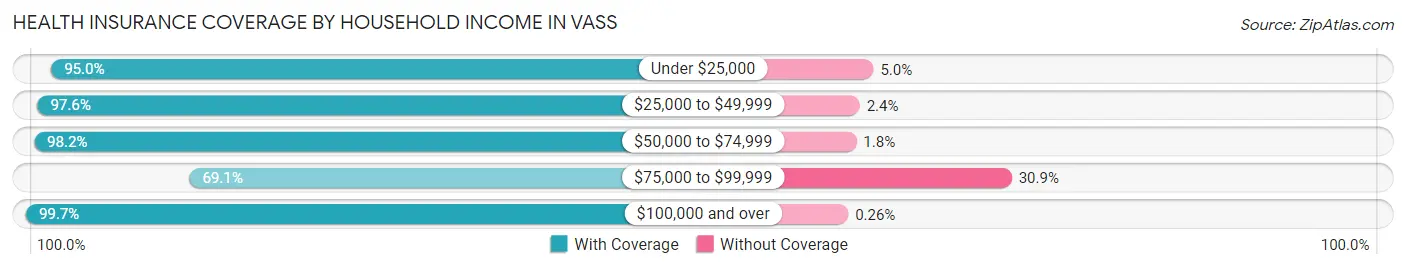
| Household Income | With Coverage | Without Coverage |
| Under $25,000 | 76 (95.0%) | 4 (5.0%) |
| $25,000 to $49,999 | 282 (97.6%) | 7 (2.4%) |
| $50,000 to $74,999 | 164 (98.2%) | 3 (1.8%) |
| $75,000 to $99,999 | 123 (69.1%) | 55 (30.9%) |
| $100,000 and over | 387 (99.7%) | 1 (0.3%) |
Public vs Private Health Insurance Coverage by Age in Vass
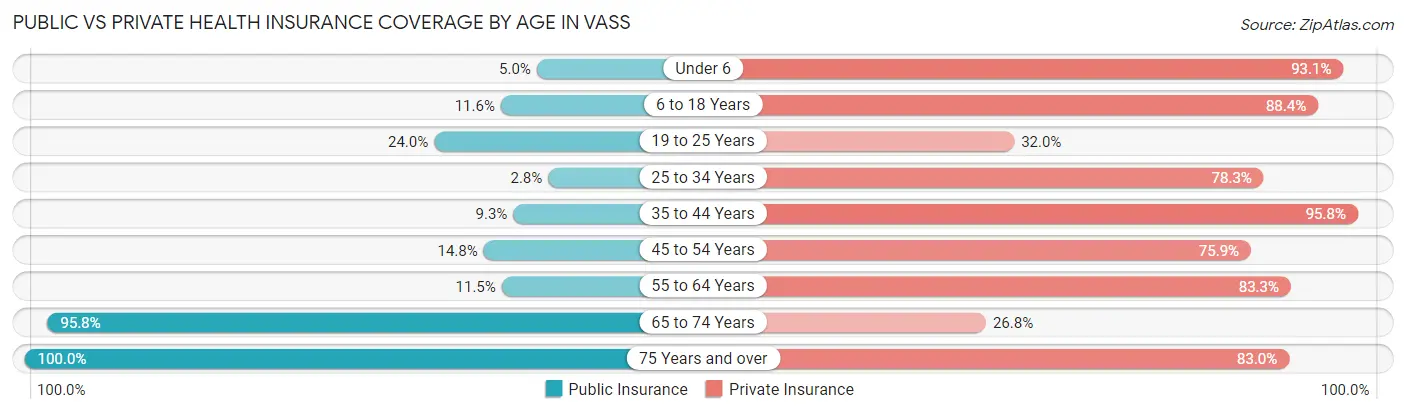
| Age Bracket | Public Insurance | Private Insurance |
| Under 6 | 10 (5.0%) | 188 (93.1%) |
| 6 to 18 Years | 38 (11.6%) | 289 (88.4%) |
| 19 to 25 Years | 18 (24.0%) | 24 (32.0%) |
| 25 to 34 Years | 3 (2.8%) | 83 (78.3%) |
| 35 to 44 Years | 11 (9.3%) | 113 (95.8%) |
| 45 to 54 Years | 8 (14.8%) | 41 (75.9%) |
| 55 to 64 Years | 11 (11.5%) | 80 (83.3%) |
| 65 to 74 Years | 68 (95.8%) | 19 (26.8%) |
| 75 Years and over | 53 (100.0%) | 44 (83.0%) |
| Total | 220 (20.0%) | 881 (79.9%) |
Disability Status by Sex by Age in Vass
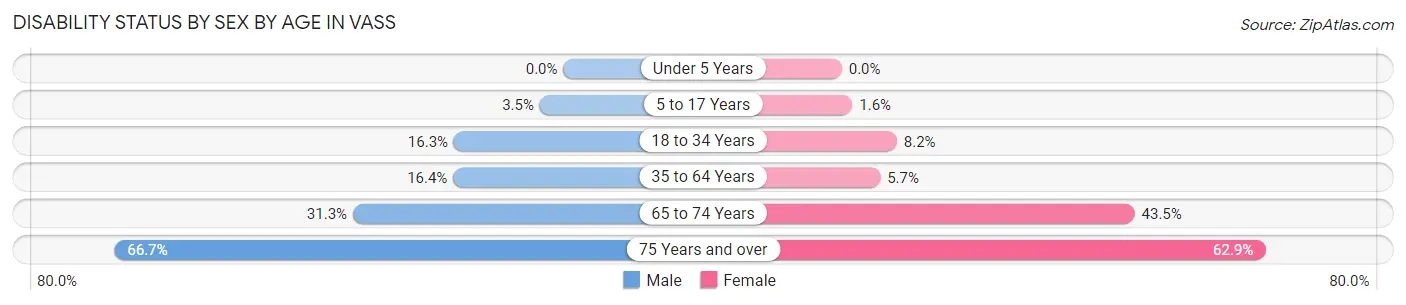
| Age Bracket | Male | Female |
| Under 5 Years | 0 (0.0%) | 0 (0.0%) |
| 5 to 17 Years | 5 (3.5%) | 3 (1.6%) |
| 18 to 34 Years | 13 (16.3%) | 9 (8.2%) |
| 35 to 64 Years | 18 (16.4%) | 9 (5.7%) |
| 65 to 74 Years | 15 (31.2%) | 10 (43.5%) |
| 75 Years and over | 12 (66.7%) | 22 (62.9%) |
Disability Class by Sex by Age in Vass
Disability Class: Hearing Difficulty
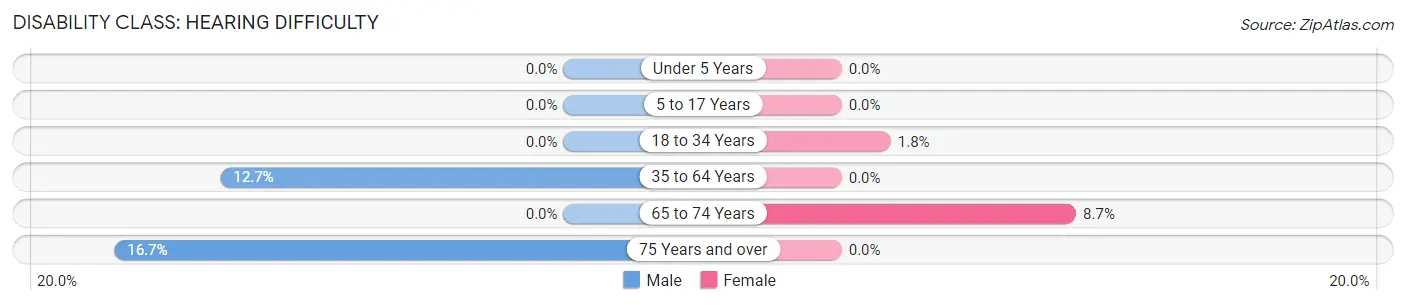
| Age Bracket | Male | Female |
| Under 5 Years | 0 (0.0%) | 0 (0.0%) |
| 5 to 17 Years | 0 (0.0%) | 0 (0.0%) |
| 18 to 34 Years | 0 (0.0%) | 2 (1.8%) |
| 35 to 64 Years | 14 (12.7%) | 0 (0.0%) |
| 65 to 74 Years | 0 (0.0%) | 2 (8.7%) |
| 75 Years and over | 3 (16.7%) | 0 (0.0%) |
Disability Class: Vision Difficulty
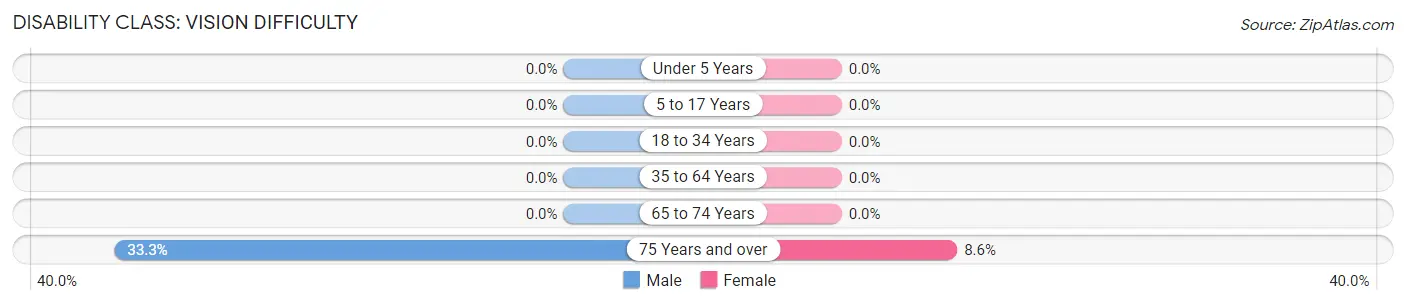
| Age Bracket | Male | Female |
| Under 5 Years | 0 (0.0%) | 0 (0.0%) |
| 5 to 17 Years | 0 (0.0%) | 0 (0.0%) |
| 18 to 34 Years | 0 (0.0%) | 0 (0.0%) |
| 35 to 64 Years | 0 (0.0%) | 0 (0.0%) |
| 65 to 74 Years | 0 (0.0%) | 0 (0.0%) |
| 75 Years and over | 6 (33.3%) | 3 (8.6%) |
Disability Class: Cognitive Difficulty
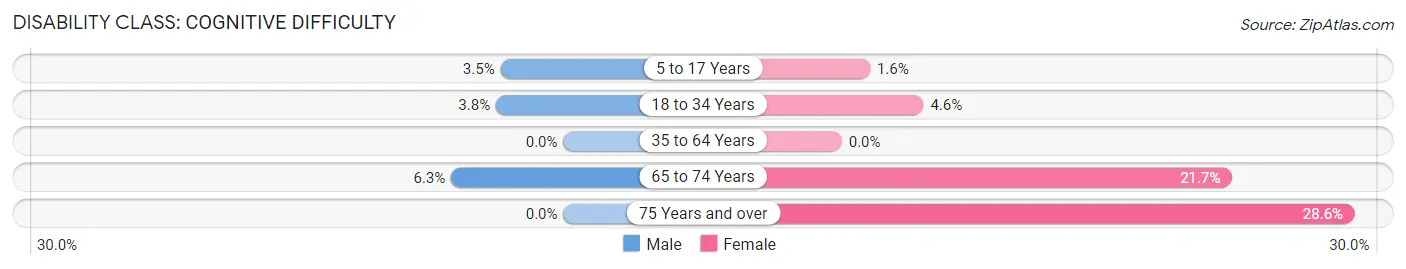
| Age Bracket | Male | Female |
| 5 to 17 Years | 5 (3.5%) | 3 (1.6%) |
| 18 to 34 Years | 3 (3.7%) | 5 (4.5%) |
| 35 to 64 Years | 0 (0.0%) | 0 (0.0%) |
| 65 to 74 Years | 3 (6.2%) | 5 (21.7%) |
| 75 Years and over | 0 (0.0%) | 10 (28.6%) |
Disability Class: Ambulatory Difficulty
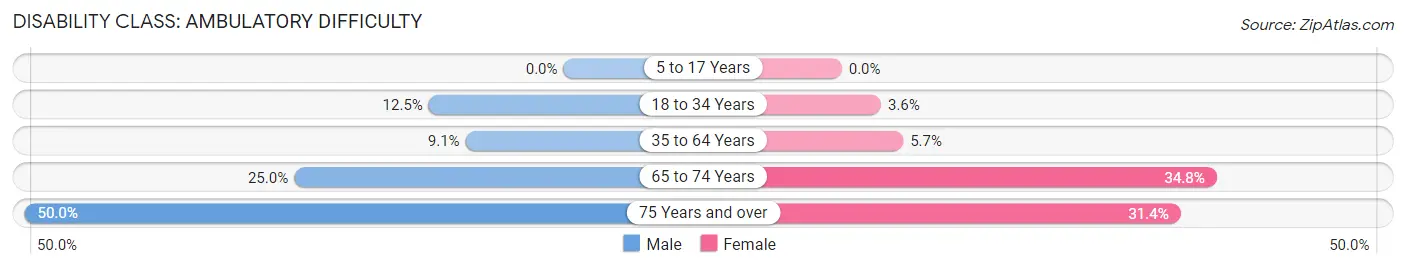
| Age Bracket | Male | Female |
| 5 to 17 Years | 0 (0.0%) | 0 (0.0%) |
| 18 to 34 Years | 10 (12.5%) | 4 (3.6%) |
| 35 to 64 Years | 10 (9.1%) | 9 (5.7%) |
| 65 to 74 Years | 12 (25.0%) | 8 (34.8%) |
| 75 Years and over | 9 (50.0%) | 11 (31.4%) |
Disability Class: Self-Care Difficulty
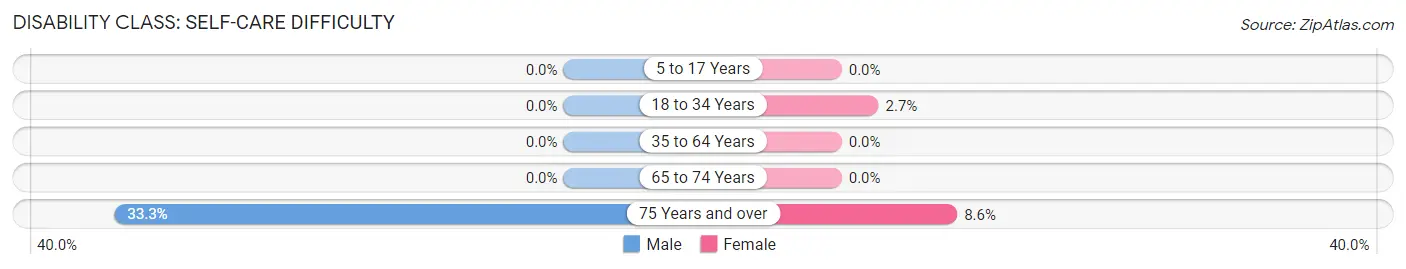
| Age Bracket | Male | Female |
| 5 to 17 Years | 0 (0.0%) | 0 (0.0%) |
| 18 to 34 Years | 0 (0.0%) | 3 (2.7%) |
| 35 to 64 Years | 0 (0.0%) | 0 (0.0%) |
| 65 to 74 Years | 0 (0.0%) | 0 (0.0%) |
| 75 Years and over | 6 (33.3%) | 3 (8.6%) |
Technology Access in Vass
Computing Device Access in Vass
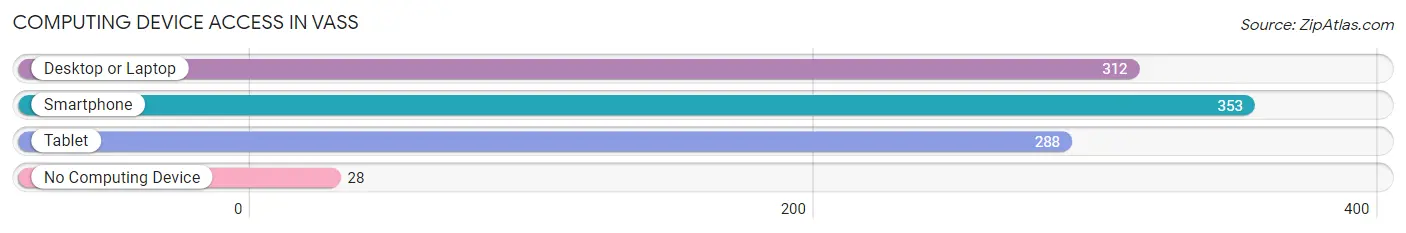
| Device Type | # Households | % Households |
| Desktop or Laptop | 312 | 78.4% |
| Smartphone | 353 | 88.7% |
| Tablet | 288 | 72.4% |
| No Computing Device | 28 | 7.0% |
| Total | 398 | 100.0% |
Internet Access in Vass
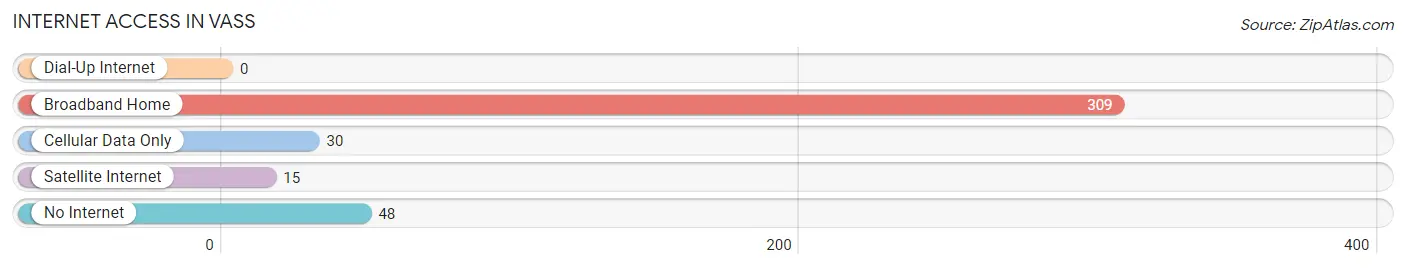
| Internet Type | # Households | % Households |
| Dial-Up Internet | 0 | 0.0% |
| Broadband Home | 309 | 77.6% |
| Cellular Data Only | 30 | 7.5% |
| Satellite Internet | 15 | 3.8% |
| No Internet | 48 | 12.1% |
| Total | 398 | 100.0% |
Vass Summary
Vass, North Carolina is a small town located in Moore County, in the central part of the state. It is situated about 20 miles south of the city of Fayetteville and about 40 miles north of the state capital, Raleigh. The town has a population of approximately 1,500 people and is part of the Fayetteville Metropolitan Statistical Area.
History
Vass was founded in 1887 by a group of settlers from Scotland. The town was named after the Scottish town of Vass, which is located in the county of Aberdeenshire. The settlers were attracted to the area due to its fertile soil and abundant timber resources. The town quickly grew and by the early 1900s, it had become a thriving community with a variety of businesses, including a sawmill, a grist mill, a cotton gin, and a general store.
In the early 1900s, the town was also home to a number of churches, including the First Presbyterian Church, which was founded in 1891. The church is still active today and is the oldest church in Vass.
Geography
Vass is located in the Sandhills region of North Carolina, which is characterized by rolling hills and sandy soils. The town is situated on the banks of the Little River, which is a tributary of the Cape Fear River. The town is surrounded by a number of small lakes, including Lake Vass, which is located just south of the town.
The town is located in a humid subtropical climate zone, which is characterized by hot, humid summers and mild winters. The average annual temperature is around 70 degrees Fahrenheit, with the average high temperature in the summer months reaching into the mid-80s.
Economy
The economy of Vass is largely based on agriculture and forestry. The town is home to a number of farms, which produce a variety of crops, including corn, soybeans, and cotton. The town is also home to a number of timber companies, which harvest the area’s abundant pine and hardwood forests.
In addition to agriculture and forestry, the town is also home to a number of small businesses, including restaurants, retail stores, and service providers. The town is also home to a number of manufacturing companies, which produce a variety of products, including furniture, textiles, and paper products.
Demographics
As of the 2010 census, the population of Vass was 1,521. The racial makeup of the town was 94.3% White, 2.7% African American, 0.3% Native American, 0.7% Asian, 0.1% Pacific Islander, and 1.9% from other races. The median household income was $37,917, and the median family income was $45,938.
The town is served by the Moore County School District, which includes two elementary schools, one middle school, and one high school. The town is also home to a number of private schools, including the Vass Christian Academy and the Vass Academy of Arts and Sciences.
Conclusion
Vass, North Carolina is a small town located in Moore County, in the central part of the state. It is situated about 20 miles south of the city of Fayetteville and about 40 miles north of the state capital, Raleigh. The town has a population of approximately 1,500 people and is part of the Fayetteville Metropolitan Statistical Area. The town was founded in 1887 by a group of settlers from Scotland and is situated on the banks of the Little River. The economy of Vass is largely based on agriculture and forestry, and the town is served by the Moore County School District. The racial makeup of the town is 94.3% White, 2.7% African American, 0.3% Native American, 0.7% Asian, 0.1% Pacific Islander, and 1.9% from other races. The median household income was $37,917, and the median family income was $45,938.
Common Questions
What is Per Capita Income in Vass?
Per Capita income in Vass is $26,973.
What is the Median Family Income in Vass?
Median Family Income in Vass is $77,083.
What is the Median Household income in Vass?
Median Household Income in Vass is $59,375.
What is Income or Wage Gap in Vass?
Income or Wage Gap in Vass is 19.6%.
Women in Vass earn 80.4 cents for every dollar earned by a man.
What is Family Income Deficit in Vass?
Family Income Deficit in Vass is $8,016.
Families that are below poverty line in Vass earn $8,016 less on average than the poverty threshold level.
What is Inequality or Gini Index in Vass?
Inequality or Gini Index in Vass is 0.39.
What is the Total Population of Vass?
Total Population of Vass is 1,276.
What is the Total Male Population of Vass?
Total Male Population of Vass is 678.
What is the Total Female Population of Vass?
Total Female Population of Vass is 598.
What is the Ratio of Males per 100 Females in Vass?
There are 113.38 Males per 100 Females in Vass.
What is the Ratio of Females per 100 Males in Vass?
There are 88.20 Females per 100 Males in Vass.
What is the Median Population Age in Vass?
Median Population Age in Vass is 29.0 Years.
What is the Average Family Size in Vass
Average Family Size in Vass is 4.2 People.
What is the Average Household Size in Vass
Average Household Size in Vass is 3.2 People.
How Large is the Labor Force in Vass?
There are 573 People in the Labor Forcein in Vass.
What is the Percentage of People in the Labor Force in Vass?
73.9% of People are in the Labor Force in Vass.
What is the Unemployment Rate in Vass?
Unemployment Rate in Vass is 2.3%.