King, NC Map & Demographics
King Map
King Overview
$37,456
PER CAPITA INCOME
$78,996
AVG FAMILY INCOME
$59,770
AVG HOUSEHOLD INCOME
35.1%
WAGE / INCOME GAP [ % ]
64.9¢/ $1
WAGE / INCOME GAP [ $ ]
0.48
INEQUALITY / GINI INDEX
7,210
TOTAL POPULATION
3,203
MALE POPULATION
4,007
FEMALE POPULATION
79.94
MALES / 100 FEMALES
125.10
FEMALES / 100 MALES
43.7
MEDIAN AGE
3.0
AVG FAMILY SIZE
2.3
AVG HOUSEHOLD SIZE
3,194
LABOR FORCE [ PEOPLE ]
54.6%
PERCENT IN LABOR FORCE
2.1%
UNEMPLOYMENT RATE
King Zip Codes
King Area Codes
Income in King
Income Overview in King
Per Capita Income in King is $37,456, while median incomes of families and households are $78,996 and $59,770 respectively.
| Characteristic | Number | Measure |
| Per Capita Income | 7,210 | $37,456 |
| Median Family Income | 1,928 | $78,996 |
| Mean Family Income | 1,928 | $103,178 |
| Median Household Income | 3,004 | $59,770 |
| Mean Household Income | 3,004 | $86,360 |
| Income Deficit | 1,928 | $0 |
| Wage / Income Gap (%) | 7,210 | 35.13% |
| Wage / Income Gap ($) | 7,210 | 64.87¢ per $1 |
| Gini / Inequality Index | 7,210 | 0.48 |
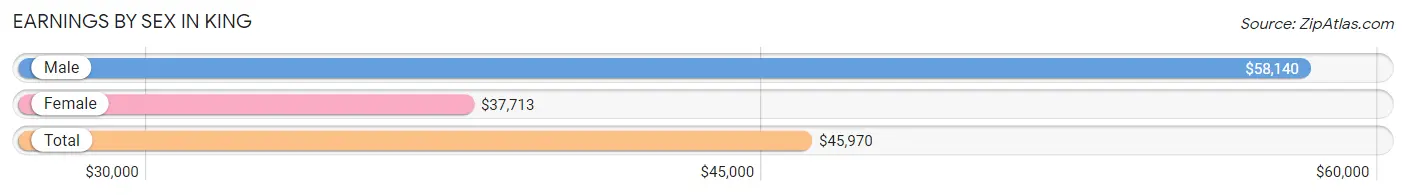
Earnings by Sex in King
Average Earnings in King are $45,970, $58,140 for men and $37,713 for women, a difference of 35.1%.
| Sex | Number | Average Earnings |
| Male | 1,465 (44.5%) | $58,140 |
| Female | 1,830 (55.5%) | $37,713 |
| Total | 3,295 (100.0%) | $45,970 |
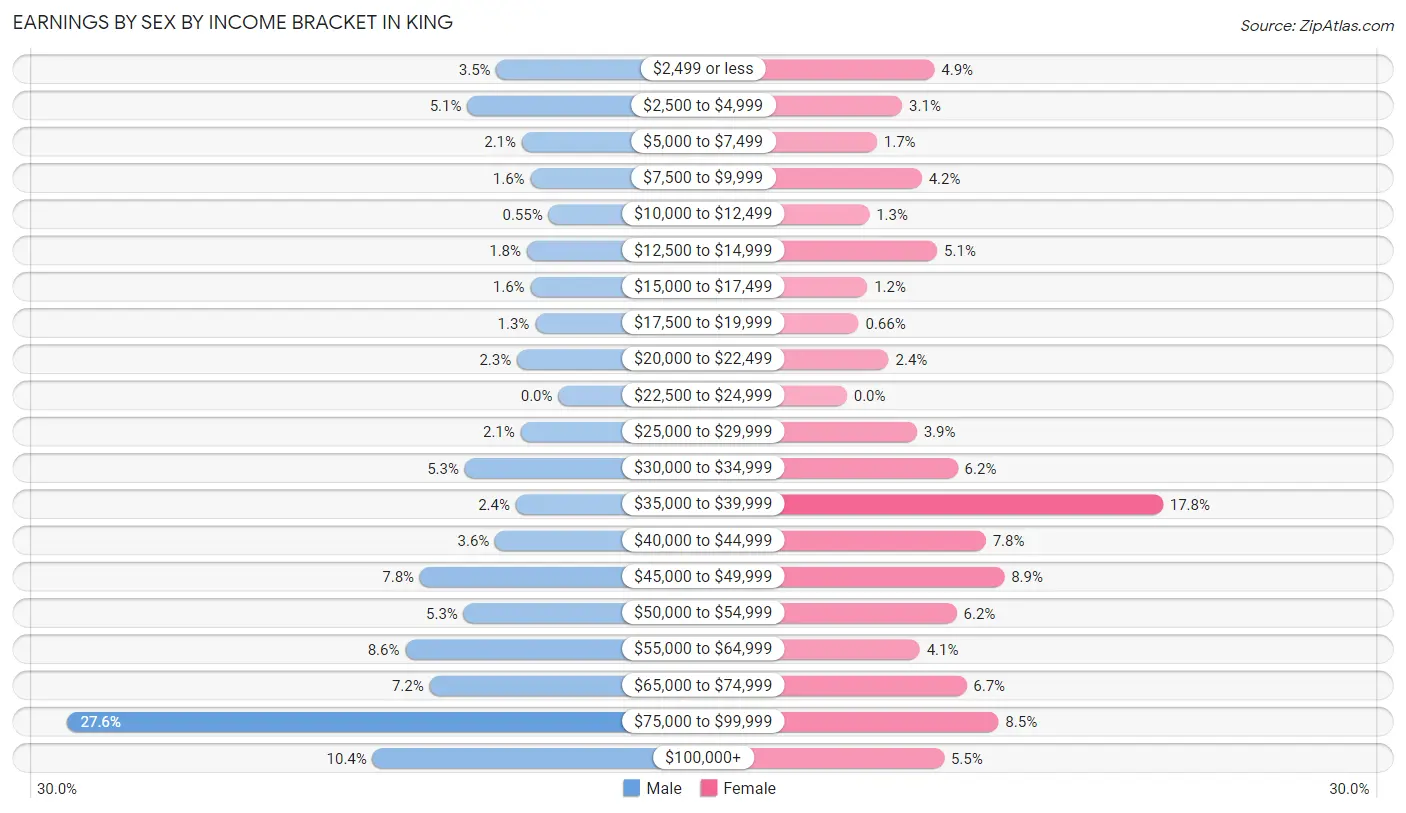
Earnings by Sex by Income Bracket in King
The most common earnings brackets in King are $75,000 to $99,999 for men (404 | 27.6%) and $35,000 to $39,999 for women (325 | 17.8%).
| Income | Male | Female |
| $2,499 or less | 51 (3.5%) | 90 (4.9%) |
| $2,500 to $4,999 | 75 (5.1%) | 57 (3.1%) |
| $5,000 to $7,499 | 30 (2.1%) | 31 (1.7%) |
| $7,500 to $9,999 | 23 (1.6%) | 77 (4.2%) |
| $10,000 to $12,499 | 8 (0.5%) | 23 (1.3%) |
| $12,500 to $14,999 | 26 (1.8%) | 93 (5.1%) |
| $15,000 to $17,499 | 23 (1.6%) | 21 (1.1%) |
| $17,500 to $19,999 | 19 (1.3%) | 12 (0.7%) |
| $20,000 to $22,499 | 34 (2.3%) | 43 (2.4%) |
| $22,500 to $24,999 | 0 (0.0%) | 0 (0.0%) |
| $25,000 to $29,999 | 31 (2.1%) | 72 (3.9%) |
| $30,000 to $34,999 | 77 (5.3%) | 114 (6.2%) |
| $35,000 to $39,999 | 35 (2.4%) | 325 (17.8%) |
| $40,000 to $44,999 | 52 (3.5%) | 143 (7.8%) |
| $45,000 to $49,999 | 114 (7.8%) | 162 (8.8%) |
| $50,000 to $54,999 | 78 (5.3%) | 113 (6.2%) |
| $55,000 to $64,999 | 126 (8.6%) | 75 (4.1%) |
| $65,000 to $74,999 | 106 (7.2%) | 123 (6.7%) |
| $75,000 to $99,999 | 404 (27.6%) | 156 (8.5%) |
| $100,000+ | 153 (10.4%) | 100 (5.5%) |
| Total | 1,465 (100.0%) | 1,830 (100.0%) |
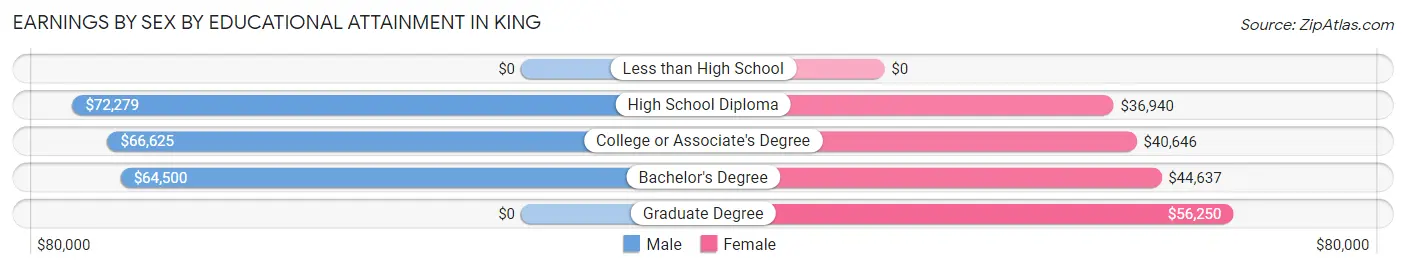
Earnings by Sex by Educational Attainment in King
Average earnings in King are $70,563 for men and $41,604 for women, a difference of 41.0%. Men with an educational attainment of high school diploma enjoy the highest average annual earnings of $72,279, while those with bachelor's degree education earn the least with $64,500. Women with an educational attainment of graduate degree earn the most with the average annual earnings of $56,250, while those with high school diploma education have the smallest earnings of $36,940.
| Educational Attainment | Male Income | Female Income |
| Less than High School | - | - |
| High School Diploma | $72,279 | $36,940 |
| College or Associate's Degree | $66,625 | $40,646 |
| Bachelor's Degree | $64,500 | $44,637 |
| Graduate Degree | - | - |
| Total | $70,563 | $41,604 |
Family Income in King
Family Income Brackets in King
According to the King family income data, there are 391 families falling into the $35,000 to $49,999 income range, which is the most common income bracket and makes up 20.3% of all families.
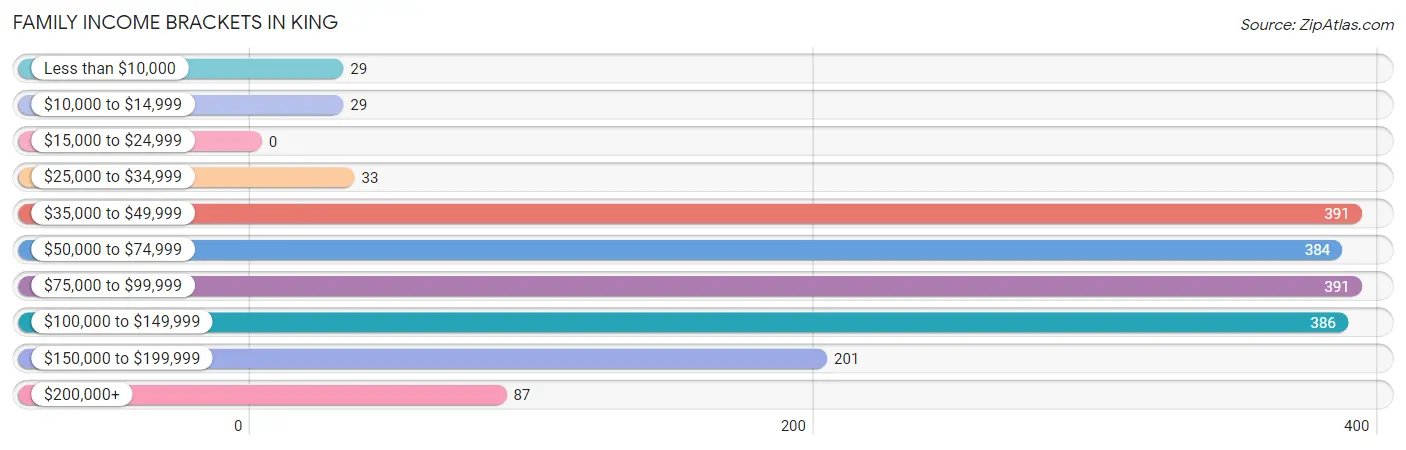
| Income Bracket | # Families | % Families |
| Less than $10,000 | 29 | 1.5% |
| $10,000 to $14,999 | 29 | 1.5% |
| $15,000 to $24,999 | 0 | 0.0% |
| $25,000 to $34,999 | 33 | 1.7% |
| $35,000 to $49,999 | 391 | 20.3% |
| $50,000 to $74,999 | 384 | 19.9% |
| $75,000 to $99,999 | 391 | 20.3% |
| $100,000 to $149,999 | 386 | 20.0% |
| $150,000 to $199,999 | 201 | 10.4% |
| $200,000+ | 87 | 4.5% |
Family Income by Famaliy Size in King
6-person families (64 | 3.3%) account for the highest median family income in King with $118,897 per family, while 2-person families (802 | 41.6%) have the highest median income of $38,906 per family member.
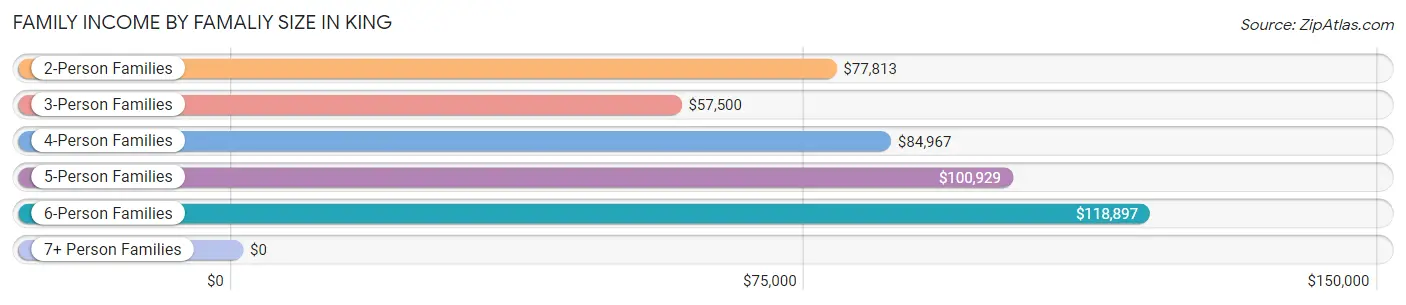
| Income Bracket | # Families | Median Income |
| 2-Person Families | 802 (41.6%) | $77,813 |
| 3-Person Families | 614 (31.9%) | $57,500 |
| 4-Person Families | 266 (13.8%) | $84,967 |
| 5-Person Families | 182 (9.4%) | $100,929 |
| 6-Person Families | 64 (3.3%) | $118,897 |
| 7+ Person Families | 0 (0.0%) | $0 |
| Total | 1,928 (100.0%) | $78,996 |
Family Income by Number of Earners in King
The median family income in King is $78,996, with families comprising 3+ earners (199) having the highest median family income of $150,792, while families with 1 earner (682) have the lowest median family income of $46,364, accounting for 10.3% and 35.4% of families, respectively.
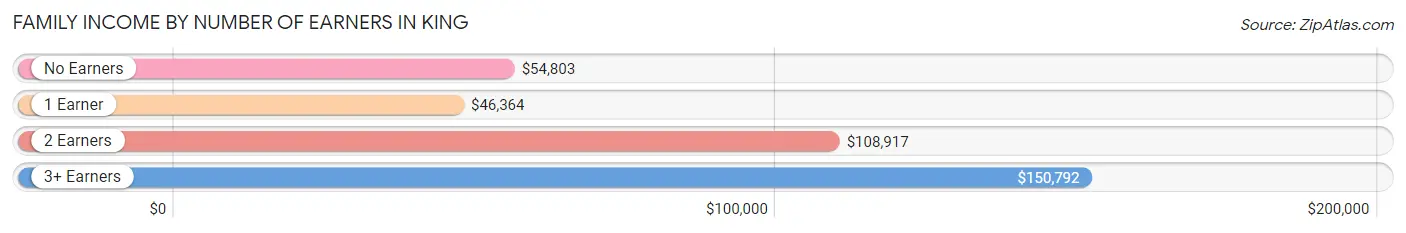
| Number of Earners | # Families | Median Income |
| No Earners | 321 (16.7%) | $54,803 |
| 1 Earner | 682 (35.4%) | $46,364 |
| 2 Earners | 726 (37.7%) | $108,917 |
| 3+ Earners | 199 (10.3%) | $150,792 |
| Total | 1,928 (100.0%) | $78,996 |
Household Income in King
Household Income Brackets in King
With 619 households falling in the category, the $35,000 to $49,999 income range is the most frequent in King, accounting for 20.6% of all households. In contrast, only 78 households (2.6%) fall into the $10,000 to $14,999 income bracket, making it the least populous group.
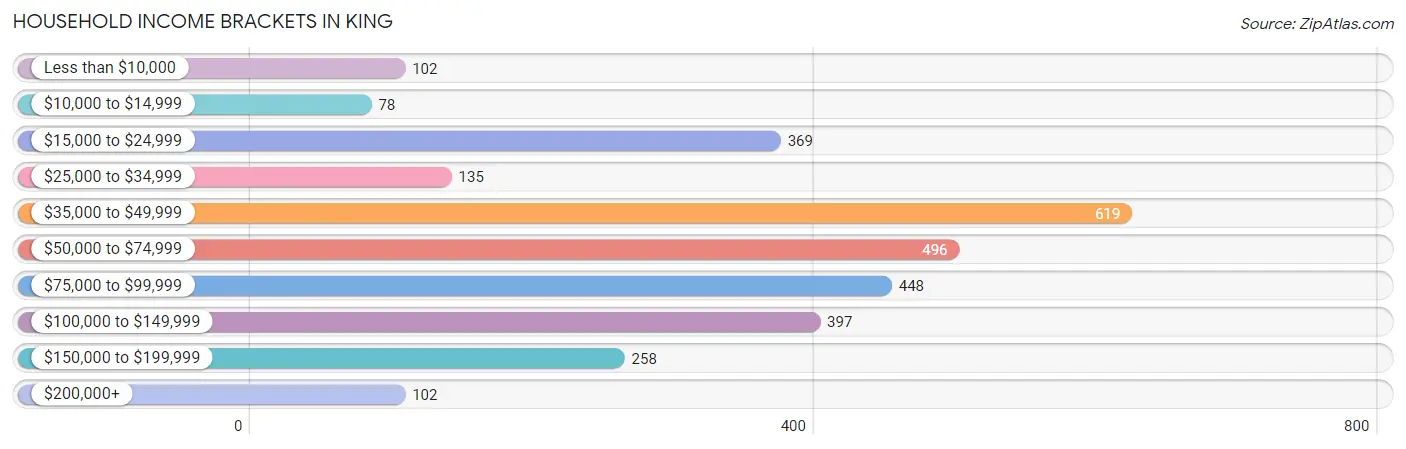
| Income Bracket | # Households | % Households |
| Less than $10,000 | 102 | 3.4% |
| $10,000 to $14,999 | 78 | 2.6% |
| $15,000 to $24,999 | 369 | 12.3% |
| $25,000 to $34,999 | 135 | 4.5% |
| $35,000 to $49,999 | 619 | 20.6% |
| $50,000 to $74,999 | 496 | 16.5% |
| $75,000 to $99,999 | 448 | 14.9% |
| $100,000 to $149,999 | 397 | 13.2% |
| $150,000 to $199,999 | 258 | 8.6% |
| $200,000+ | 102 | 3.4% |
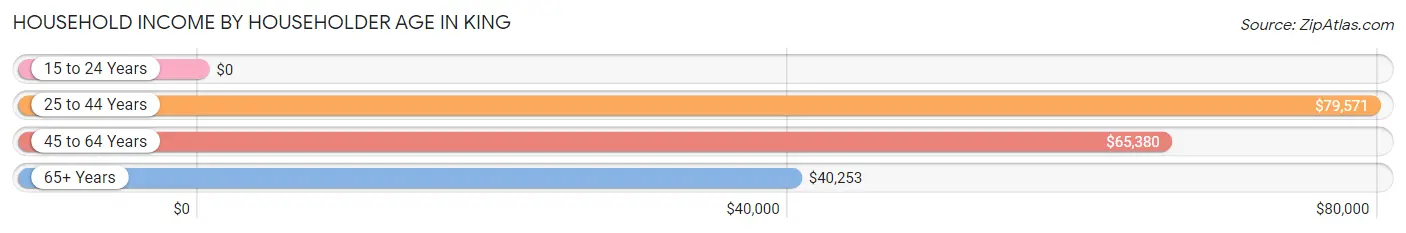
Household Income by Householder Age in King
The median household income in King is $59,770, with the highest median household income of $79,571 found in the 25 to 44 years age bracket for the primary householder. A total of 1,038 households (34.5%) fall into this category. Meanwhile, the 15 to 24 years age bracket for the primary householder has the lowest median household income of $0, with 11 households (0.4%) in this group.
| Income Bracket | # Households | Median Income |
| 15 to 24 Years | 11 (0.4%) | $0 |
| 25 to 44 Years | 1,038 (34.5%) | $79,571 |
| 45 to 64 Years | 948 (31.6%) | $65,380 |
| 65+ Years | 1,007 (33.5%) | $40,253 |
| Total | 3,004 (100.0%) | $59,770 |
Poverty in King
Income Below Poverty by Sex and Age in King
With 3.1% poverty level for males and 6.5% for females among the residents of King, 15 year old males and 65 to 74 year old females are the most vulnerable to poverty, with 16 males (50.0%) and 67 females (16.9%) in their respective age groups living below the poverty level.
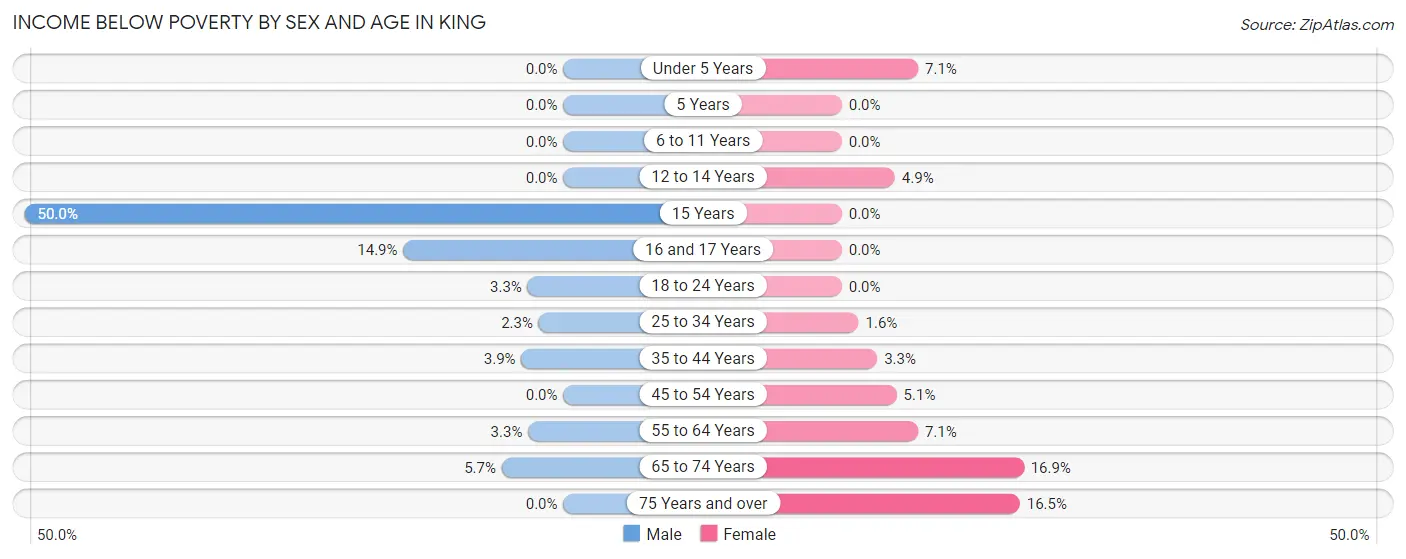
| Age Bracket | Male | Female |
| Under 5 Years | 0 (0.0%) | 15 (7.1%) |
| 5 Years | 0 (0.0%) | 0 (0.0%) |
| 6 to 11 Years | 0 (0.0%) | 0 (0.0%) |
| 12 to 14 Years | 0 (0.0%) | 15 (4.9%) |
| 15 Years | 16 (50.0%) | 0 (0.0%) |
| 16 and 17 Years | 15 (14.8%) | 0 (0.0%) |
| 18 to 24 Years | 9 (3.3%) | 0 (0.0%) |
| 25 to 34 Years | 6 (2.3%) | 6 (1.6%) |
| 35 to 44 Years | 17 (3.9%) | 15 (3.3%) |
| 45 to 54 Years | 0 (0.0%) | 29 (5.1%) |
| 55 to 64 Years | 18 (3.3%) | 29 (7.1%) |
| 65 to 74 Years | 14 (5.7%) | 67 (16.9%) |
| 75 Years and over | 0 (0.0%) | 74 (16.5%) |
| Total | 95 (3.1%) | 250 (6.5%) |
Income Above Poverty by Sex and Age in King
According to the poverty statistics in King, males aged under 5 years and females aged 5 years are the age groups that are most secure financially, with 100.0% of males and 100.0% of females in these age groups living above the poverty line.
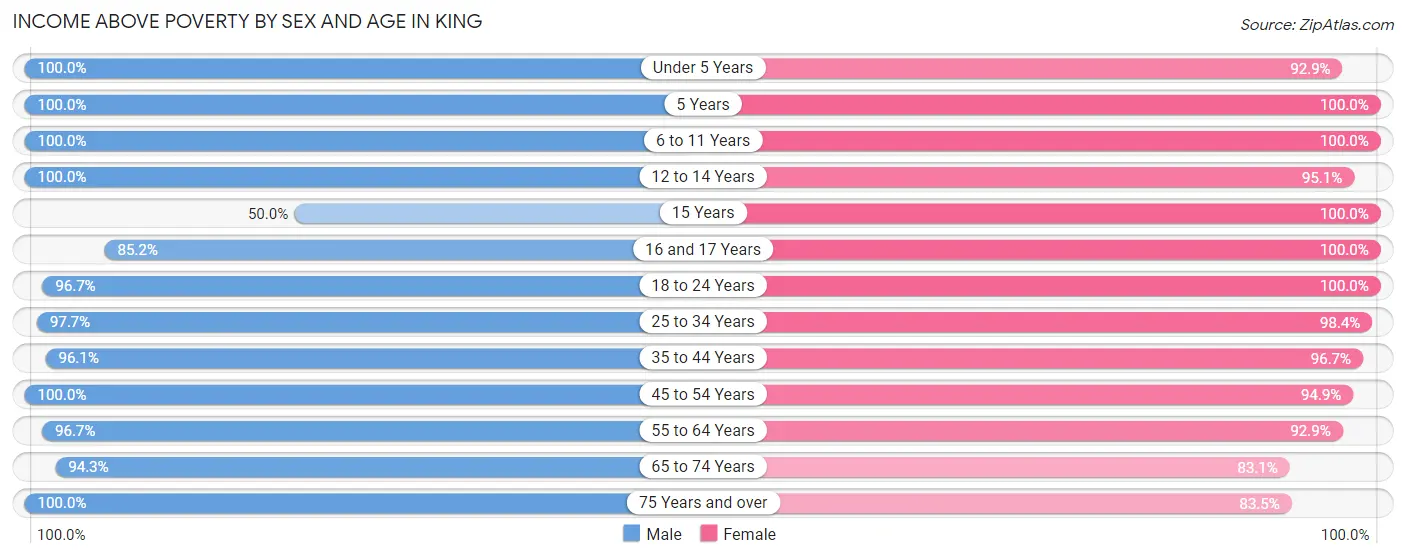
| Age Bracket | Male | Female |
| Under 5 Years | 180 (100.0%) | 197 (92.9%) |
| 5 Years | 67 (100.0%) | 9 (100.0%) |
| 6 to 11 Years | 194 (100.0%) | 193 (100.0%) |
| 12 to 14 Years | 80 (100.0%) | 289 (95.1%) |
| 15 Years | 16 (50.0%) | 90 (100.0%) |
| 16 and 17 Years | 86 (85.2%) | 99 (100.0%) |
| 18 to 24 Years | 263 (96.7%) | 289 (100.0%) |
| 25 to 34 Years | 257 (97.7%) | 378 (98.4%) |
| 35 to 44 Years | 420 (96.1%) | 441 (96.7%) |
| 45 to 54 Years | 357 (100.0%) | 541 (94.9%) |
| 55 to 64 Years | 534 (96.7%) | 381 (92.9%) |
| 65 to 74 Years | 231 (94.3%) | 330 (83.1%) |
| 75 Years and over | 309 (100.0%) | 374 (83.5%) |
| Total | 2,994 (96.9%) | 3,611 (93.5%) |
Income Below Poverty Among Married-Couple Families in King
The poverty statistics for married-couple families in King show that 1.9% or 29 of the total 1,538 families live below the poverty line. Families with 1 or 2 children have the highest poverty rate of 2.8%, comprising of 15 families. On the other hand, families with 3 or 4 children have the lowest poverty rate of 0.0%, which includes 0 families.
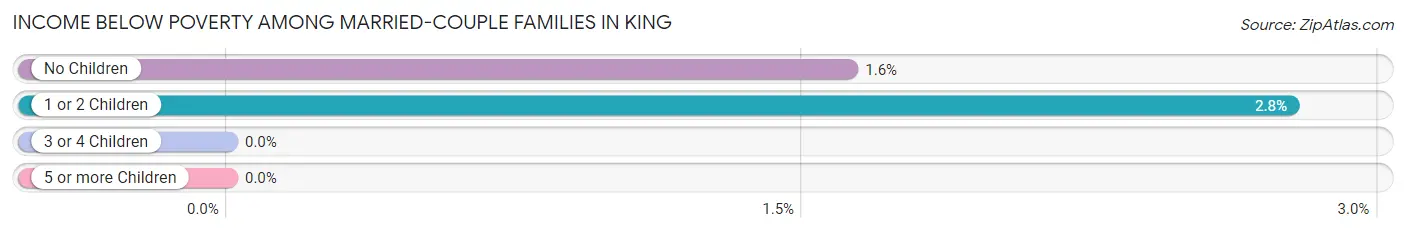
| Children | Above Poverty | Below Poverty |
| No Children | 850 (98.4%) | 14 (1.6%) |
| 1 or 2 Children | 526 (97.2%) | 15 (2.8%) |
| 3 or 4 Children | 133 (100.0%) | 0 (0.0%) |
| 5 or more Children | 0 (0.0%) | 0 (0.0%) |
| Total | 1,509 (98.1%) | 29 (1.9%) |
Income Below Poverty Among Single-Parent Households in King
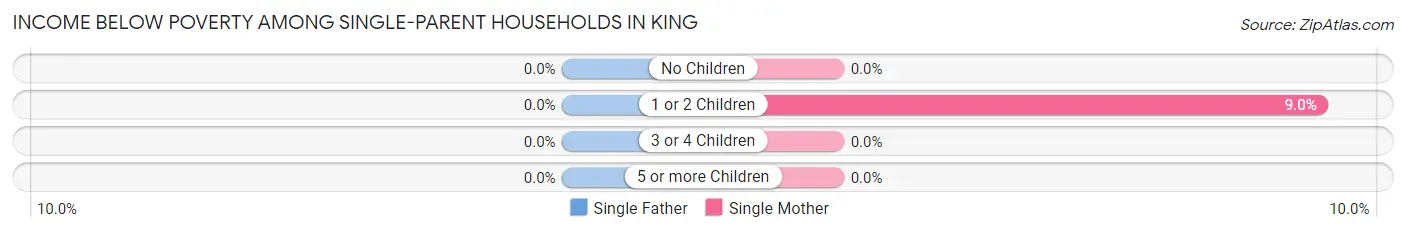
| Children | Single Father | Single Mother |
| No Children | 0 (0.0%) | 0 (0.0%) |
| 1 or 2 Children | 0 (0.0%) | 29 (9.0%) |
| 3 or 4 Children | 0 (0.0%) | 0 (0.0%) |
| 5 or more Children | 0 (0.0%) | 0 (0.0%) |
| Total | 0 (0.0%) | 29 (7.4%) |
Income Below Poverty Among Married-Couple vs Single-Parent Households in King
The poverty data for King shows that 29 of the married-couple family households (1.9%) and 29 of the single-parent households (7.4%) are living below the poverty level. Within the married-couple family households, those with 1 or 2 children have the highest poverty rate, with 15 households (2.8%) falling below the poverty line. Among the single-parent households, those with 1 or 2 children have the highest poverty rate, with 29 household (9.0%) living below poverty.
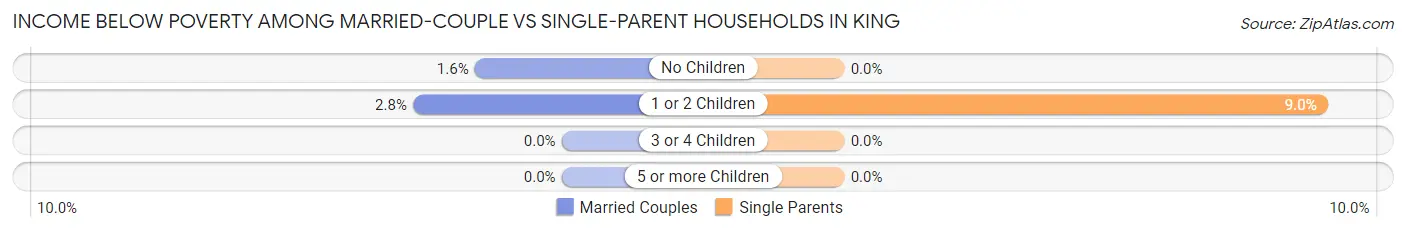
| Children | Married-Couple Families | Single-Parent Households |
| No Children | 14 (1.6%) | 0 (0.0%) |
| 1 or 2 Children | 15 (2.8%) | 29 (9.0%) |
| 3 or 4 Children | 0 (0.0%) | 0 (0.0%) |
| 5 or more Children | 0 (0.0%) | 0 (0.0%) |
| Total | 29 (1.9%) | 29 (7.4%) |
Race in King
The most populous races in King are White / Caucasian (6,510 | 90.3%), Two or more Races (315 | 4.4%), and Hispanic or Latino (295 | 4.1%).
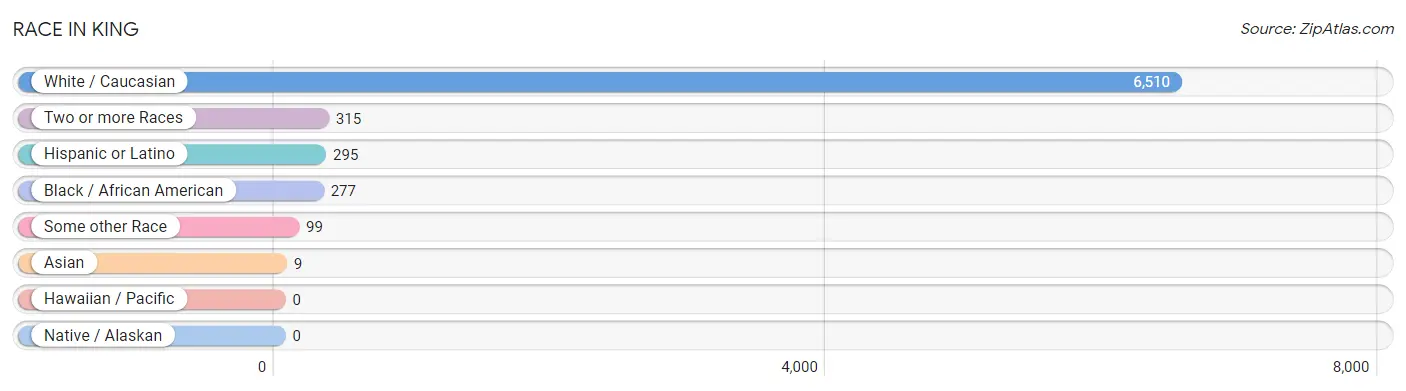
| Race | # Population | % Population |
| Asian | 9 | 0.1% |
| Black / African American | 277 | 3.8% |
| Hawaiian / Pacific | 0 | 0.0% |
| Hispanic or Latino | 295 | 4.1% |
| Native / Alaskan | 0 | 0.0% |
| White / Caucasian | 6,510 | 90.3% |
| Two or more Races | 315 | 4.4% |
| Some other Race | 99 | 1.4% |
| Total | 7,210 | 100.0% |
Ancestry in King
The most populous ancestries reported in King are English (1,577 | 21.9%), American (774 | 10.7%), Irish (578 | 8.0%), German (558 | 7.7%), and Puerto Rican (267 | 3.7%), together accounting for 52.1% of all King residents.
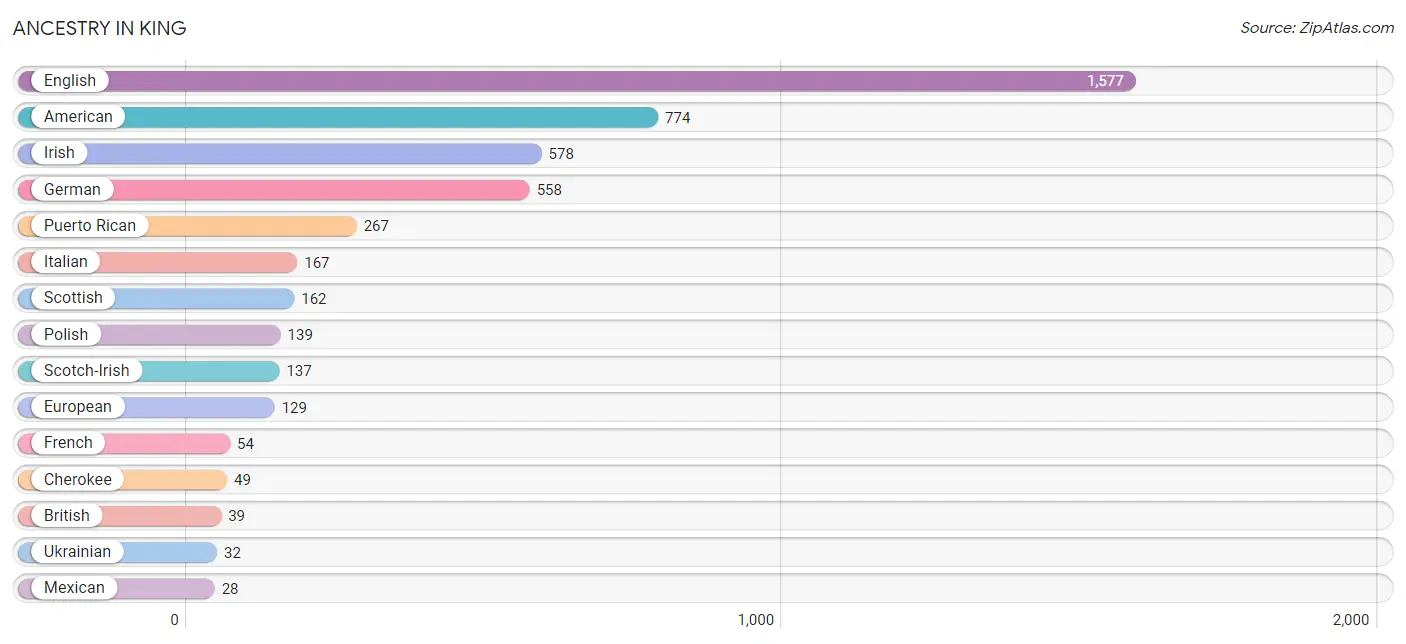
| Ancestry | # Population | % Population |
| American | 774 | 10.7% |
| British | 39 | 0.5% |
| Burmese | 1 | 0.0% |
| Canadian | 11 | 0.2% |
| Cherokee | 49 | 0.7% |
| Dutch West Indian | 7 | 0.1% |
| English | 1,577 | 21.9% |
| European | 129 | 1.8% |
| French | 54 | 0.7% |
| French Canadian | 14 | 0.2% |
| German | 558 | 7.7% |
| Irish | 578 | 8.0% |
| Italian | 167 | 2.3% |
| Korean | 8 | 0.1% |
| Latvian | 10 | 0.1% |
| Mexican | 28 | 0.4% |
| Polish | 139 | 1.9% |
| Puerto Rican | 267 | 3.7% |
| Romanian | 6 | 0.1% |
| Scandinavian | 15 | 0.2% |
| Scotch-Irish | 137 | 1.9% |
| Scottish | 162 | 2.2% |
| Ukrainian | 32 | 0.4% |
| Welsh | 4 | 0.1% |
| Yugoslavian | 17 | 0.2% | View All 25 Rows |
Immigrants in King
The most numerous immigrant groups reported in King came from Europe (37 | 0.5%), England (31 | 0.4%), Northern Europe (31 | 0.4%), Asia (9 | 0.1%), and Philippines (8 | 0.1%), together accounting for 1.6% of all King residents.
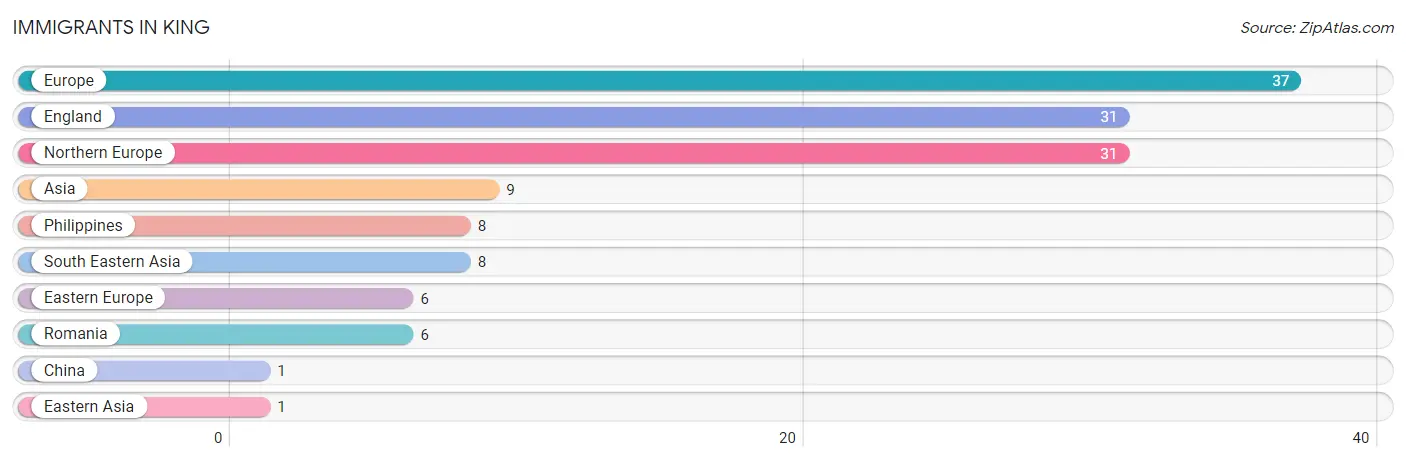
| Immigration Origin | # Population | % Population |
| Asia | 9 | 0.1% |
| China | 1 | 0.0% |
| Eastern Asia | 1 | 0.0% |
| Eastern Europe | 6 | 0.1% |
| England | 31 | 0.4% |
| Europe | 37 | 0.5% |
| Northern Europe | 31 | 0.4% |
| Philippines | 8 | 0.1% |
| Romania | 6 | 0.1% |
| South Eastern Asia | 8 | 0.1% | View All 10 Rows |
Sex and Age in King
Sex and Age in King
The most populous age groups in King are 60 to 64 Years (384 | 12.0%) for men and 10 to 14 Years (380 | 9.5%) for women.
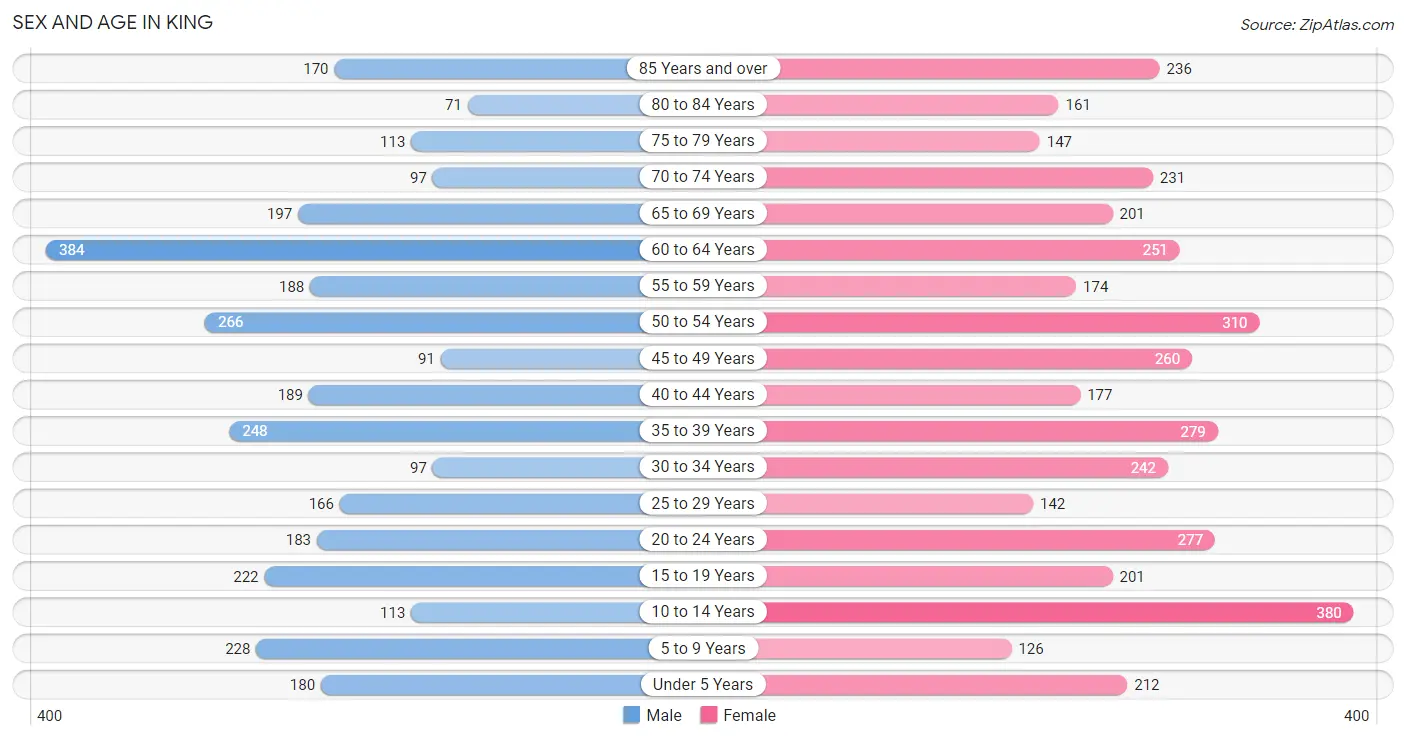
| Age Bracket | Male | Female |
| Under 5 Years | 180 (5.6%) | 212 (5.3%) |
| 5 to 9 Years | 228 (7.1%) | 126 (3.1%) |
| 10 to 14 Years | 113 (3.5%) | 380 (9.5%) |
| 15 to 19 Years | 222 (6.9%) | 201 (5.0%) |
| 20 to 24 Years | 183 (5.7%) | 277 (6.9%) |
| 25 to 29 Years | 166 (5.2%) | 142 (3.5%) |
| 30 to 34 Years | 97 (3.0%) | 242 (6.0%) |
| 35 to 39 Years | 248 (7.7%) | 279 (7.0%) |
| 40 to 44 Years | 189 (5.9%) | 177 (4.4%) |
| 45 to 49 Years | 91 (2.8%) | 260 (6.5%) |
| 50 to 54 Years | 266 (8.3%) | 310 (7.7%) |
| 55 to 59 Years | 188 (5.9%) | 174 (4.3%) |
| 60 to 64 Years | 384 (12.0%) | 251 (6.3%) |
| 65 to 69 Years | 197 (6.1%) | 201 (5.0%) |
| 70 to 74 Years | 97 (3.0%) | 231 (5.8%) |
| 75 to 79 Years | 113 (3.5%) | 147 (3.7%) |
| 80 to 84 Years | 71 (2.2%) | 161 (4.0%) |
| 85 Years and over | 170 (5.3%) | 236 (5.9%) |
| Total | 3,203 (100.0%) | 4,007 (100.0%) |
Families and Households in King
Median Family Size in King
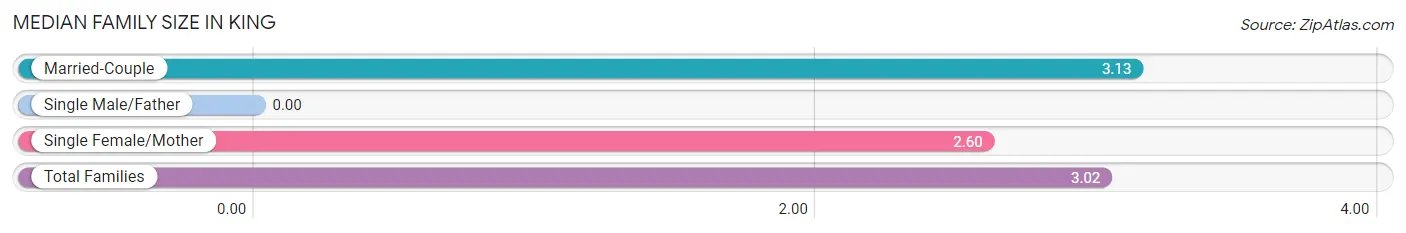
| Family Type | # Families | Family Size |
| Married-Couple | 1,538 (79.8%) | 3.13 |
| Single Male/Father | 0 (0.0%) | - |
| Single Female/Mother | 390 (20.2%) | 2.60 |
| Total Families | 1,928 (100.0%) | 3.02 |
Median Household Size in King
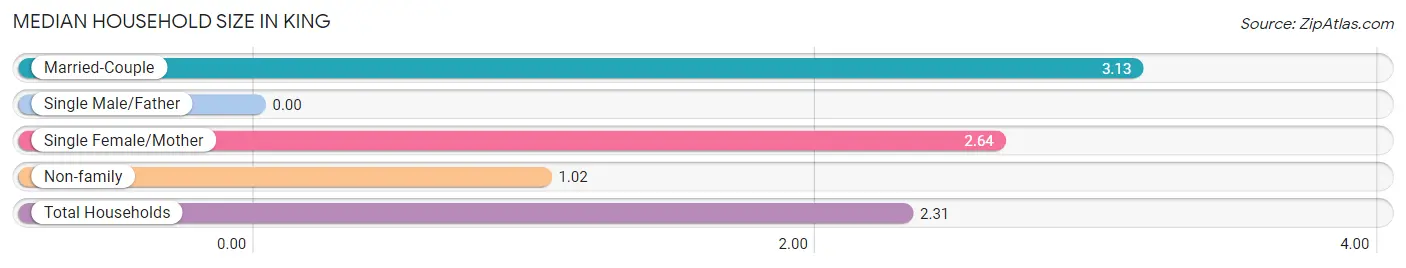
| Household Type | # Households | Household Size |
| Married-Couple | 1,538 (51.2%) | 3.13 |
| Single Male/Father | 0 (0.0%) | - |
| Single Female/Mother | 390 (13.0%) | 2.64 |
| Non-family | 1,076 (35.8%) | 1.02 |
| Total Households | 3,004 (100.0%) | 2.31 |
Household Size by Marriage Status in King
Out of a total of 3,004 households in King, 1,928 (64.2%) are family households, while 1,076 (35.8%) are nonfamily households. The most numerous type of family households are 2-person households, comprising 802, and the most common type of nonfamily households are 1-person households, comprising 1,057.
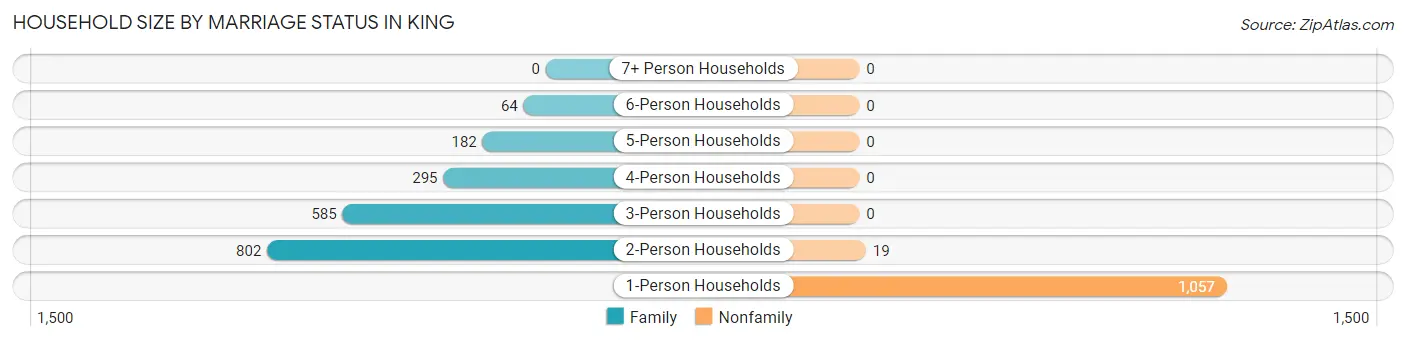
| Household Size | Family Households | Nonfamily Households |
| 1-Person Households | - | 1,057 (35.2%) |
| 2-Person Households | 802 (26.7%) | 19 (0.6%) |
| 3-Person Households | 585 (19.5%) | 0 (0.0%) |
| 4-Person Households | 295 (9.8%) | 0 (0.0%) |
| 5-Person Households | 182 (6.1%) | 0 (0.0%) |
| 6-Person Households | 64 (2.1%) | 0 (0.0%) |
| 7+ Person Households | 0 (0.0%) | 0 (0.0%) |
| Total | 1,928 (64.2%) | 1,076 (35.8%) |
Female Fertility in King
Fertility by Age in King
Average fertility rate in King is 61.0 births per 1,000 women. Women in the age bracket of 20 to 34 years have the highest fertility rate with 83.0 births per 1,000 women. Women in the age bracket of 20 to 34 years acount for 55.0% of all women with births.
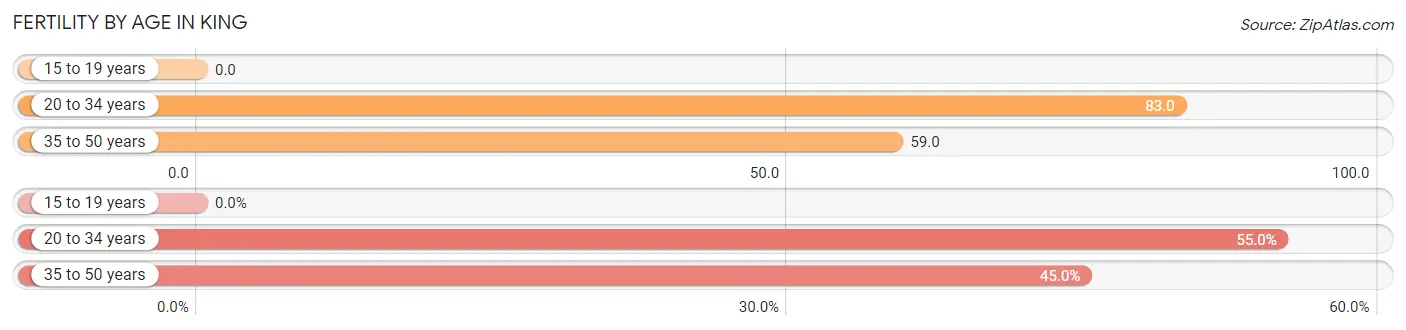
| Age Bracket | Women with Births | Births / 1,000 Women |
| 15 to 19 years | 0 (0.0%) | 0.0 |
| 20 to 34 years | 55 (55.0%) | 83.0 |
| 35 to 50 years | 45 (45.0%) | 59.0 |
| Total | 100 (100.0%) | 61.0 |
Fertility by Age by Marriage Status in King
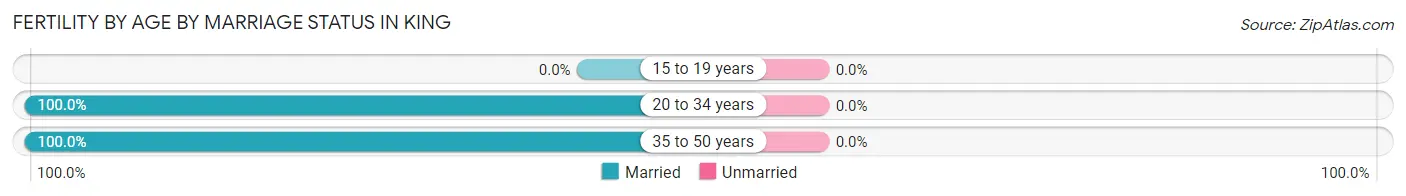
| Age Bracket | Married | Unmarried |
| 15 to 19 years | 0 (0.0%) | 0 (0.0%) |
| 20 to 34 years | 55 (100.0%) | 0 (0.0%) |
| 35 to 50 years | 45 (100.0%) | 0 (0.0%) |
| Total | 100 (100.0%) | 0 (0.0%) |
Fertility by Education in King
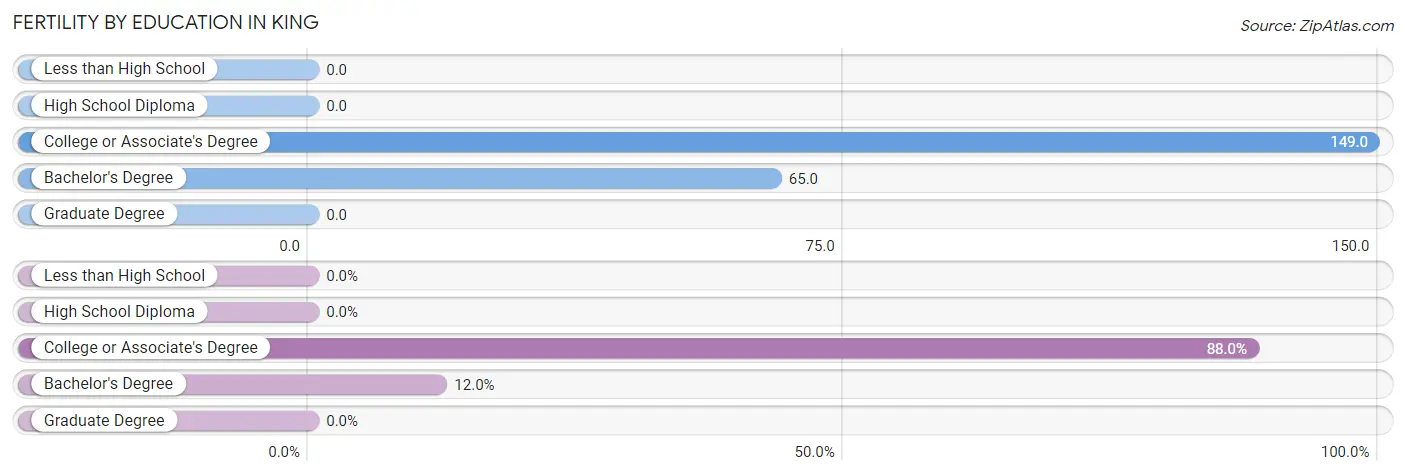
| Educational Attainment | Women with Births | Births / 1,000 Women |
| Less than High School | 0 (0.0%) | 0.0 |
| High School Diploma | 0 (0.0%) | 0.0 |
| College or Associate's Degree | 88 (88.0%) | 149.0 |
| Bachelor's Degree | 12 (12.0%) | 65.0 |
| Graduate Degree | 0 (0.0%) | 0.0 |
| Total | 100 (100.0%) | 61.0 |
Fertility by Education by Marriage Status in King
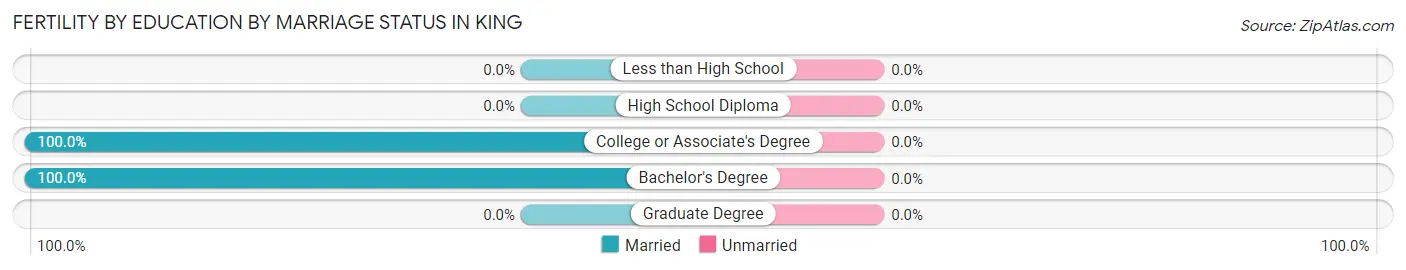
| Educational Attainment | Married | Unmarried |
| Less than High School | 0 (0.0%) | 0 (0.0%) |
| High School Diploma | 0 (0.0%) | 0 (0.0%) |
| College or Associate's Degree | 88 (100.0%) | 0 (0.0%) |
| Bachelor's Degree | 12 (100.0%) | 0 (0.0%) |
| Graduate Degree | 0 (0.0%) | 0 (0.0%) |
| Total | 100 (100.0%) | 0 (0.0%) |
Employment Characteristics in King
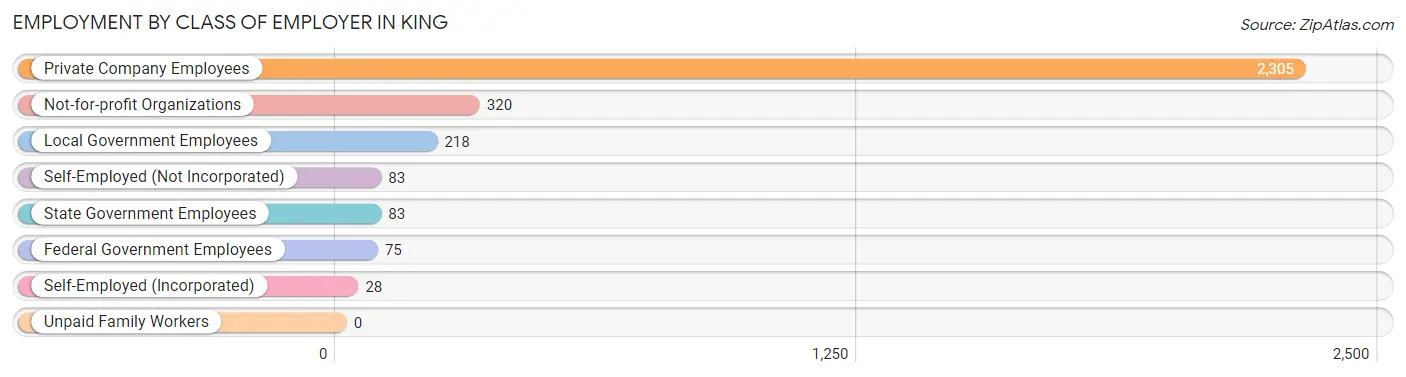
Employment by Class of Employer in King
Among the 3,112 employed individuals in King, private company employees (2,305 | 74.1%), not-for-profit organizations (320 | 10.3%), and local government employees (218 | 7.0%) make up the most common classes of employment.
| Employer Class | # Employees | % Employees |
| Private Company Employees | 2,305 | 74.1% |
| Self-Employed (Incorporated) | 28 | 0.9% |
| Self-Employed (Not Incorporated) | 83 | 2.7% |
| Not-for-profit Organizations | 320 | 10.3% |
| Local Government Employees | 218 | 7.0% |
| State Government Employees | 83 | 2.7% |
| Federal Government Employees | 75 | 2.4% |
| Unpaid Family Workers | 0 | 0.0% |
| Total | 3,112 | 100.0% |
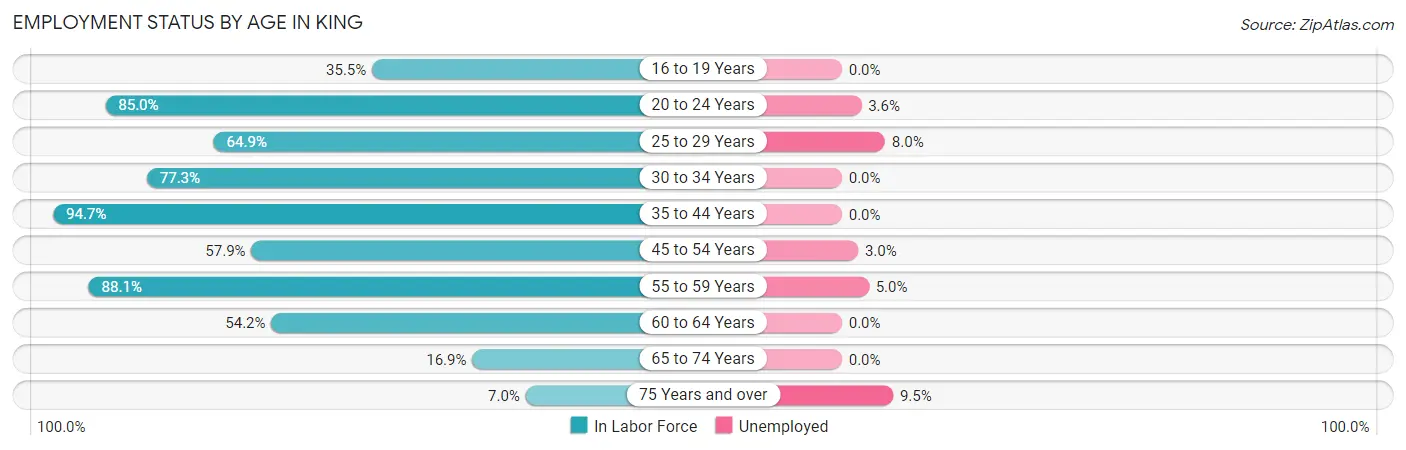
Employment Status by Age in King
According to the labor force statistics for King, out of the total population over 16 years of age (5,849), 54.6% or 3,194 individuals are in the labor force, with 2.1% or 67 of them unemployed. The age group with the highest labor force participation rate is 35 to 44 years, with 94.7% or 846 individuals in the labor force. Within the labor force, the 75 years and over age range has the highest percentage of unemployed individuals, with 9.5% or 6 of them being unemployed.
| Age Bracket | In Labor Force | Unemployed |
| 16 to 19 Years | 107 (35.5%) | 0 (0.0%) |
| 20 to 24 Years | 391 (85.0%) | 14 (3.6%) |
| 25 to 29 Years | 200 (64.9%) | 16 (8.0%) |
| 30 to 34 Years | 262 (77.3%) | 0 (0.0%) |
| 35 to 44 Years | 846 (94.7%) | 0 (0.0%) |
| 45 to 54 Years | 537 (57.9%) | 16 (3.0%) |
| 55 to 59 Years | 319 (88.1%) | 16 (5.0%) |
| 60 to 64 Years | 344 (54.2%) | 0 (0.0%) |
| 65 to 74 Years | 123 (16.9%) | 0 (0.0%) |
| 75 Years and over | 63 (7.0%) | 6 (9.5%) |
| Total | 3,194 (54.6%) | 67 (2.1%) |
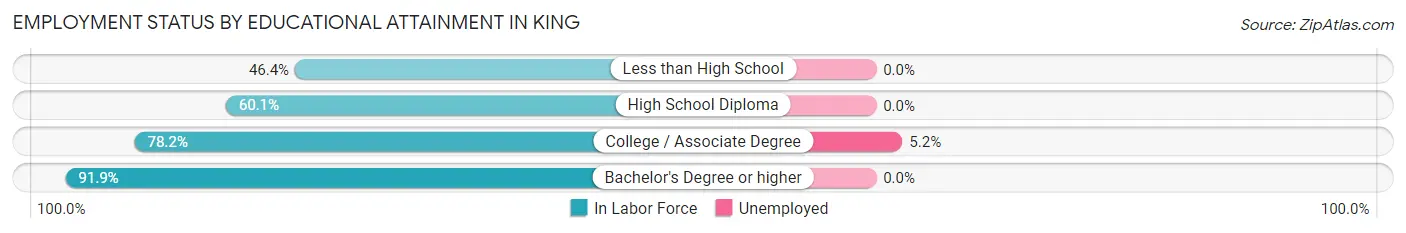
Employment Status by Educational Attainment in King
According to labor force statistics for King, 72.4% of individuals (2,508) out of the total population between 25 and 64 years of age (3,464) are in the labor force, with 1.9% or 48 of them being unemployed. The group with the highest labor force participation rate are those with the educational attainment of bachelor's degree or higher, with 91.9% or 702 individuals in the labor force. Within the labor force, individuals with college / associate degree education have the highest percentage of unemployment, with 5.2% or 48 of them being unemployed.
| Educational Attainment | In Labor Force | Unemployed |
| Less than High School | 104 (46.4%) | 0 (0.0%) |
| High School Diploma | 777 (60.1%) | 0 (0.0%) |
| College / Associate Degree | 925 (78.2%) | 62 (5.2%) |
| Bachelor's Degree or higher | 702 (91.9%) | 0 (0.0%) |
| Total | 2,508 (72.4%) | 66 (1.9%) |
Employment Occupations by Sex in King
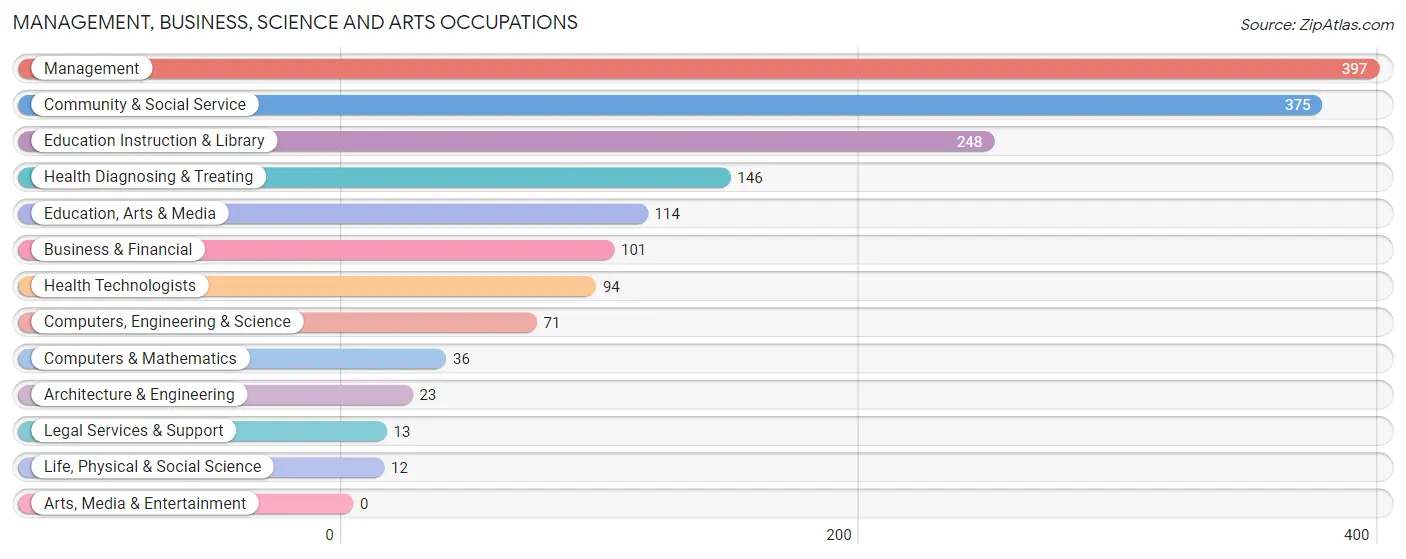
Management, Business, Science and Arts Occupations
The most common Management, Business, Science and Arts occupations in King are Management (397 | 12.7%), Community & Social Service (375 | 12.0%), Education Instruction & Library (248 | 7.9%), Health Diagnosing & Treating (146 | 4.7%), and Education, Arts & Media (114 | 3.6%).
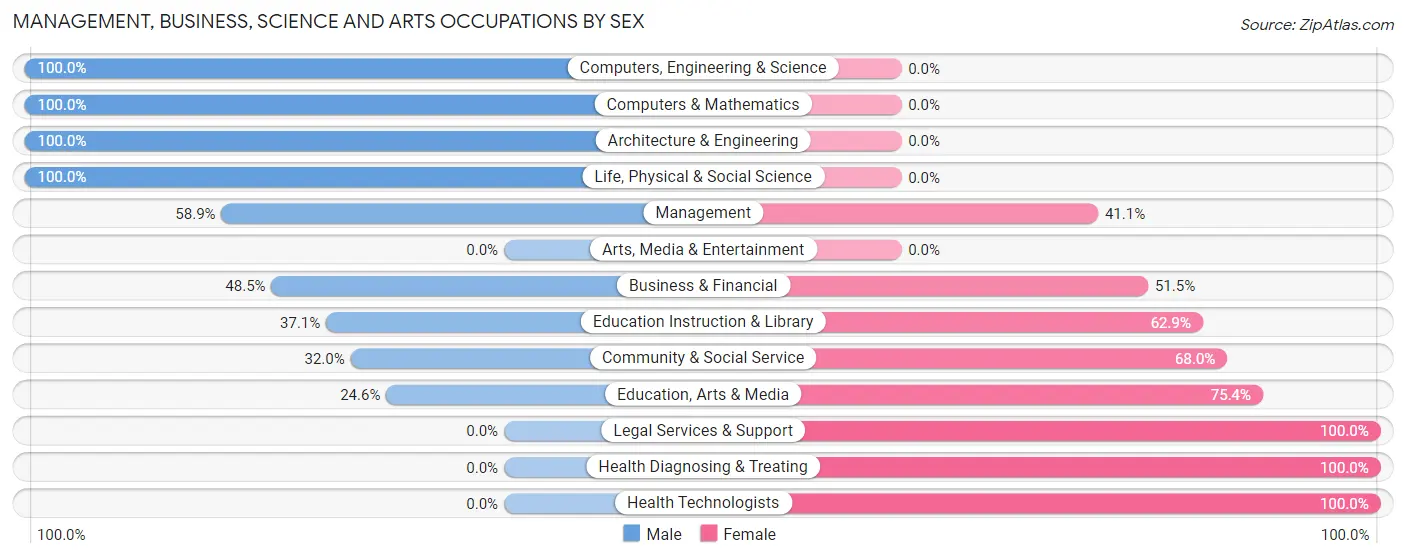
Management, Business, Science and Arts Occupations by Sex
Within the Management, Business, Science and Arts occupations in King, the most male-oriented occupations are Computers, Engineering & Science (100.0%), Computers & Mathematics (100.0%), and Architecture & Engineering (100.0%), while the most female-oriented occupations are Legal Services & Support (100.0%), Health Diagnosing & Treating (100.0%), and Health Technologists (100.0%).
| Occupation | Male | Female |
| Management | 234 (58.9%) | 163 (41.1%) |
| Business & Financial | 49 (48.5%) | 52 (51.5%) |
| Computers, Engineering & Science | 71 (100.0%) | 0 (0.0%) |
| Computers & Mathematics | 36 (100.0%) | 0 (0.0%) |
| Architecture & Engineering | 23 (100.0%) | 0 (0.0%) |
| Life, Physical & Social Science | 12 (100.0%) | 0 (0.0%) |
| Community & Social Service | 120 (32.0%) | 255 (68.0%) |
| Education, Arts & Media | 28 (24.6%) | 86 (75.4%) |
| Legal Services & Support | 0 (0.0%) | 13 (100.0%) |
| Education Instruction & Library | 92 (37.1%) | 156 (62.9%) |
| Arts, Media & Entertainment | 0 (0.0%) | 0 (0.0%) |
| Health Diagnosing & Treating | 0 (0.0%) | 146 (100.0%) |
| Health Technologists | 0 (0.0%) | 94 (100.0%) |
| Total (Category) | 474 (43.5%) | 616 (56.5%) |
| Total (Overall) | 1,387 (44.4%) | 1,737 (55.6%) |
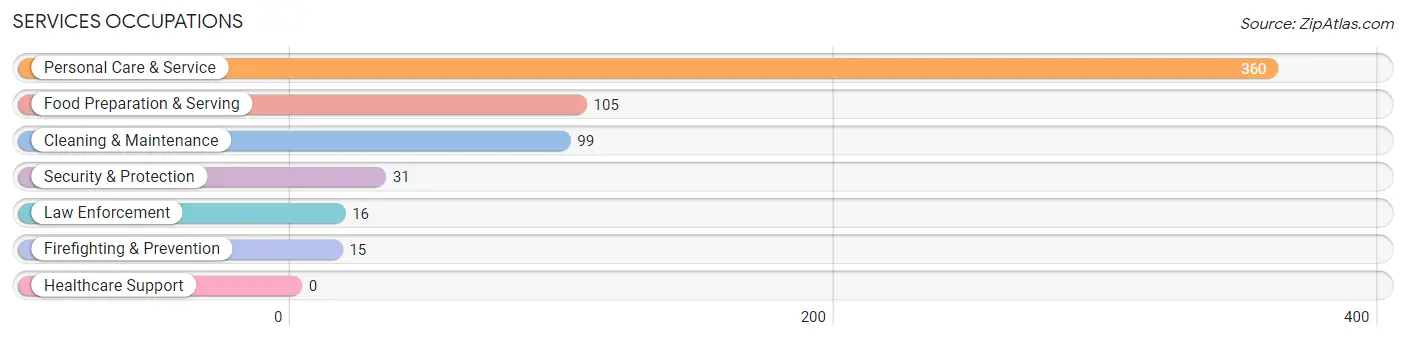
Services Occupations
The most common Services occupations in King are Personal Care & Service (360 | 11.5%), Food Preparation & Serving (105 | 3.4%), Cleaning & Maintenance (99 | 3.2%), Security & Protection (31 | 1.0%), and Law Enforcement (16 | 0.5%).
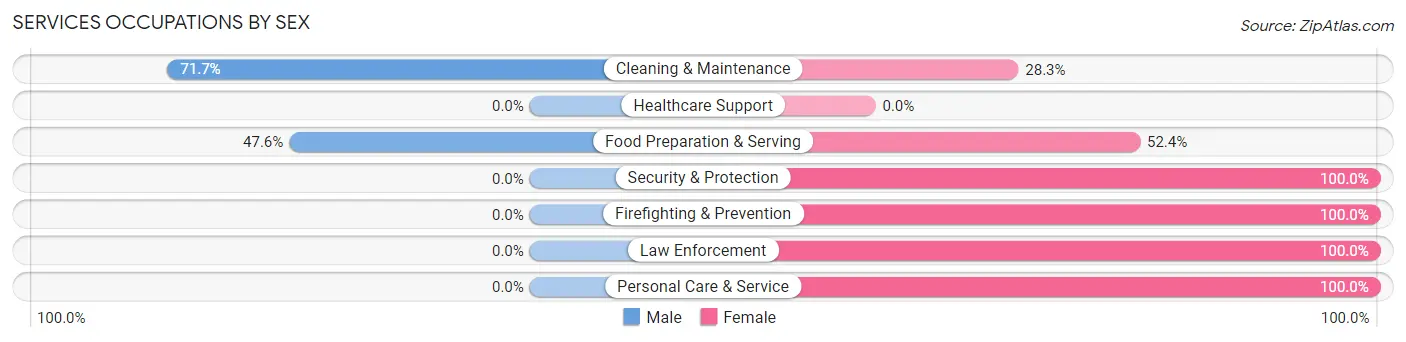
Services Occupations by Sex
Within the Services occupations in King, the most male-oriented occupations are Cleaning & Maintenance (71.7%), and Food Preparation & Serving (47.6%), while the most female-oriented occupations are Security & Protection (100.0%), Firefighting & Prevention (100.0%), and Law Enforcement (100.0%).
| Occupation | Male | Female |
| Healthcare Support | 0 (0.0%) | 0 (0.0%) |
| Security & Protection | 0 (0.0%) | 31 (100.0%) |
| Firefighting & Prevention | 0 (0.0%) | 15 (100.0%) |
| Law Enforcement | 0 (0.0%) | 16 (100.0%) |
| Food Preparation & Serving | 50 (47.6%) | 55 (52.4%) |
| Cleaning & Maintenance | 71 (71.7%) | 28 (28.3%) |
| Personal Care & Service | 0 (0.0%) | 360 (100.0%) |
| Total (Category) | 121 (20.3%) | 474 (79.7%) |
| Total (Overall) | 1,387 (44.4%) | 1,737 (55.6%) |
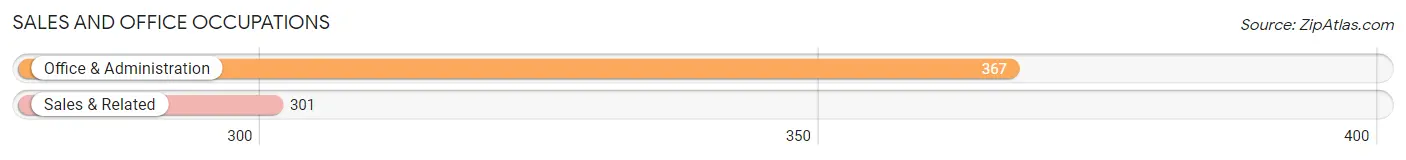
Sales and Office Occupations
The most common Sales and Office occupations in King are Office & Administration (367 | 11.7%), and Sales & Related (301 | 9.6%).
Sales and Office Occupations by Sex
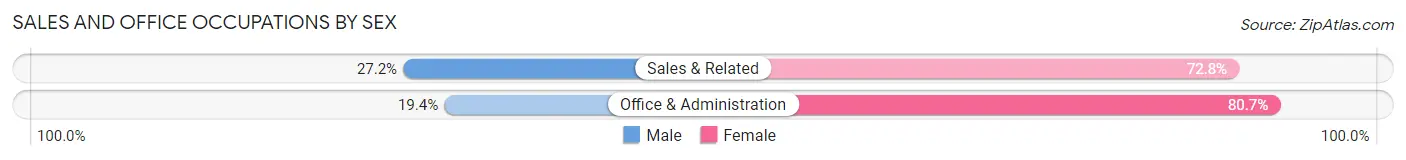
| Occupation | Male | Female |
| Sales & Related | 82 (27.2%) | 219 (72.8%) |
| Office & Administration | 71 (19.4%) | 296 (80.6%) |
| Total (Category) | 153 (22.9%) | 515 (77.1%) |
| Total (Overall) | 1,387 (44.4%) | 1,737 (55.6%) |
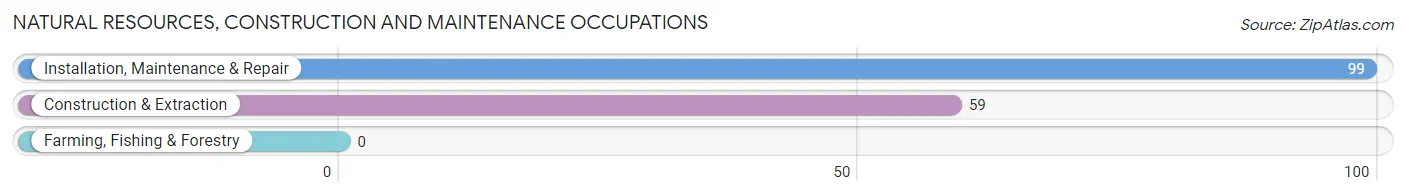
Natural Resources, Construction and Maintenance Occupations
The most common Natural Resources, Construction and Maintenance occupations in King are Installation, Maintenance & Repair (99 | 3.2%), and Construction & Extraction (59 | 1.9%).
Natural Resources, Construction and Maintenance Occupations by Sex
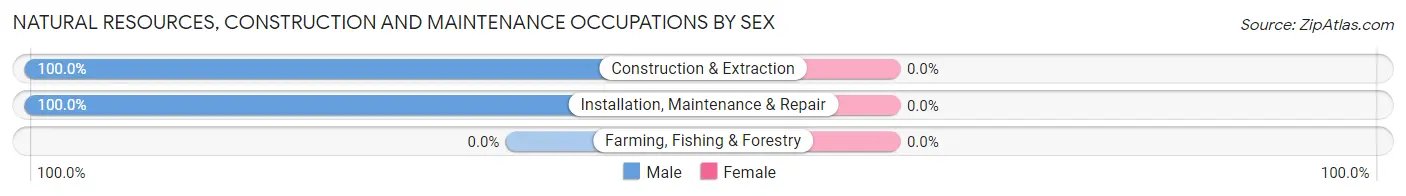
| Occupation | Male | Female |
| Farming, Fishing & Forestry | 0 (0.0%) | 0 (0.0%) |
| Construction & Extraction | 59 (100.0%) | 0 (0.0%) |
| Installation, Maintenance & Repair | 99 (100.0%) | 0 (0.0%) |
| Total (Category) | 158 (100.0%) | 0 (0.0%) |
| Total (Overall) | 1,387 (44.4%) | 1,737 (55.6%) |
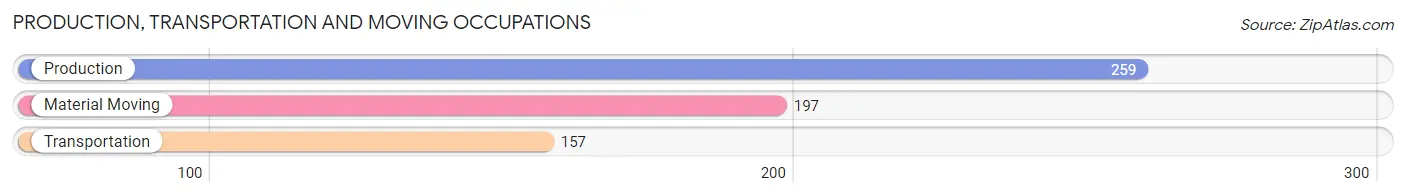
Production, Transportation and Moving Occupations
The most common Production, Transportation and Moving occupations in King are Production (259 | 8.3%), Material Moving (197 | 6.3%), and Transportation (157 | 5.0%).
Production, Transportation and Moving Occupations by Sex
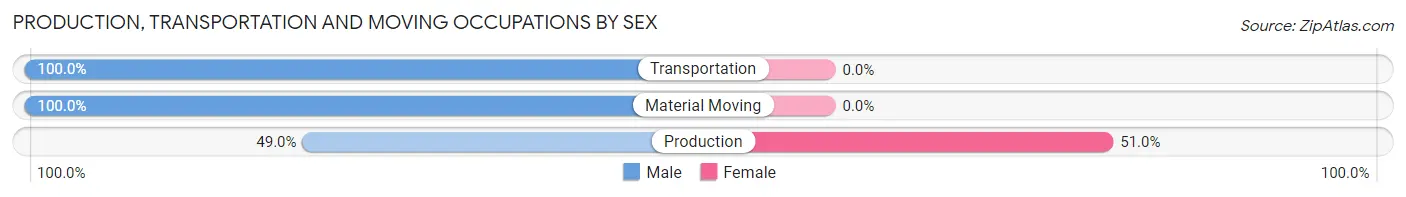
| Occupation | Male | Female |
| Production | 127 (49.0%) | 132 (51.0%) |
| Transportation | 157 (100.0%) | 0 (0.0%) |
| Material Moving | 197 (100.0%) | 0 (0.0%) |
| Total (Category) | 481 (78.5%) | 132 (21.5%) |
| Total (Overall) | 1,387 (44.4%) | 1,737 (55.6%) |
Employment Industries by Sex in King
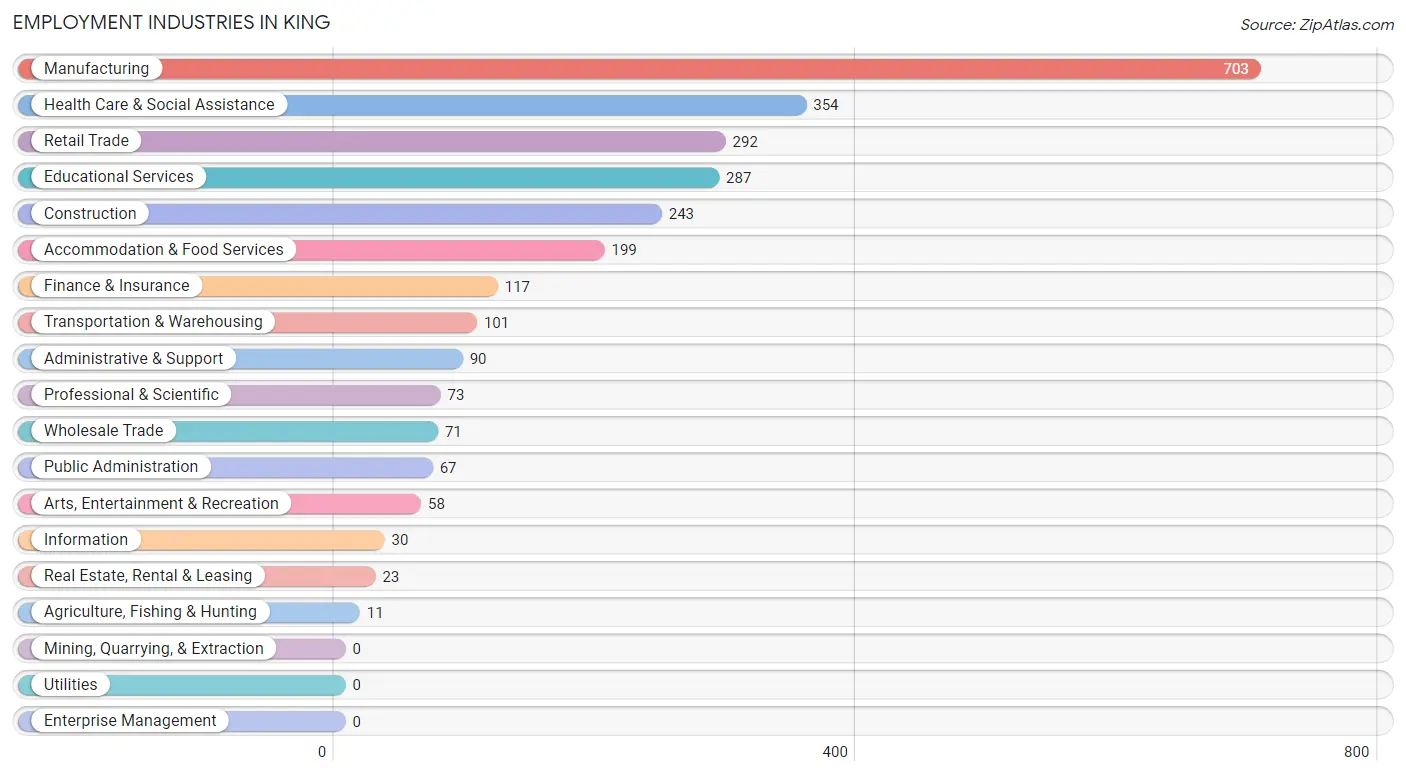
Employment Industries in King
The major employment industries in King include Manufacturing (703 | 22.5%), Health Care & Social Assistance (354 | 11.3%), Retail Trade (292 | 9.3%), Educational Services (287 | 9.2%), and Construction (243 | 7.8%).
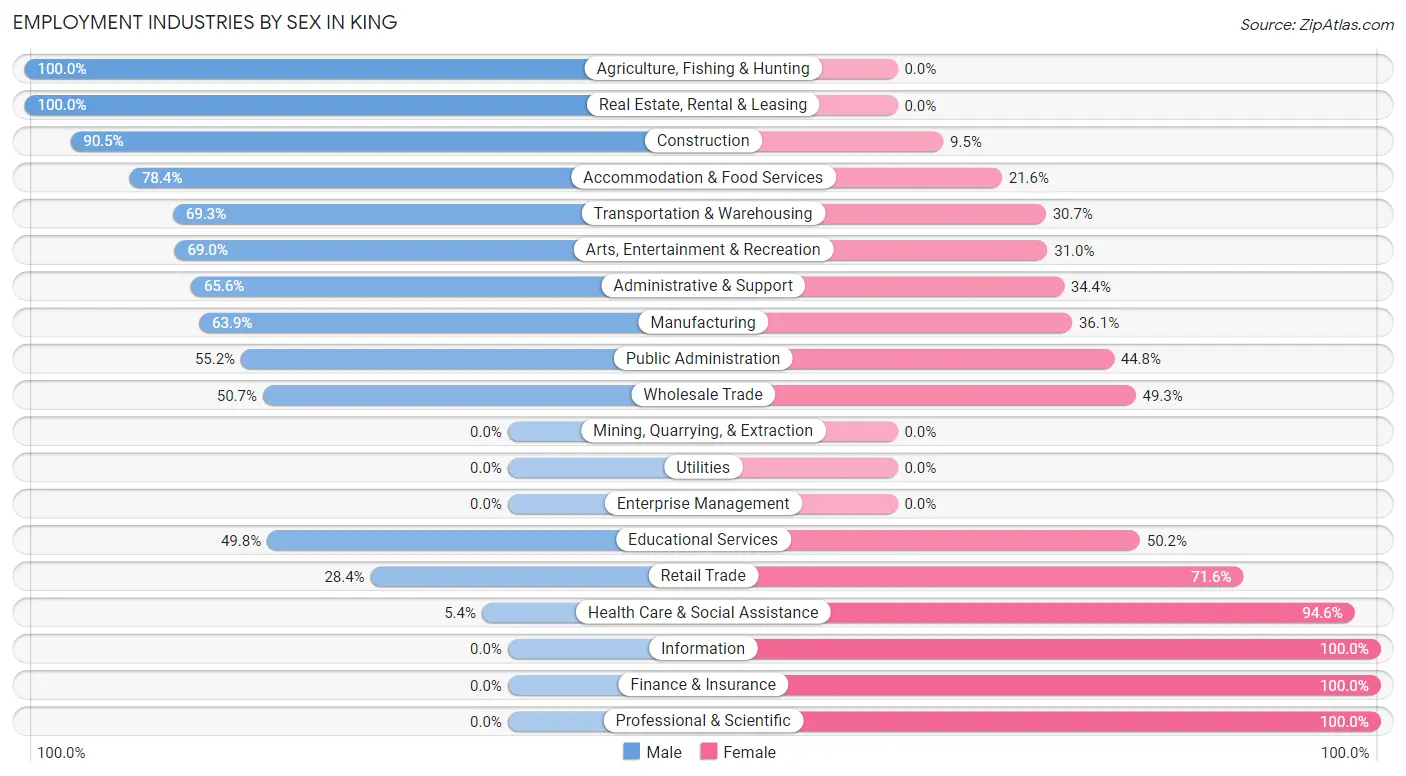
Employment Industries by Sex in King
The King industries that see more men than women are Agriculture, Fishing & Hunting (100.0%), Real Estate, Rental & Leasing (100.0%), and Construction (90.5%), whereas the industries that tend to have a higher number of women are Information (100.0%), Finance & Insurance (100.0%), and Professional & Scientific (100.0%).
| Industry | Male | Female |
| Agriculture, Fishing & Hunting | 11 (100.0%) | 0 (0.0%) |
| Mining, Quarrying, & Extraction | 0 (0.0%) | 0 (0.0%) |
| Construction | 220 (90.5%) | 23 (9.5%) |
| Manufacturing | 449 (63.9%) | 254 (36.1%) |
| Wholesale Trade | 36 (50.7%) | 35 (49.3%) |
| Retail Trade | 83 (28.4%) | 209 (71.6%) |
| Transportation & Warehousing | 70 (69.3%) | 31 (30.7%) |
| Utilities | 0 (0.0%) | 0 (0.0%) |
| Information | 0 (0.0%) | 30 (100.0%) |
| Finance & Insurance | 0 (0.0%) | 117 (100.0%) |
| Real Estate, Rental & Leasing | 23 (100.0%) | 0 (0.0%) |
| Professional & Scientific | 0 (0.0%) | 73 (100.0%) |
| Enterprise Management | 0 (0.0%) | 0 (0.0%) |
| Administrative & Support | 59 (65.6%) | 31 (34.4%) |
| Educational Services | 143 (49.8%) | 144 (50.2%) |
| Health Care & Social Assistance | 19 (5.4%) | 335 (94.6%) |
| Arts, Entertainment & Recreation | 40 (69.0%) | 18 (31.0%) |
| Accommodation & Food Services | 156 (78.4%) | 43 (21.6%) |
| Public Administration | 37 (55.2%) | 30 (44.8%) |
| Total | 1,387 (44.4%) | 1,737 (55.6%) |
Education in King
School Enrollment in King
The most common levels of schooling among the 1,438 students in King are high school (447 | 31.1%), middle school (376 | 26.2%), and elementary school (348 | 24.2%).
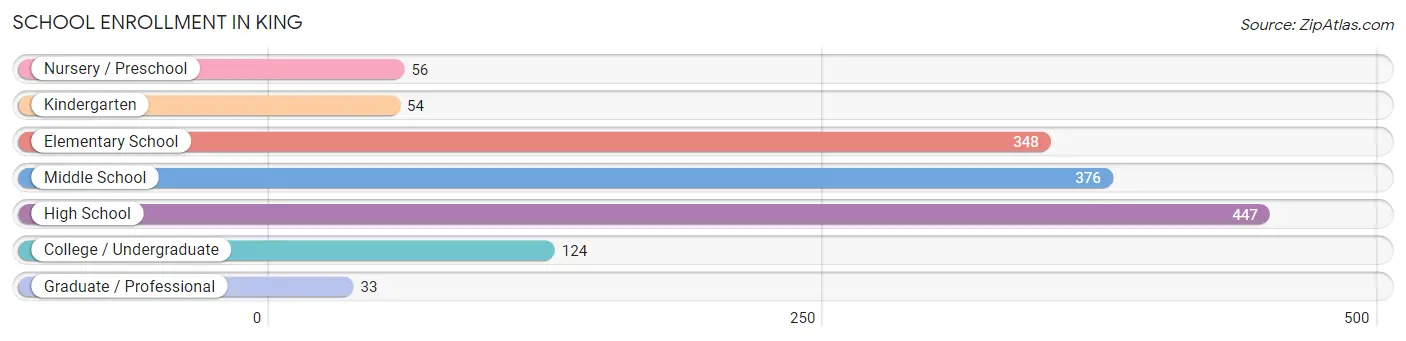
| School Level | # Students | % Students |
| Nursery / Preschool | 56 | 3.9% |
| Kindergarten | 54 | 3.8% |
| Elementary School | 348 | 24.2% |
| Middle School | 376 | 26.2% |
| High School | 447 | 31.1% |
| College / Undergraduate | 124 | 8.6% |
| Graduate / Professional | 33 | 2.3% |
| Total | 1,438 | 100.0% |
School Enrollment by Age by Funding Source in King
Out of a total of 1,438 students who are enrolled in schools in King, 148 (10.3%) attend a private institution, while the remaining 1,290 (89.7%) are enrolled in public schools. The age group of 20 to 24 year olds has the highest likelihood of being enrolled in private schools, with 44 (45.8% in the age bracket) enrolled. Conversely, the age group of 25 to 34 year olds has the lowest likelihood of being enrolled in a private school, with 10 (100.0% in the age bracket) attending a public institution.
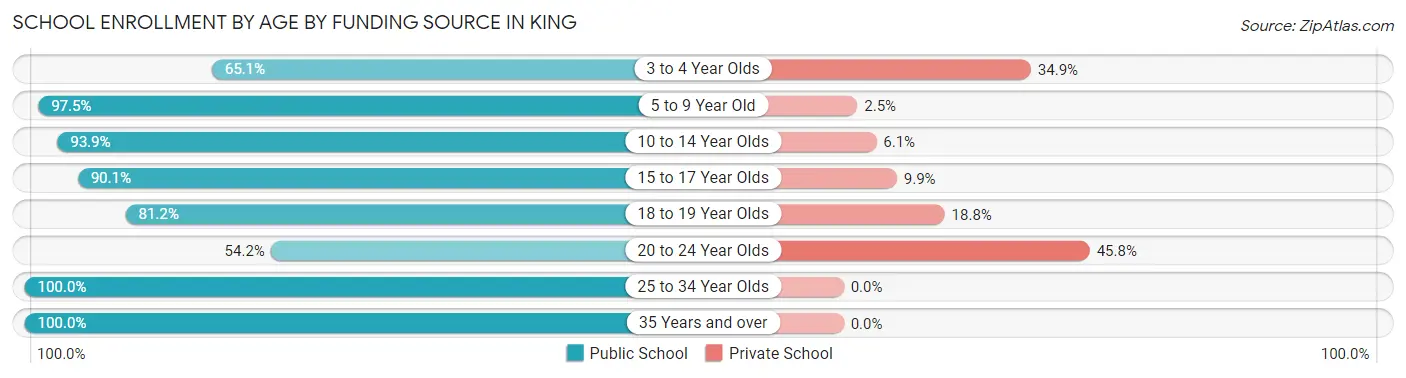
| Age Bracket | Public School | Private School |
| 3 to 4 Year Olds | 28 (65.1%) | 15 (34.9%) |
| 5 to 9 Year Old | 345 (97.5%) | 9 (2.5%) |
| 10 to 14 Year Olds | 463 (93.9%) | 30 (6.1%) |
| 15 to 17 Year Olds | 282 (90.1%) | 31 (9.9%) |
| 18 to 19 Year Olds | 82 (81.2%) | 19 (18.8%) |
| 20 to 24 Year Olds | 52 (54.2%) | 44 (45.8%) |
| 25 to 34 Year Olds | 10 (100.0%) | 0 (0.0%) |
| 35 Years and over | 28 (100.0%) | 0 (0.0%) |
| Total | 1,290 (89.7%) | 148 (10.3%) |
Educational Attainment by Field of Study in King
Education (283 | 21.8%), business (223 | 17.2%), science & technology (149 | 11.5%), arts & humanities (122 | 9.4%), and social sciences (119 | 9.2%) are the most common fields of study among 1,295 individuals in King who have obtained a bachelor's degree or higher.
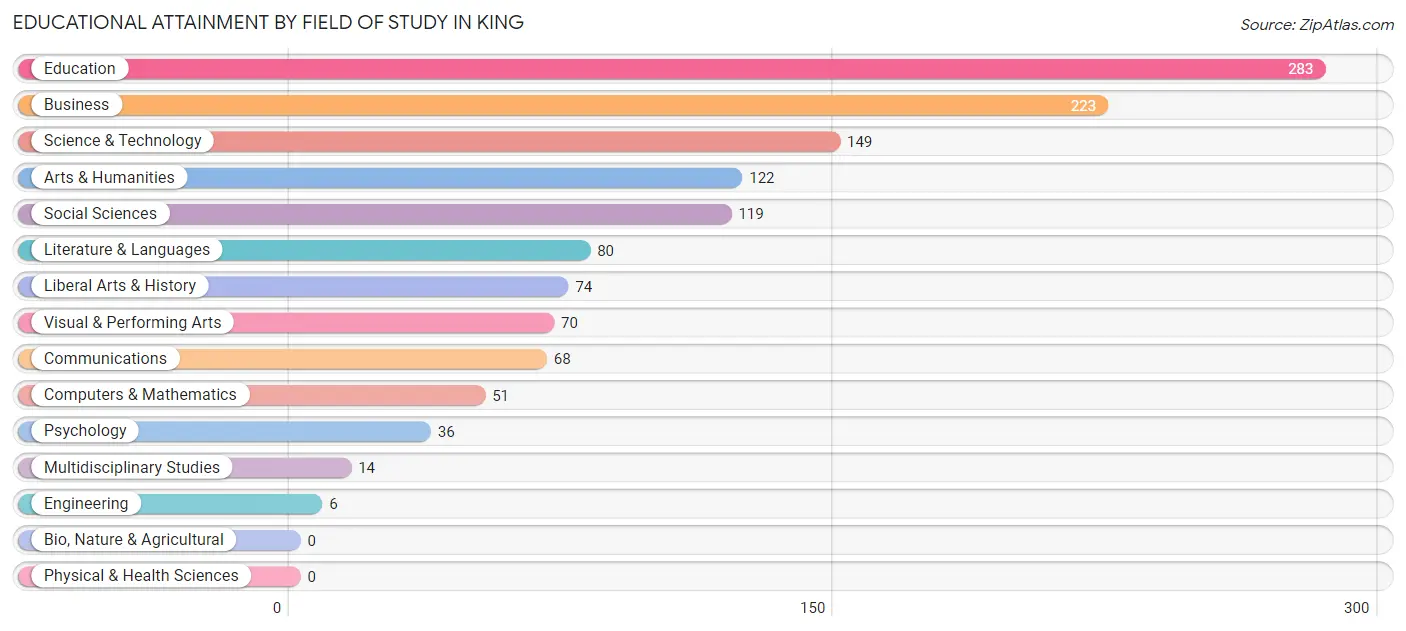
| Field of Study | # Graduates | % Graduates |
| Computers & Mathematics | 51 | 3.9% |
| Bio, Nature & Agricultural | 0 | 0.0% |
| Physical & Health Sciences | 0 | 0.0% |
| Psychology | 36 | 2.8% |
| Social Sciences | 119 | 9.2% |
| Engineering | 6 | 0.5% |
| Multidisciplinary Studies | 14 | 1.1% |
| Science & Technology | 149 | 11.5% |
| Business | 223 | 17.2% |
| Education | 283 | 21.8% |
| Literature & Languages | 80 | 6.2% |
| Liberal Arts & History | 74 | 5.7% |
| Visual & Performing Arts | 70 | 5.4% |
| Communications | 68 | 5.2% |
| Arts & Humanities | 122 | 9.4% |
| Total | 1,295 | 100.0% |
Transportation & Commute in King
Vehicle Availability by Sex in King
The most prevalent vehicle ownership categories in King are males with 2 vehicles (652, accounting for 47.5%) and females with 2 vehicles (641, making up 37.5%).
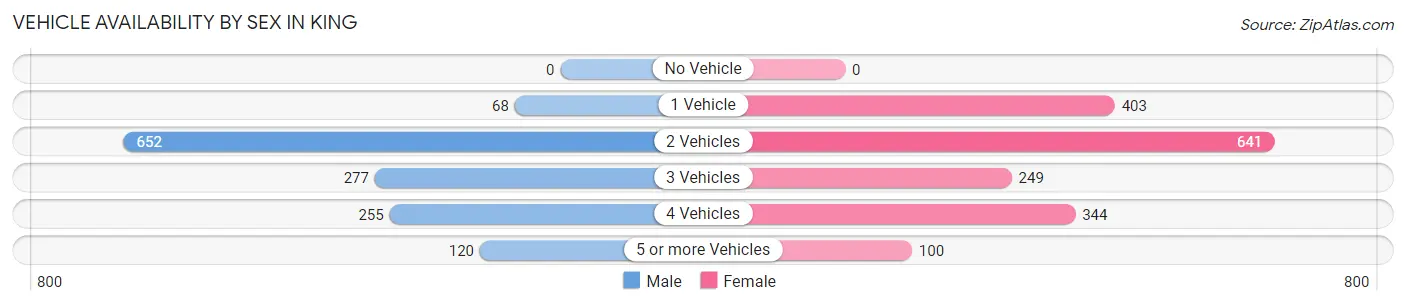
| Vehicles Available | Male | Female |
| No Vehicle | 0 (0.0%) | 0 (0.0%) |
| 1 Vehicle | 68 (5.0%) | 403 (23.2%) |
| 2 Vehicles | 652 (47.5%) | 641 (36.9%) |
| 3 Vehicles | 277 (20.2%) | 249 (14.3%) |
| 4 Vehicles | 255 (18.6%) | 344 (19.8%) |
| 5 or more Vehicles | 120 (8.7%) | 100 (5.8%) |
| Total | 1,372 (100.0%) | 1,737 (100.0%) |
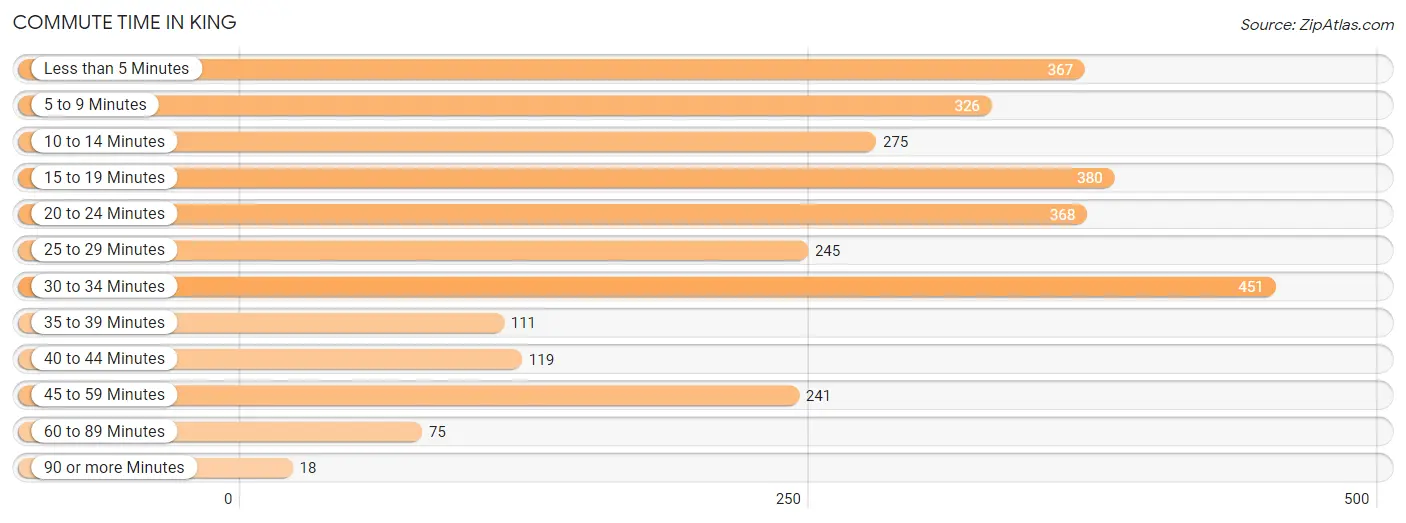
Commute Time in King
The most frequently occuring commute durations in King are 30 to 34 minutes (451 commuters, 15.1%), 15 to 19 minutes (380 commuters, 12.8%), and 20 to 24 minutes (368 commuters, 12.4%).
| Commute Time | # Commuters | % Commuters |
| Less than 5 Minutes | 367 | 12.3% |
| 5 to 9 Minutes | 326 | 11.0% |
| 10 to 14 Minutes | 275 | 9.2% |
| 15 to 19 Minutes | 380 | 12.8% |
| 20 to 24 Minutes | 368 | 12.4% |
| 25 to 29 Minutes | 245 | 8.2% |
| 30 to 34 Minutes | 451 | 15.1% |
| 35 to 39 Minutes | 111 | 3.7% |
| 40 to 44 Minutes | 119 | 4.0% |
| 45 to 59 Minutes | 241 | 8.1% |
| 60 to 89 Minutes | 75 | 2.5% |
| 90 or more Minutes | 18 | 0.6% |
Commute Time by Sex in King
The most common commute times in King are 30 to 34 minutes (346 commuters, 26.2%) for males and less than 5 minutes (316 commuters, 19.1%) for females.
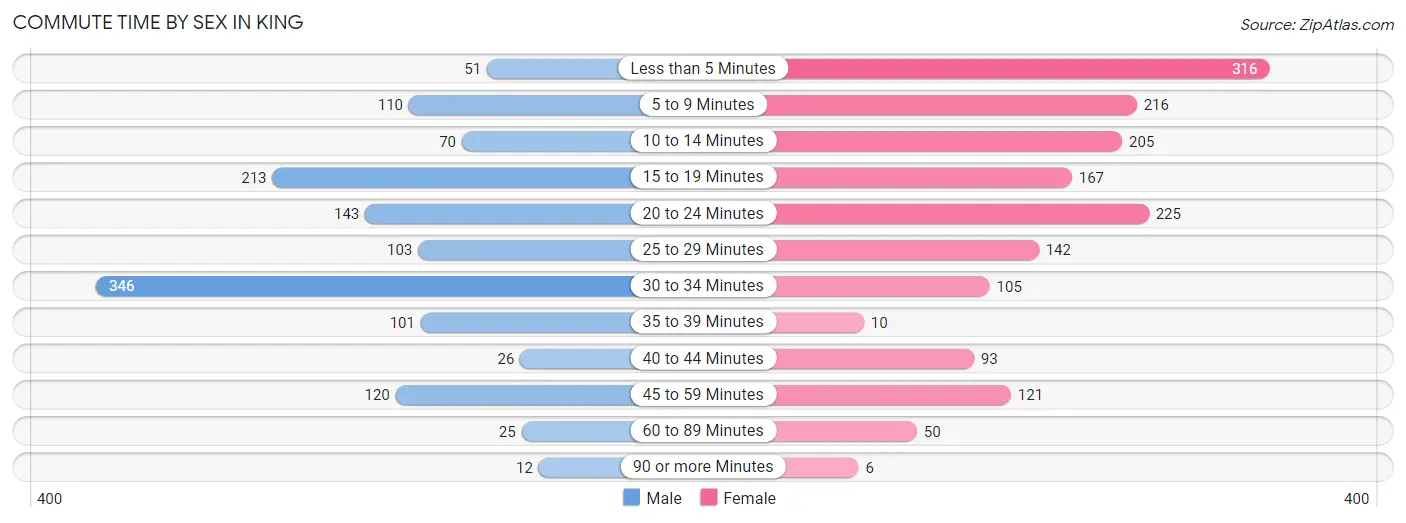
| Commute Time | Male | Female |
| Less than 5 Minutes | 51 (3.9%) | 316 (19.1%) |
| 5 to 9 Minutes | 110 (8.3%) | 216 (13.0%) |
| 10 to 14 Minutes | 70 (5.3%) | 205 (12.4%) |
| 15 to 19 Minutes | 213 (16.1%) | 167 (10.1%) |
| 20 to 24 Minutes | 143 (10.8%) | 225 (13.6%) |
| 25 to 29 Minutes | 103 (7.8%) | 142 (8.6%) |
| 30 to 34 Minutes | 346 (26.2%) | 105 (6.3%) |
| 35 to 39 Minutes | 101 (7.6%) | 10 (0.6%) |
| 40 to 44 Minutes | 26 (2.0%) | 93 (5.6%) |
| 45 to 59 Minutes | 120 (9.1%) | 121 (7.3%) |
| 60 to 89 Minutes | 25 (1.9%) | 50 (3.0%) |
| 90 or more Minutes | 12 (0.9%) | 6 (0.4%) |
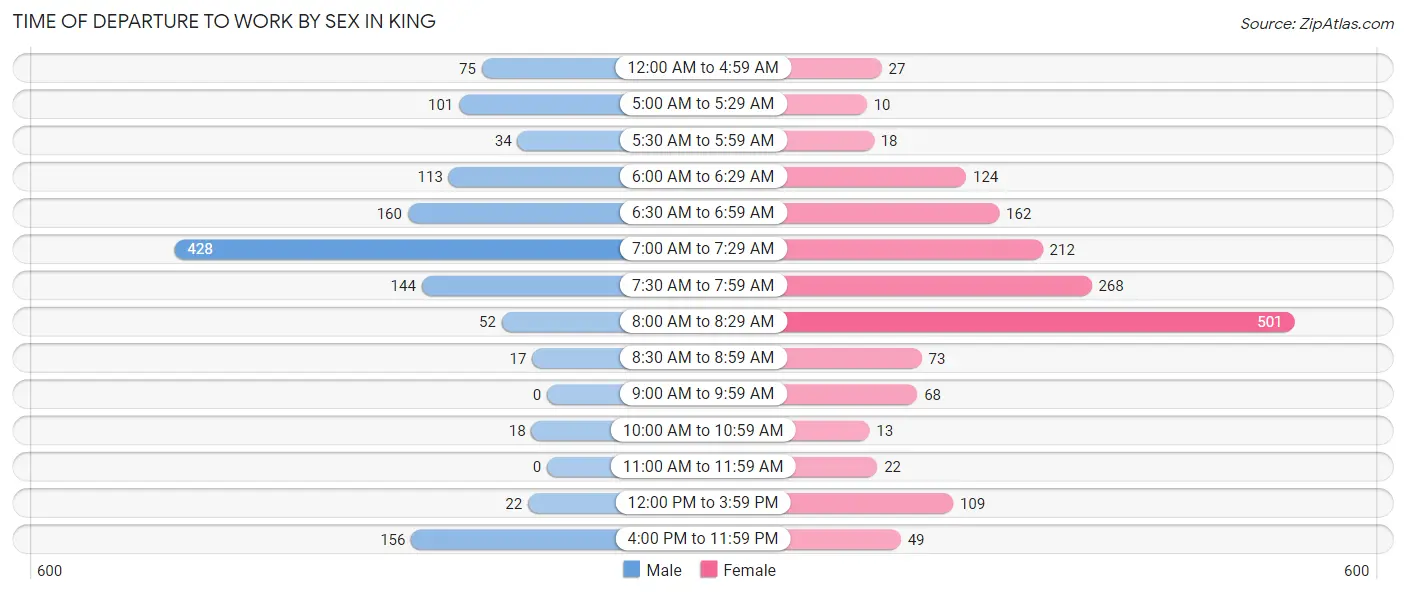
Time of Departure to Work by Sex in King
The most frequent times of departure to work in King are 7:00 AM to 7:29 AM (428, 32.4%) for males and 8:00 AM to 8:29 AM (501, 30.2%) for females.
| Time of Departure | Male | Female |
| 12:00 AM to 4:59 AM | 75 (5.7%) | 27 (1.6%) |
| 5:00 AM to 5:29 AM | 101 (7.6%) | 10 (0.6%) |
| 5:30 AM to 5:59 AM | 34 (2.6%) | 18 (1.1%) |
| 6:00 AM to 6:29 AM | 113 (8.6%) | 124 (7.5%) |
| 6:30 AM to 6:59 AM | 160 (12.1%) | 162 (9.8%) |
| 7:00 AM to 7:29 AM | 428 (32.4%) | 212 (12.8%) |
| 7:30 AM to 7:59 AM | 144 (10.9%) | 268 (16.2%) |
| 8:00 AM to 8:29 AM | 52 (3.9%) | 501 (30.2%) |
| 8:30 AM to 8:59 AM | 17 (1.3%) | 73 (4.4%) |
| 9:00 AM to 9:59 AM | 0 (0.0%) | 68 (4.1%) |
| 10:00 AM to 10:59 AM | 18 (1.4%) | 13 (0.8%) |
| 11:00 AM to 11:59 AM | 0 (0.0%) | 22 (1.3%) |
| 12:00 PM to 3:59 PM | 22 (1.7%) | 109 (6.6%) |
| 4:00 PM to 11:59 PM | 156 (11.8%) | 49 (3.0%) |
| Total | 1,320 (100.0%) | 1,656 (100.0%) |
Housing Occupancy in King
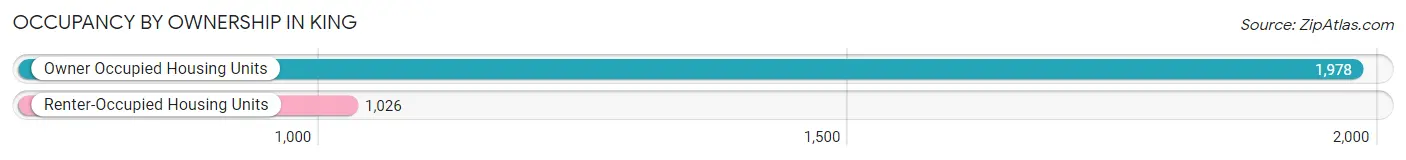
Occupancy by Ownership in King
Of the total 3,004 dwellings in King, owner-occupied units account for 1,978 (65.8%), while renter-occupied units make up 1,026 (34.2%).
| Occupancy | # Housing Units | % Housing Units |
| Owner Occupied Housing Units | 1,978 | 65.8% |
| Renter-Occupied Housing Units | 1,026 | 34.2% |
| Total Occupied Housing Units | 3,004 | 100.0% |
Occupancy by Household Size in King
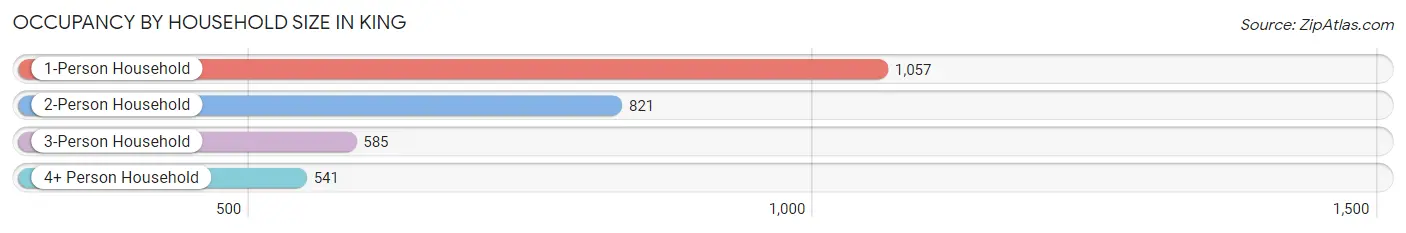
| Household Size | # Housing Units | % Housing Units |
| 1-Person Household | 1,057 | 35.2% |
| 2-Person Household | 821 | 27.3% |
| 3-Person Household | 585 | 19.5% |
| 4+ Person Household | 541 | 18.0% |
| Total Housing Units | 3,004 | 100.0% |
Occupancy by Ownership by Household Size in King
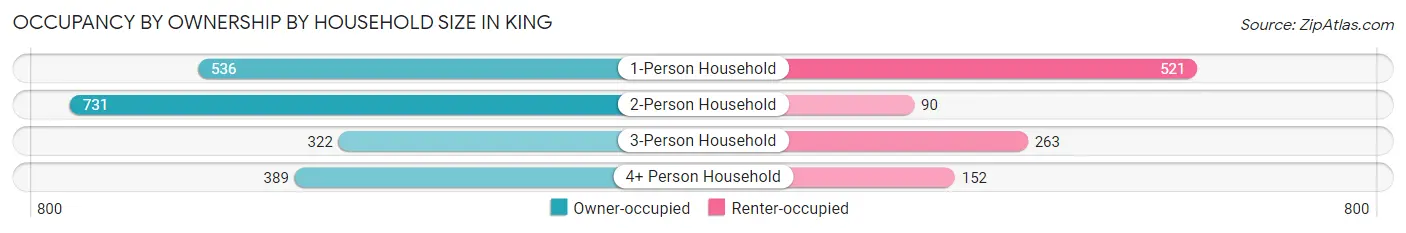
| Household Size | Owner-occupied | Renter-occupied |
| 1-Person Household | 536 (50.7%) | 521 (49.3%) |
| 2-Person Household | 731 (89.0%) | 90 (11.0%) |
| 3-Person Household | 322 (55.0%) | 263 (45.0%) |
| 4+ Person Household | 389 (71.9%) | 152 (28.1%) |
| Total Housing Units | 1,978 (65.8%) | 1,026 (34.2%) |
Occupancy by Educational Attainment in King
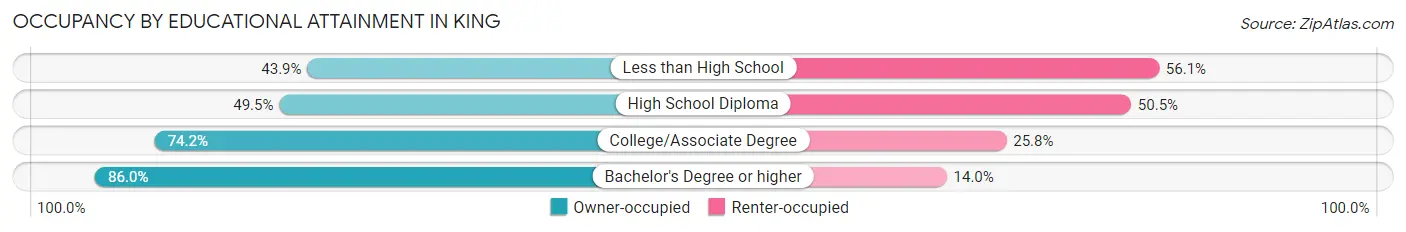
| Household Size | Owner-occupied | Renter-occupied |
| Less than High School | 58 (43.9%) | 74 (56.1%) |
| High School Diploma | 596 (49.5%) | 608 (50.5%) |
| College/Associate Degree | 696 (74.2%) | 242 (25.8%) |
| Bachelor's Degree or higher | 628 (86.0%) | 102 (14.0%) |
Occupancy by Age of Householder in King
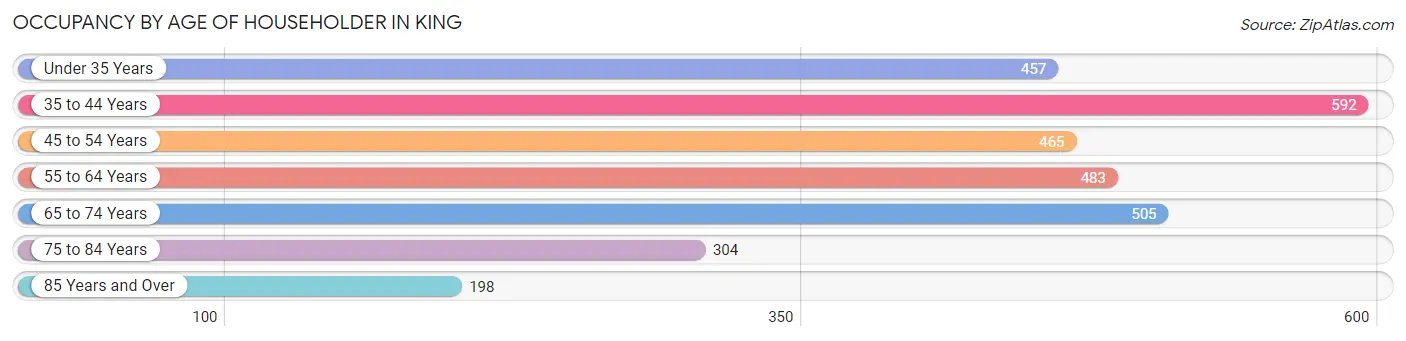
| Age Bracket | # Households | % Households |
| Under 35 Years | 457 | 15.2% |
| 35 to 44 Years | 592 | 19.7% |
| 45 to 54 Years | 465 | 15.5% |
| 55 to 64 Years | 483 | 16.1% |
| 65 to 74 Years | 505 | 16.8% |
| 75 to 84 Years | 304 | 10.1% |
| 85 Years and Over | 198 | 6.6% |
| Total | 3,004 | 100.0% |
Housing Finances in King
Median Income by Occupancy in King
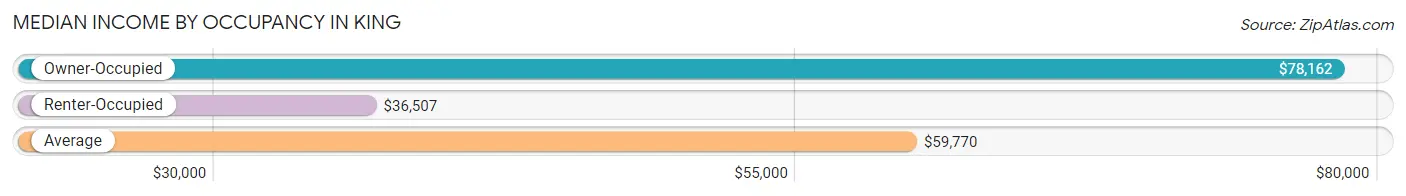
| Occupancy Type | # Households | Median Income |
| Owner-Occupied | 1,978 (65.8%) | $78,162 |
| Renter-Occupied | 1,026 (34.2%) | $36,507 |
| Average | 3,004 (100.0%) | $59,770 |
Occupancy by Householder Income Bracket in King
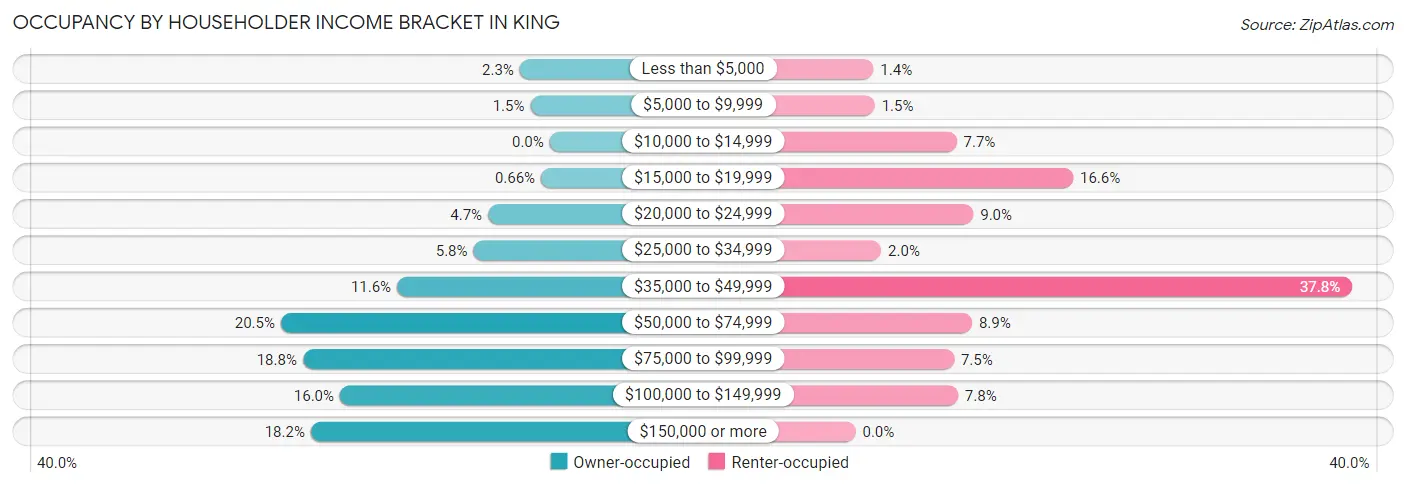
| Income Bracket | Owner-occupied | Renter-occupied |
| Less than $5,000 | 45 (2.3%) | 14 (1.4%) |
| $5,000 to $9,999 | 29 (1.5%) | 15 (1.5%) |
| $10,000 to $14,999 | 0 (0.0%) | 79 (7.7%) |
| $15,000 to $19,999 | 13 (0.7%) | 170 (16.6%) |
| $20,000 to $24,999 | 93 (4.7%) | 92 (9.0%) |
| $25,000 to $34,999 | 115 (5.8%) | 20 (1.9%) |
| $35,000 to $49,999 | 230 (11.6%) | 388 (37.8%) |
| $50,000 to $74,999 | 405 (20.5%) | 91 (8.9%) |
| $75,000 to $99,999 | 372 (18.8%) | 77 (7.5%) |
| $100,000 to $149,999 | 316 (16.0%) | 80 (7.8%) |
| $150,000 or more | 360 (18.2%) | 0 (0.0%) |
| Total | 1,978 (100.0%) | 1,026 (100.0%) |
Monthly Housing Cost Tiers in King
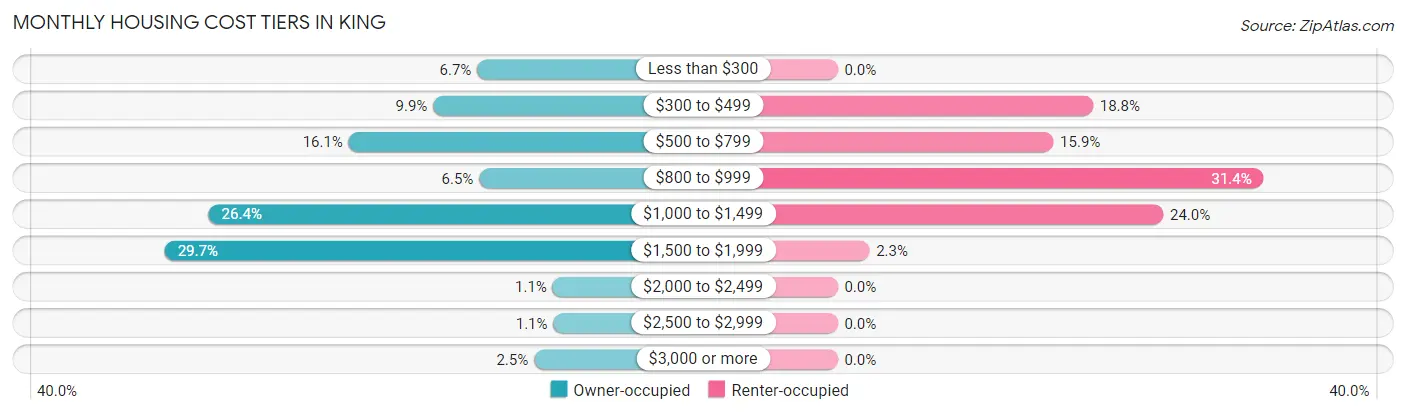
| Monthly Cost | Owner-occupied | Renter-occupied |
| Less than $300 | 132 (6.7%) | 0 (0.0%) |
| $300 to $499 | 196 (9.9%) | 193 (18.8%) |
| $500 to $799 | 319 (16.1%) | 163 (15.9%) |
| $800 to $999 | 129 (6.5%) | 322 (31.4%) |
| $1,000 to $1,499 | 523 (26.4%) | 246 (24.0%) |
| $1,500 to $1,999 | 587 (29.7%) | 24 (2.3%) |
| $2,000 to $2,499 | 22 (1.1%) | 0 (0.0%) |
| $2,500 to $2,999 | 21 (1.1%) | 0 (0.0%) |
| $3,000 or more | 49 (2.5%) | 0 (0.0%) |
| Total | 1,978 (100.0%) | 1,026 (100.0%) |
Physical Housing Characteristics in King
Housing Structures in King
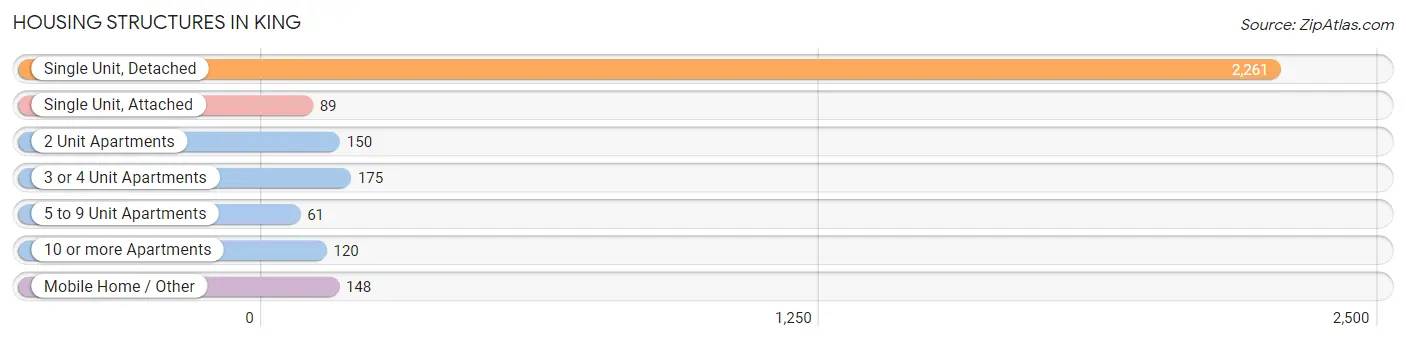
| Structure Type | # Housing Units | % Housing Units |
| Single Unit, Detached | 2,261 | 75.3% |
| Single Unit, Attached | 89 | 3.0% |
| 2 Unit Apartments | 150 | 5.0% |
| 3 or 4 Unit Apartments | 175 | 5.8% |
| 5 to 9 Unit Apartments | 61 | 2.0% |
| 10 or more Apartments | 120 | 4.0% |
| Mobile Home / Other | 148 | 4.9% |
| Total | 3,004 | 100.0% |
Housing Structures by Occupancy in King
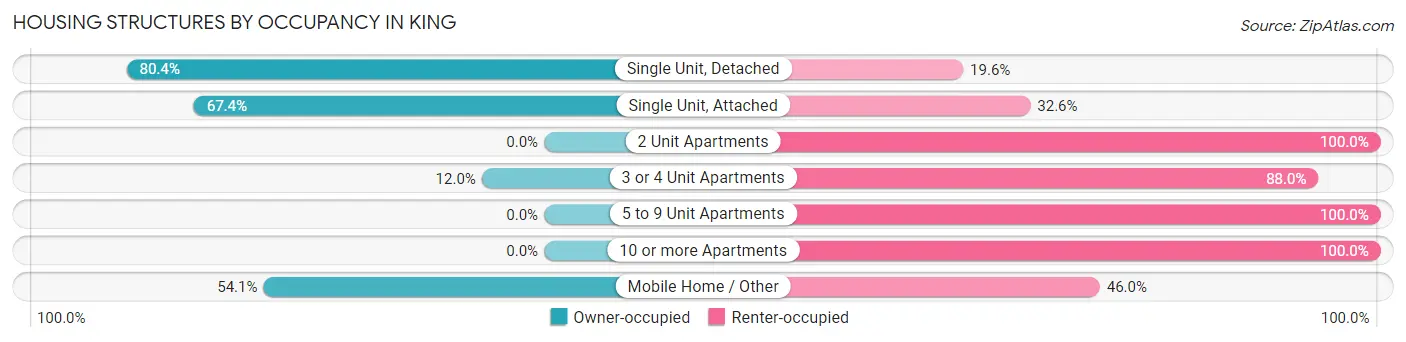
| Structure Type | Owner-occupied | Renter-occupied |
| Single Unit, Detached | 1,817 (80.4%) | 444 (19.6%) |
| Single Unit, Attached | 60 (67.4%) | 29 (32.6%) |
| 2 Unit Apartments | 0 (0.0%) | 150 (100.0%) |
| 3 or 4 Unit Apartments | 21 (12.0%) | 154 (88.0%) |
| 5 to 9 Unit Apartments | 0 (0.0%) | 61 (100.0%) |
| 10 or more Apartments | 0 (0.0%) | 120 (100.0%) |
| Mobile Home / Other | 80 (54.0%) | 68 (46.0%) |
| Total | 1,978 (65.8%) | 1,026 (34.2%) |
Housing Structures by Number of Rooms in King
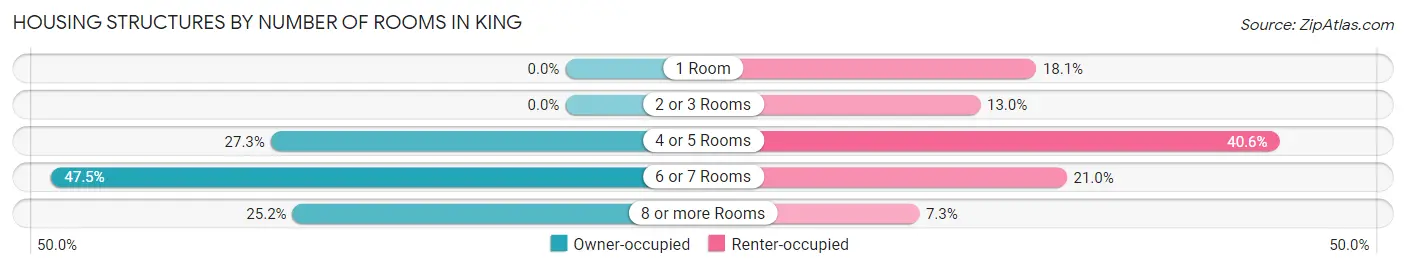
| Number of Rooms | Owner-occupied | Renter-occupied |
| 1 Room | 0 (0.0%) | 186 (18.1%) |
| 2 or 3 Rooms | 0 (0.0%) | 133 (13.0%) |
| 4 or 5 Rooms | 539 (27.3%) | 417 (40.6%) |
| 6 or 7 Rooms | 940 (47.5%) | 215 (21.0%) |
| 8 or more Rooms | 499 (25.2%) | 75 (7.3%) |
| Total | 1,978 (100.0%) | 1,026 (100.0%) |
Housing Structure by Heating Type in King
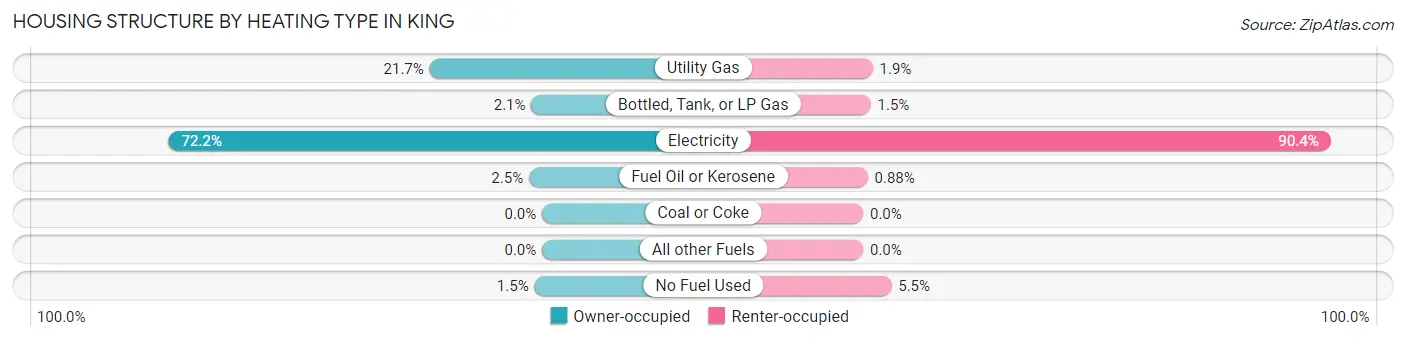
| Heating Type | Owner-occupied | Renter-occupied |
| Utility Gas | 430 (21.7%) | 19 (1.8%) |
| Bottled, Tank, or LP Gas | 41 (2.1%) | 15 (1.5%) |
| Electricity | 1,428 (72.2%) | 927 (90.3%) |
| Fuel Oil or Kerosene | 50 (2.5%) | 9 (0.9%) |
| Coal or Coke | 0 (0.0%) | 0 (0.0%) |
| All other Fuels | 0 (0.0%) | 0 (0.0%) |
| No Fuel Used | 29 (1.5%) | 56 (5.5%) |
| Total | 1,978 (100.0%) | 1,026 (100.0%) |
Household Vehicle Usage in King
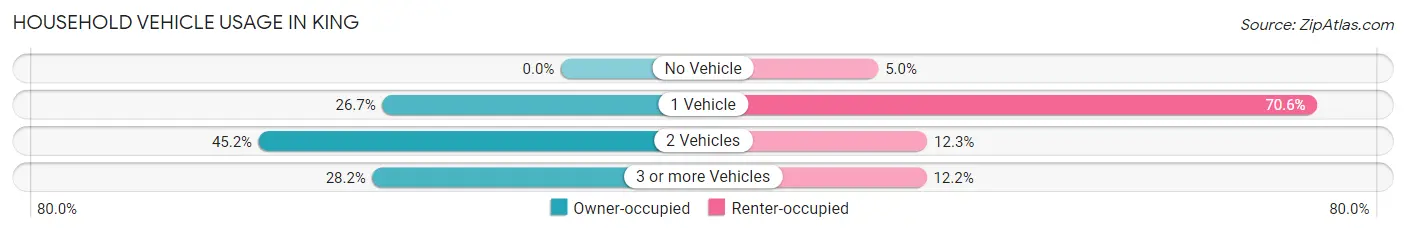
| Vehicles per Household | Owner-occupied | Renter-occupied |
| No Vehicle | 0 (0.0%) | 51 (5.0%) |
| 1 Vehicle | 528 (26.7%) | 724 (70.6%) |
| 2 Vehicles | 893 (45.2%) | 126 (12.3%) |
| 3 or more Vehicles | 557 (28.2%) | 125 (12.2%) |
| Total | 1,978 (100.0%) | 1,026 (100.0%) |
Real Estate & Mortgages in King
Real Estate and Mortgage Overview in King
| Characteristic | Without Mortgage | With Mortgage |
| Housing Units | 623 | 1,355 |
| Median Property Value | $119,800 | $199,200 |
| Median Household Income | $44,925 | $286 |
| Monthly Housing Costs | $487 | $35 |
| Real Estate Taxes | $1,401 | $16 |
Property Value by Mortgage Status in King
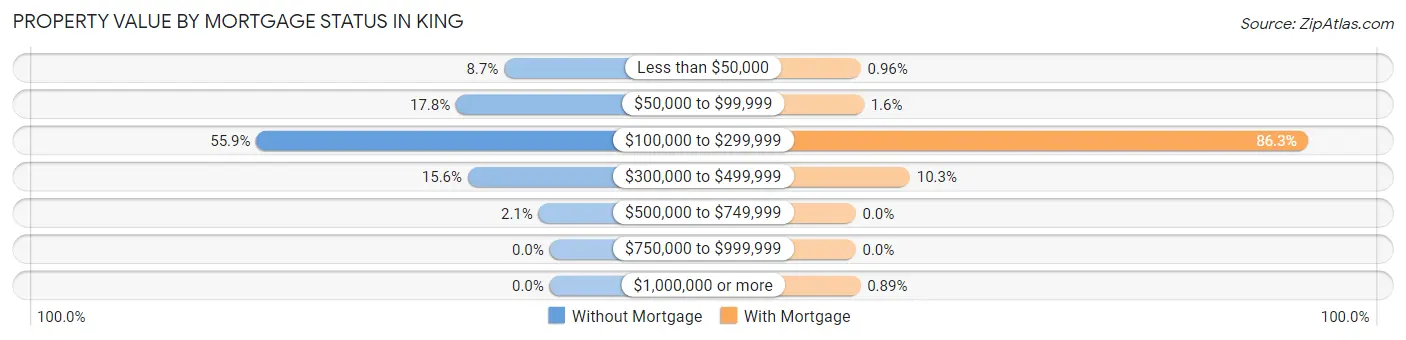
| Property Value | Without Mortgage | With Mortgage |
| Less than $50,000 | 54 (8.7%) | 13 (1.0%) |
| $50,000 to $99,999 | 111 (17.8%) | 21 (1.5%) |
| $100,000 to $299,999 | 348 (55.9%) | 1,169 (86.3%) |
| $300,000 to $499,999 | 97 (15.6%) | 140 (10.3%) |
| $500,000 to $749,999 | 13 (2.1%) | 0 (0.0%) |
| $750,000 to $999,999 | 0 (0.0%) | 0 (0.0%) |
| $1,000,000 or more | 0 (0.0%) | 12 (0.9%) |
| Total | 623 (100.0%) | 1,355 (100.0%) |
Household Income by Mortgage Status in King
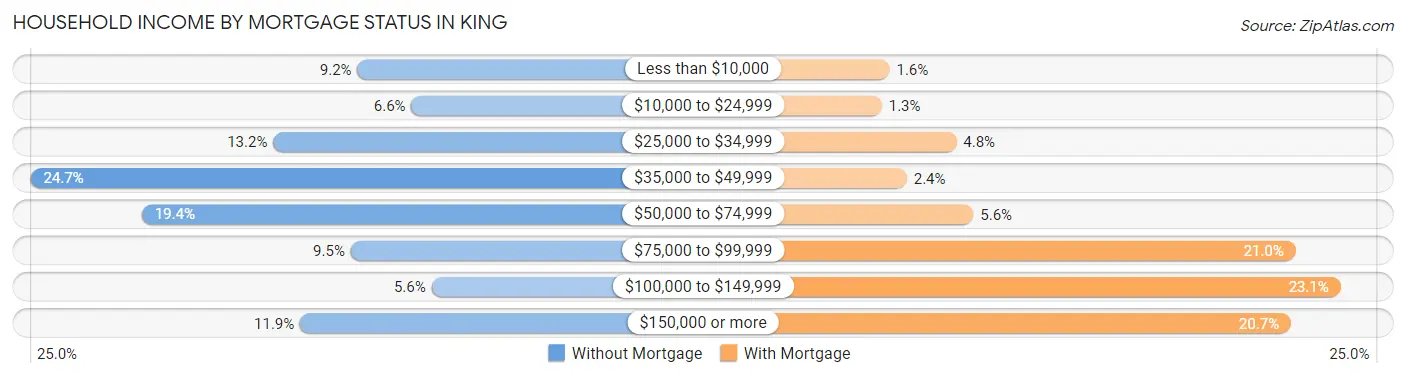
| Household Income | Without Mortgage | With Mortgage |
| Less than $10,000 | 57 (9.1%) | 22 (1.6%) |
| $10,000 to $24,999 | 41 (6.6%) | 17 (1.3%) |
| $25,000 to $34,999 | 82 (13.2%) | 65 (4.8%) |
| $35,000 to $49,999 | 154 (24.7%) | 33 (2.4%) |
| $50,000 to $74,999 | 121 (19.4%) | 76 (5.6%) |
| $75,000 to $99,999 | 59 (9.5%) | 284 (21.0%) |
| $100,000 to $149,999 | 35 (5.6%) | 313 (23.1%) |
| $150,000 or more | 74 (11.9%) | 281 (20.7%) |
| Total | 623 (100.0%) | 1,355 (100.0%) |
Property Value to Household Income Ratio in King
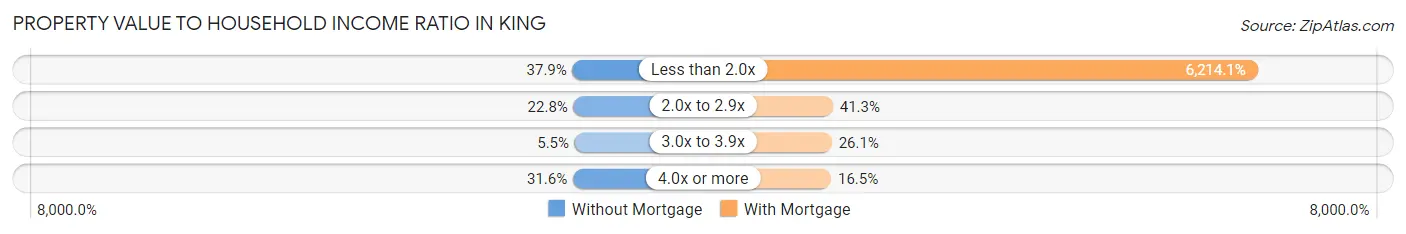
| Value-to-Income Ratio | Without Mortgage | With Mortgage |
| Less than 2.0x | 236 (37.9%) | 84,201 (6,214.1%) |
| 2.0x to 2.9x | 142 (22.8%) | 560 (41.3%) |
| 3.0x to 3.9x | 34 (5.5%) | 353 (26.1%) |
| 4.0x or more | 197 (31.6%) | 224 (16.5%) |
| Total | 623 (100.0%) | 1,355 (100.0%) |
Real Estate Taxes by Mortgage Status in King
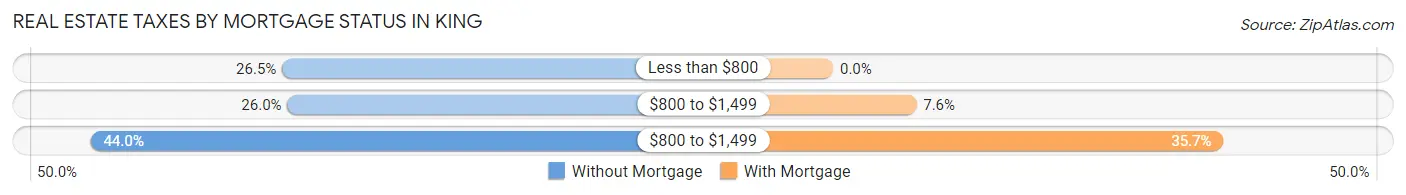
| Property Taxes | Without Mortgage | With Mortgage |
| Less than $800 | 165 (26.5%) | 0 (0.0%) |
| $800 to $1,499 | 162 (26.0%) | 103 (7.6%) |
| $800 to $1,499 | 274 (44.0%) | 483 (35.6%) |
| Total | 623 (100.0%) | 1,355 (100.0%) |
Health & Disability in King
Health Insurance Coverage by Age in King
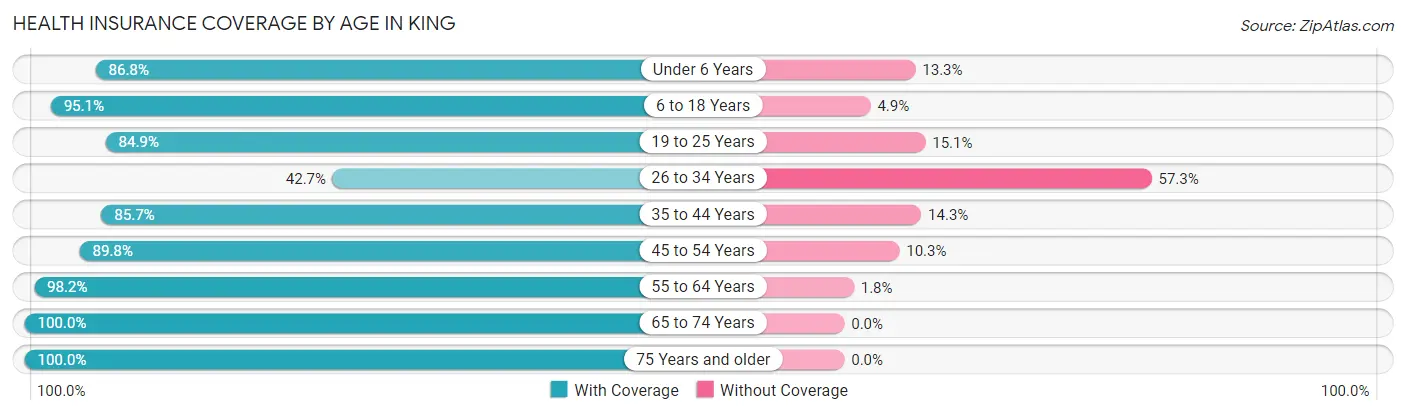
| Age Bracket | With Coverage | Without Coverage |
| Under 6 Years | 406 (86.8%) | 62 (13.3%) |
| 6 to 18 Years | 1,111 (95.1%) | 57 (4.9%) |
| 19 to 25 Years | 427 (84.9%) | 76 (15.1%) |
| 26 to 34 Years | 269 (42.7%) | 361 (57.3%) |
| 35 to 44 Years | 765 (85.7%) | 128 (14.3%) |
| 45 to 54 Years | 832 (89.7%) | 95 (10.2%) |
| 55 to 64 Years | 945 (98.2%) | 17 (1.8%) |
| 65 to 74 Years | 642 (100.0%) | 0 (0.0%) |
| 75 Years and older | 757 (100.0%) | 0 (0.0%) |
| Total | 6,154 (88.5%) | 796 (11.5%) |
Health Insurance Coverage by Citizenship Status in King
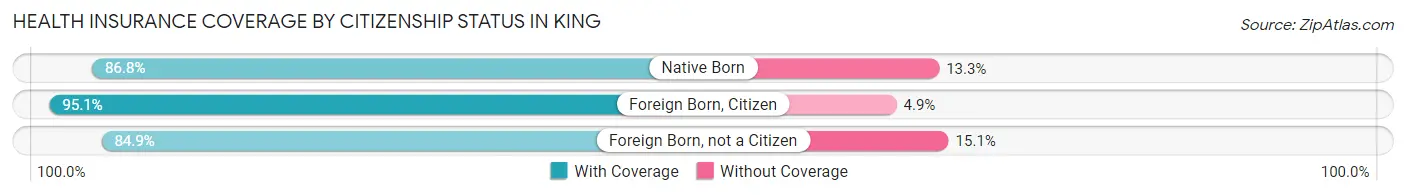
| Citizenship Status | With Coverage | Without Coverage |
| Native Born | 406 (86.8%) | 62 (13.3%) |
| Foreign Born, Citizen | 1,111 (95.1%) | 57 (4.9%) |
| Foreign Born, not a Citizen | 427 (84.9%) | 76 (15.1%) |
Health Insurance Coverage by Household Income in King
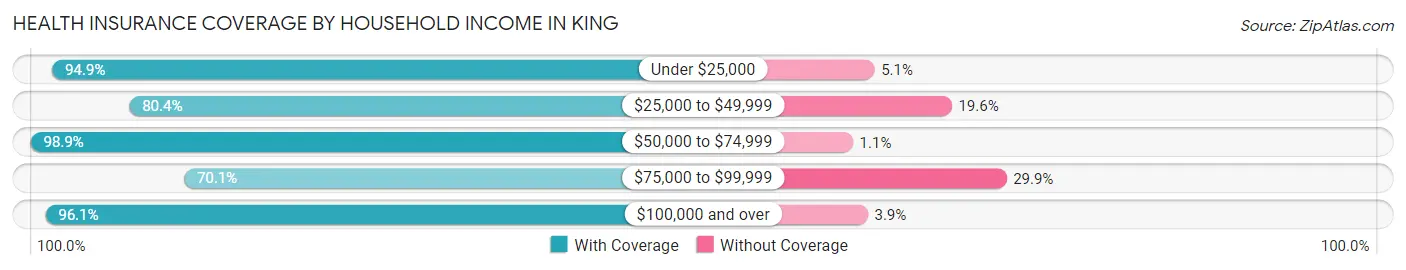
| Household Income | With Coverage | Without Coverage |
| Under $25,000 | 591 (94.9%) | 32 (5.1%) |
| $25,000 to $49,999 | 1,152 (80.4%) | 281 (19.6%) |
| $50,000 to $74,999 | 1,254 (98.9%) | 14 (1.1%) |
| $75,000 to $99,999 | 888 (70.1%) | 378 (29.9%) |
| $100,000 and over | 2,253 (96.1%) | 91 (3.9%) |
Public vs Private Health Insurance Coverage by Age in King
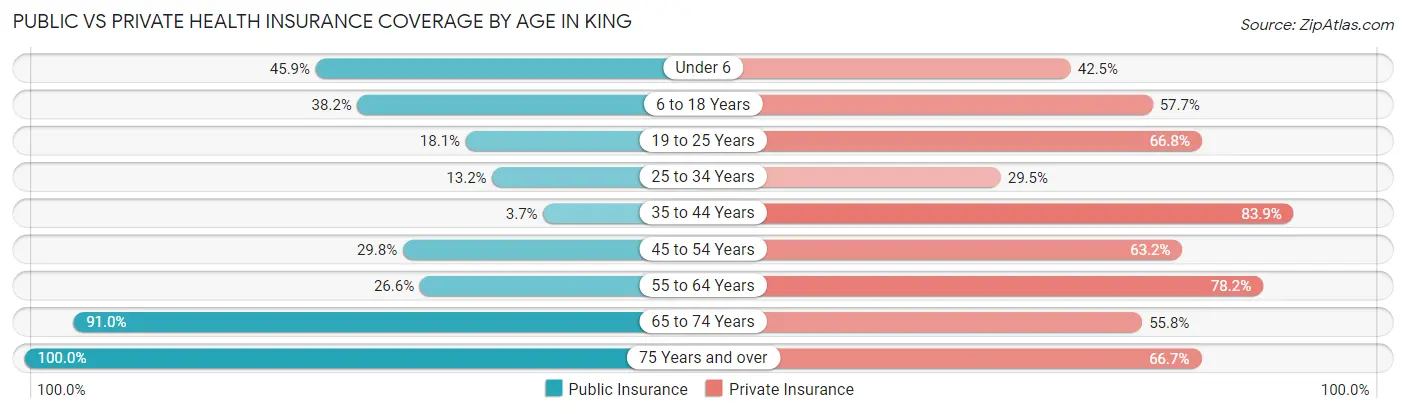
| Age Bracket | Public Insurance | Private Insurance |
| Under 6 | 215 (45.9%) | 199 (42.5%) |
| 6 to 18 Years | 446 (38.2%) | 674 (57.7%) |
| 19 to 25 Years | 91 (18.1%) | 336 (66.8%) |
| 25 to 34 Years | 83 (13.2%) | 186 (29.5%) |
| 35 to 44 Years | 33 (3.7%) | 749 (83.9%) |
| 45 to 54 Years | 276 (29.8%) | 586 (63.2%) |
| 55 to 64 Years | 256 (26.6%) | 752 (78.2%) |
| 65 to 74 Years | 584 (91.0%) | 358 (55.8%) |
| 75 Years and over | 757 (100.0%) | 505 (66.7%) |
| Total | 2,741 (39.4%) | 4,345 (62.5%) |
Disability Status by Sex by Age in King
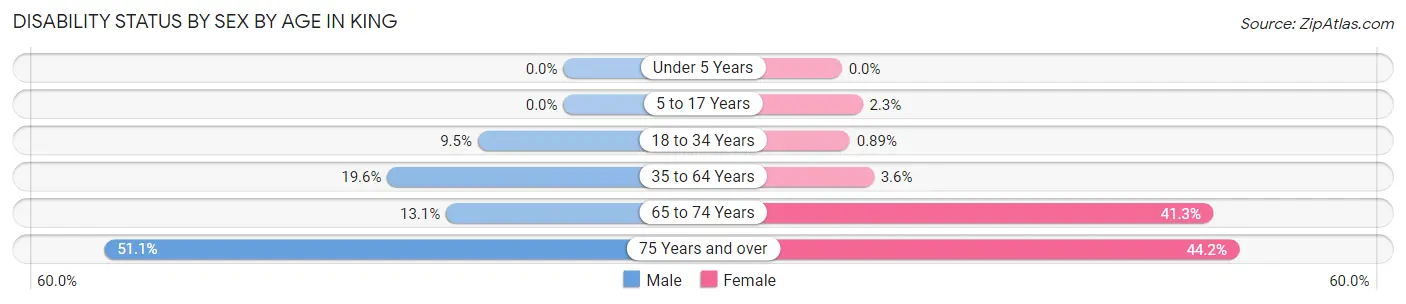
| Age Bracket | Male | Female |
| Under 5 Years | 0 (0.0%) | 0 (0.0%) |
| 5 to 17 Years | 0 (0.0%) | 16 (2.3%) |
| 18 to 34 Years | 51 (9.5%) | 6 (0.9%) |
| 35 to 64 Years | 264 (19.6%) | 51 (3.5%) |
| 65 to 74 Years | 32 (13.1%) | 164 (41.3%) |
| 75 Years and over | 158 (51.1%) | 198 (44.2%) |
Disability Class by Sex by Age in King
Disability Class: Hearing Difficulty
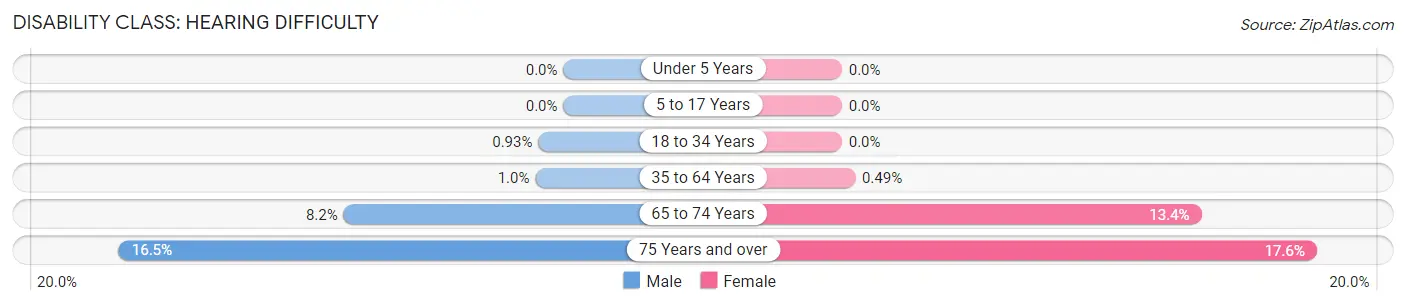
| Age Bracket | Male | Female |
| Under 5 Years | 0 (0.0%) | 0 (0.0%) |
| 5 to 17 Years | 0 (0.0%) | 0 (0.0%) |
| 18 to 34 Years | 5 (0.9%) | 0 (0.0%) |
| 35 to 64 Years | 14 (1.0%) | 7 (0.5%) |
| 65 to 74 Years | 20 (8.2%) | 53 (13.4%) |
| 75 Years and over | 51 (16.5%) | 79 (17.6%) |
Disability Class: Vision Difficulty
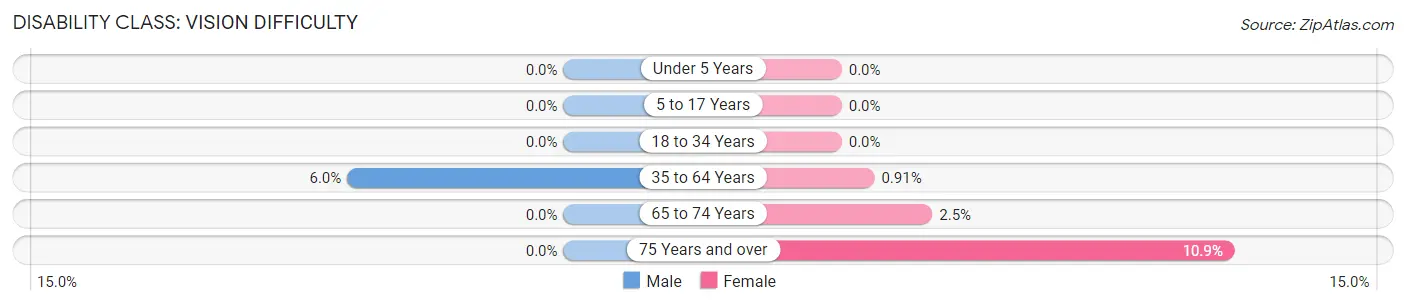
| Age Bracket | Male | Female |
| Under 5 Years | 0 (0.0%) | 0 (0.0%) |
| 5 to 17 Years | 0 (0.0%) | 0 (0.0%) |
| 18 to 34 Years | 0 (0.0%) | 0 (0.0%) |
| 35 to 64 Years | 81 (6.0%) | 13 (0.9%) |
| 65 to 74 Years | 0 (0.0%) | 10 (2.5%) |
| 75 Years and over | 0 (0.0%) | 49 (10.9%) |
Disability Class: Cognitive Difficulty
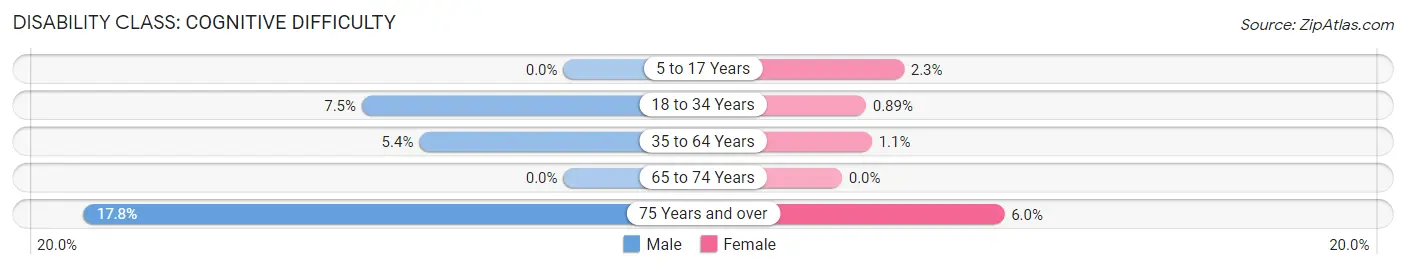
| Age Bracket | Male | Female |
| 5 to 17 Years | 0 (0.0%) | 16 (2.3%) |
| 18 to 34 Years | 40 (7.5%) | 6 (0.9%) |
| 35 to 64 Years | 72 (5.3%) | 16 (1.1%) |
| 65 to 74 Years | 0 (0.0%) | 0 (0.0%) |
| 75 Years and over | 55 (17.8%) | 27 (6.0%) |
Disability Class: Ambulatory Difficulty
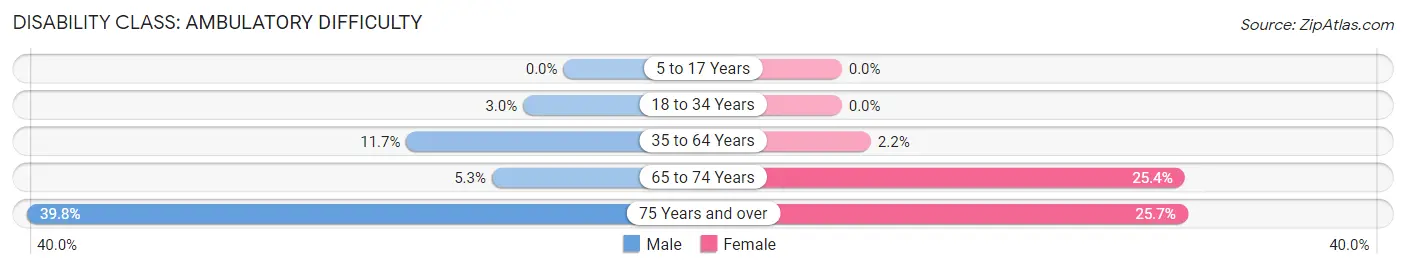
| Age Bracket | Male | Female |
| 5 to 17 Years | 0 (0.0%) | 0 (0.0%) |
| 18 to 34 Years | 16 (3.0%) | 0 (0.0%) |
| 35 to 64 Years | 157 (11.7%) | 31 (2.2%) |
| 65 to 74 Years | 13 (5.3%) | 101 (25.4%) |
| 75 Years and over | 123 (39.8%) | 115 (25.7%) |
Disability Class: Self-Care Difficulty
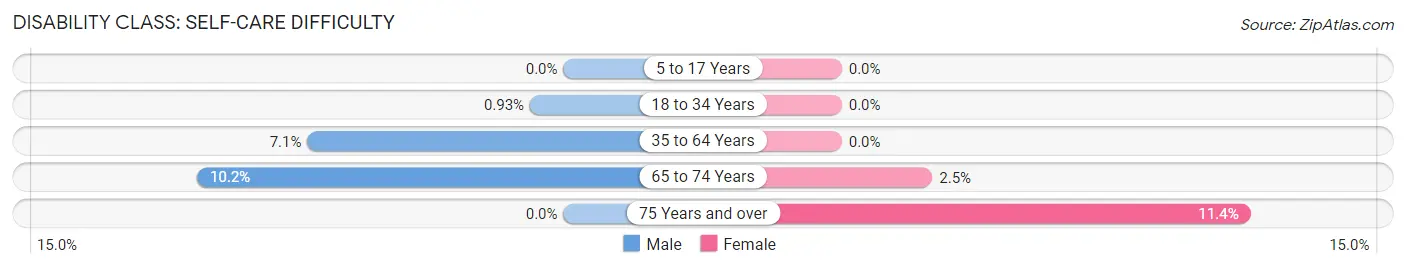
| Age Bracket | Male | Female |
| 5 to 17 Years | 0 (0.0%) | 0 (0.0%) |
| 18 to 34 Years | 5 (0.9%) | 0 (0.0%) |
| 35 to 64 Years | 96 (7.1%) | 0 (0.0%) |
| 65 to 74 Years | 25 (10.2%) | 10 (2.5%) |
| 75 Years and over | 0 (0.0%) | 51 (11.4%) |
Technology Access in King
Computing Device Access in King
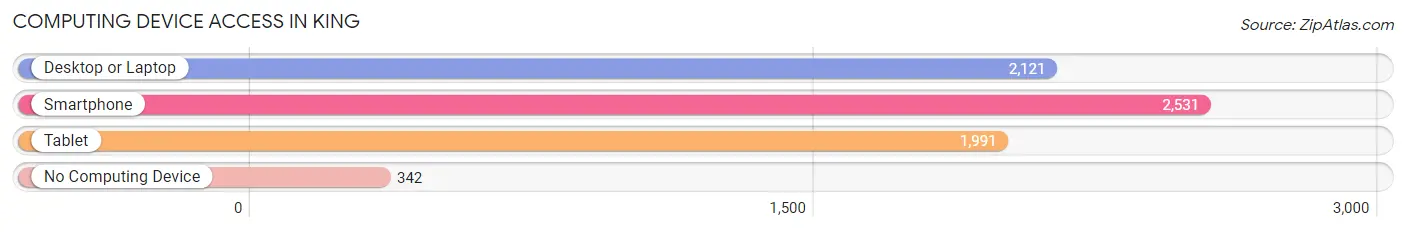
| Device Type | # Households | % Households |
| Desktop or Laptop | 2,121 | 70.6% |
| Smartphone | 2,531 | 84.3% |
| Tablet | 1,991 | 66.3% |
| No Computing Device | 342 | 11.4% |
| Total | 3,004 | 100.0% |
Internet Access in King
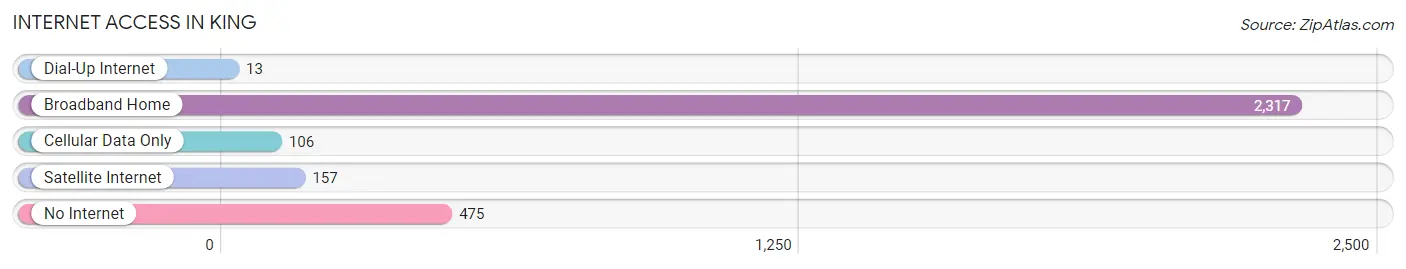
| Internet Type | # Households | % Households |
| Dial-Up Internet | 13 | 0.4% |
| Broadband Home | 2,317 | 77.1% |
| Cellular Data Only | 106 | 3.5% |
| Satellite Internet | 157 | 5.2% |
| No Internet | 475 | 15.8% |
| Total | 3,004 | 100.0% |
King Summary
King, North Carolina is a small town located in Stokes County in the northwest corner of the state. It is situated in the foothills of the Blue Ridge Mountains and is part of the Piedmont Triad region. The town was founded in 1874 and has a population of approximately 6,000 people.
Geography
King is located in the northwest corner of Stokes County, North Carolina, and is situated in the foothills of the Blue Ridge Mountains. The town is located at the intersection of US Highway 52 and NC Highway 8. The town is approximately 25 miles north of Winston-Salem and is part of the Piedmont Triad region. The town is surrounded by rolling hills and is home to several small lakes and streams.
Economy
The economy of King is largely based on agriculture and manufacturing. The town is home to several large farms, including tobacco, corn, and soybean farms. The town is also home to several manufacturing companies, including furniture, textiles, and plastics. The town is also home to several small businesses, including restaurants, retail stores, and service providers.
Demographics
As of the 2010 census, the population of King was 6,000 people. The racial makeup of the town was 87.3% White, 8.2% African American, 0.7% Native American, 0.7% Asian, and 2.1% from other races. The median household income was $37,000 and the median family income was $45,000. The town has a poverty rate of 17.3%.
History
King was founded in 1874 and was named after the King family, who were early settlers in the area. The town was originally a farming community and was home to several large farms. In the early 1900s, the town began to grow and several manufacturing companies were established. The town was also home to several small businesses, including restaurants, retail stores, and service providers. In the 1950s, the town began to experience a population boom and the town's population grew to over 6,000 people.
Today, King is a small town with a population of approximately 6,000 people. The town is home to several large farms and manufacturing companies, as well as several small businesses. The town is also home to several parks and recreational areas, including the King City Park and the King Recreation Center. The town is also home to several churches and schools, including King Elementary School and King High School.
Common Questions
What is Per Capita Income in King?
Per Capita income in King is $37,456.
What is the Median Family Income in King?
Median Family Income in King is $78,996.
What is the Median Household income in King?
Median Household Income in King is $59,770.
What is Income or Wage Gap in King?
Income or Wage Gap in King is 35.1%.
Women in King earn 64.9 cents for every dollar earned by a man.
What is Inequality or Gini Index in King?
Inequality or Gini Index in King is 0.48.
What is the Total Population of King?
Total Population of King is 7,210.
What is the Total Male Population of King?
Total Male Population of King is 3,203.
What is the Total Female Population of King?
Total Female Population of King is 4,007.
What is the Ratio of Males per 100 Females in King?
There are 79.94 Males per 100 Females in King.
What is the Ratio of Females per 100 Males in King?
There are 125.10 Females per 100 Males in King.
What is the Median Population Age in King?
Median Population Age in King is 43.7 Years.
What is the Average Family Size in King
Average Family Size in King is 3.0 People.
What is the Average Household Size in King
Average Household Size in King is 2.3 People.
How Large is the Labor Force in King?
There are 3,194 People in the Labor Forcein in King.
What is the Percentage of People in the Labor Force in King?
54.6% of People are in the Labor Force in King.
What is the Unemployment Rate in King?
Unemployment Rate in King is 2.1%.