Surf City, NC Map & Demographics
Surf City Map
Surf City Overview
$45,364
PER CAPITA INCOME
$110,554
AVG FAMILY INCOME
$85,714
AVG HOUSEHOLD INCOME
25.8%
WAGE / INCOME GAP [ % ]
74.2¢/ $1
WAGE / INCOME GAP [ $ ]
0.45
INEQUALITY / GINI INDEX
3,888
TOTAL POPULATION
1,926
MALE POPULATION
1,962
FEMALE POPULATION
98.17
MALES / 100 FEMALES
101.87
FEMALES / 100 MALES
39.3
MEDIAN AGE
3.2
AVG FAMILY SIZE
2.7
AVG HOUSEHOLD SIZE
1,861
LABOR FORCE [ PEOPLE ]
61.7%
PERCENT IN LABOR FORCE
3.0%
UNEMPLOYMENT RATE
Surf City Area Codes
Income in Surf City
Income Overview in Surf City
Per Capita Income in Surf City is $45,364, while median incomes of families and households are $110,554 and $85,714 respectively.
| Characteristic | Number | Measure |
| Per Capita Income | 3,888 | $45,364 |
| Median Family Income | 1,015 | $110,554 |
| Mean Family Income | 1,015 | $128,794 |
| Median Household Income | 1,456 | $85,714 |
| Mean Household Income | 1,456 | $116,083 |
| Income Deficit | 1,015 | $0 |
| Wage / Income Gap (%) | 3,888 | 25.78% |
| Wage / Income Gap ($) | 3,888 | 74.22¢ per $1 |
| Gini / Inequality Index | 3,888 | 0.45 |
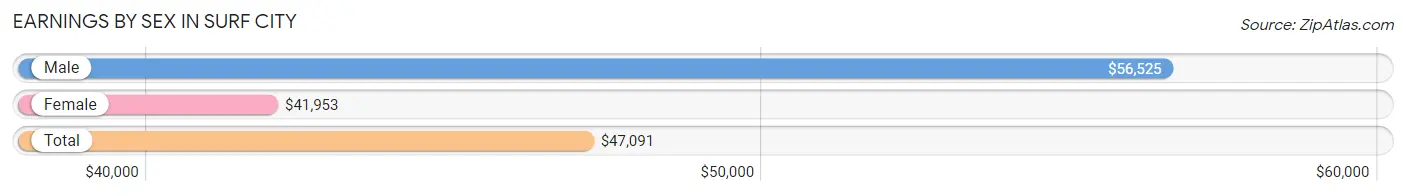
Earnings by Sex in Surf City
Average Earnings in Surf City are $47,091, $56,525 for men and $41,953 for women, a difference of 25.8%.
| Sex | Number | Average Earnings |
| Male | 1,051 (54.2%) | $56,525 |
| Female | 887 (45.8%) | $41,953 |
| Total | 1,938 (100.0%) | $47,091 |
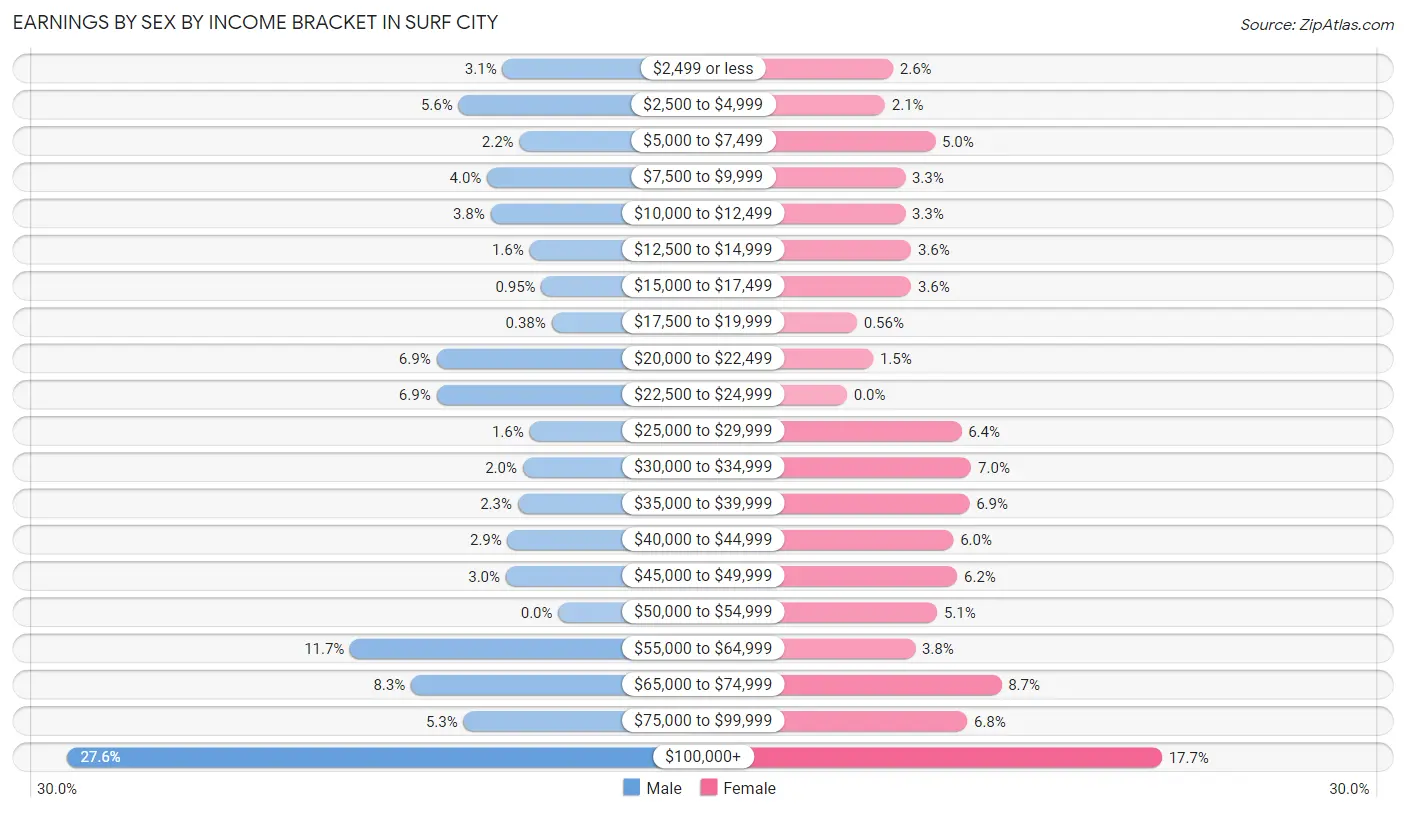
Earnings by Sex by Income Bracket in Surf City
The most common earnings brackets in Surf City are $100,000+ for men (290 | 27.6%) and $100,000+ for women (157 | 17.7%).
| Income | Male | Female |
| $2,499 or less | 33 (3.1%) | 23 (2.6%) |
| $2,500 to $4,999 | 59 (5.6%) | 19 (2.1%) |
| $5,000 to $7,499 | 23 (2.2%) | 44 (5.0%) |
| $7,500 to $9,999 | 42 (4.0%) | 29 (3.3%) |
| $10,000 to $12,499 | 40 (3.8%) | 29 (3.3%) |
| $12,500 to $14,999 | 17 (1.6%) | 32 (3.6%) |
| $15,000 to $17,499 | 10 (0.9%) | 32 (3.6%) |
| $17,500 to $19,999 | 4 (0.4%) | 5 (0.6%) |
| $20,000 to $22,499 | 72 (6.9%) | 13 (1.5%) |
| $22,500 to $24,999 | 72 (6.9%) | 0 (0.0%) |
| $25,000 to $29,999 | 17 (1.6%) | 57 (6.4%) |
| $30,000 to $34,999 | 21 (2.0%) | 62 (7.0%) |
| $35,000 to $39,999 | 24 (2.3%) | 61 (6.9%) |
| $40,000 to $44,999 | 30 (2.9%) | 53 (6.0%) |
| $45,000 to $49,999 | 31 (2.9%) | 55 (6.2%) |
| $50,000 to $54,999 | 0 (0.0%) | 45 (5.1%) |
| $55,000 to $64,999 | 123 (11.7%) | 34 (3.8%) |
| $65,000 to $74,999 | 87 (8.3%) | 77 (8.7%) |
| $75,000 to $99,999 | 56 (5.3%) | 60 (6.8%) |
| $100,000+ | 290 (27.6%) | 157 (17.7%) |
| Total | 1,051 (100.0%) | 887 (100.0%) |
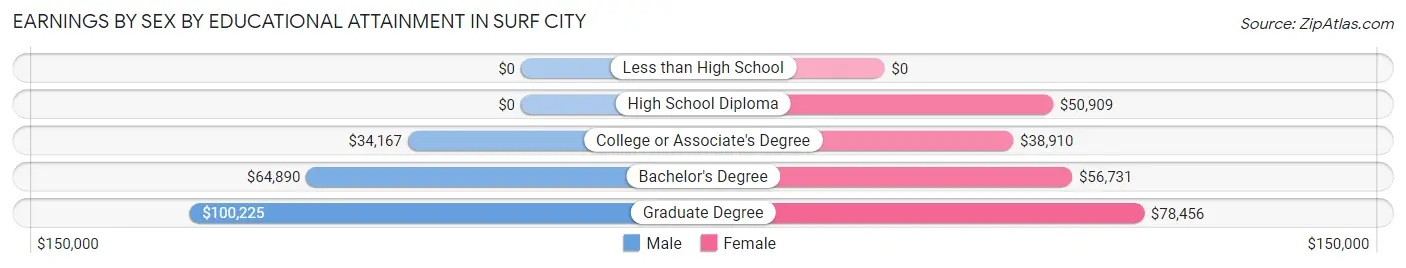
Earnings by Sex by Educational Attainment in Surf City
Average earnings in Surf City are $64,040 for men and $49,798 for women, a difference of 22.2%. Men with an educational attainment of graduate degree enjoy the highest average annual earnings of $100,225, while those with college or associate's degree education earn the least with $34,167. Women with an educational attainment of graduate degree earn the most with the average annual earnings of $78,456, while those with college or associate's degree education have the smallest earnings of $38,910.
| Educational Attainment | Male Income | Female Income |
| Less than High School | - | - |
| High School Diploma | - | - |
| College or Associate's Degree | $34,167 | $38,910 |
| Bachelor's Degree | $64,890 | $56,731 |
| Graduate Degree | $100,225 | $78,456 |
| Total | $64,040 | $49,798 |
Family Income in Surf City
Family Income Brackets in Surf City
According to the Surf City family income data, there are 334 families falling into the $100,000 to $149,999 income range, which is the most common income bracket and makes up 32.9% of all families. Conversely, the $10,000 to $14,999 income bracket is the least frequent group with only 6 families (0.6%) belonging to this category.
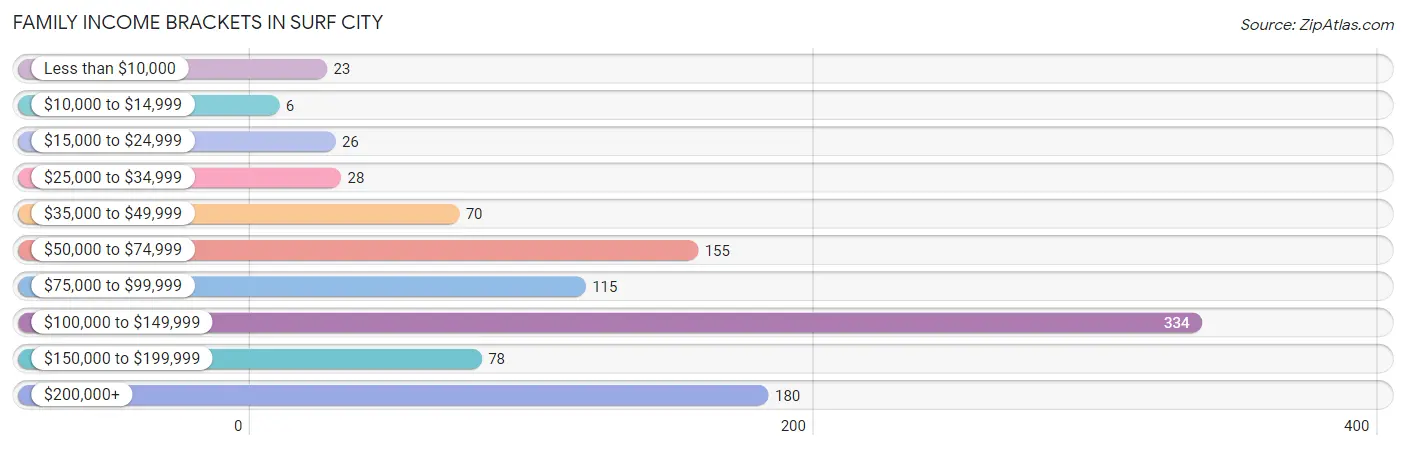
| Income Bracket | # Families | % Families |
| Less than $10,000 | 23 | 2.3% |
| $10,000 to $14,999 | 6 | 0.6% |
| $15,000 to $24,999 | 26 | 2.6% |
| $25,000 to $34,999 | 28 | 2.8% |
| $35,000 to $49,999 | 70 | 6.9% |
| $50,000 to $74,999 | 155 | 15.3% |
| $75,000 to $99,999 | 115 | 11.3% |
| $100,000 to $149,999 | 334 | 32.9% |
| $150,000 to $199,999 | 78 | 7.7% |
| $200,000+ | 180 | 17.7% |
Family Income by Famaliy Size in Surf City
2-person families (562 | 55.4%) account for the highest median family income in Surf City with $110,600 per family, while 2-person families (562 | 55.4%) have the highest median income of $55,300 per family member.
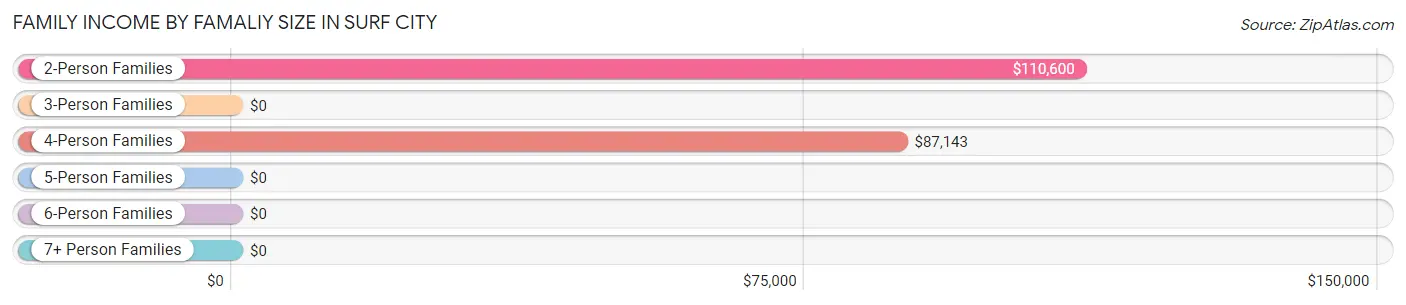
| Income Bracket | # Families | Median Income |
| 2-Person Families | 562 (55.4%) | $110,600 |
| 3-Person Families | 117 (11.5%) | $0 |
| 4-Person Families | 202 (19.9%) | $87,143 |
| 5-Person Families | 94 (9.3%) | $0 |
| 6-Person Families | 19 (1.9%) | $0 |
| 7+ Person Families | 21 (2.1%) | $0 |
| Total | 1,015 (100.0%) | $110,554 |
Family Income by Number of Earners in Surf City
The median family income in Surf City is $110,554, with families comprising 3+ earners (54) having the highest median family income of $209,643, while families with no earners (164) have the lowest median family income of $78,000, accounting for 5.3% and 16.2% of families, respectively.
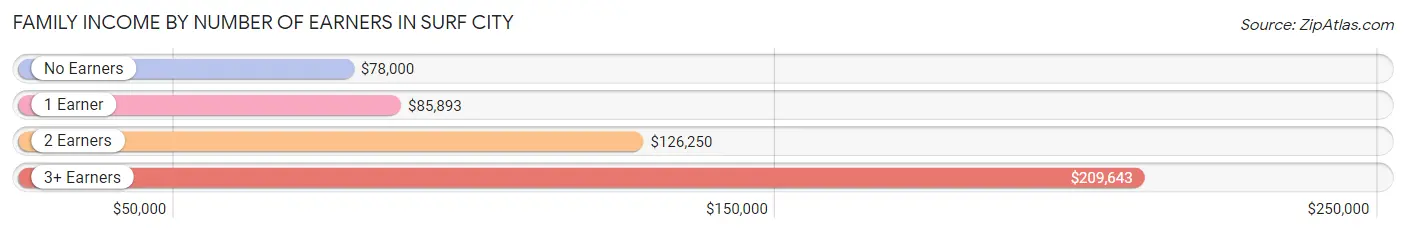
| Number of Earners | # Families | Median Income |
| No Earners | 164 (16.2%) | $78,000 |
| 1 Earner | 361 (35.6%) | $85,893 |
| 2 Earners | 436 (43.0%) | $126,250 |
| 3+ Earners | 54 (5.3%) | $209,643 |
| Total | 1,015 (100.0%) | $110,554 |
Household Income in Surf City
Household Income Brackets in Surf City
With 368 households falling in the category, the $100,000 to $149,999 income range is the most frequent in Surf City, accounting for 25.3% of all households. In contrast, only 17 households (1.2%) fall into the $10,000 to $14,999 income bracket, making it the least populous group.
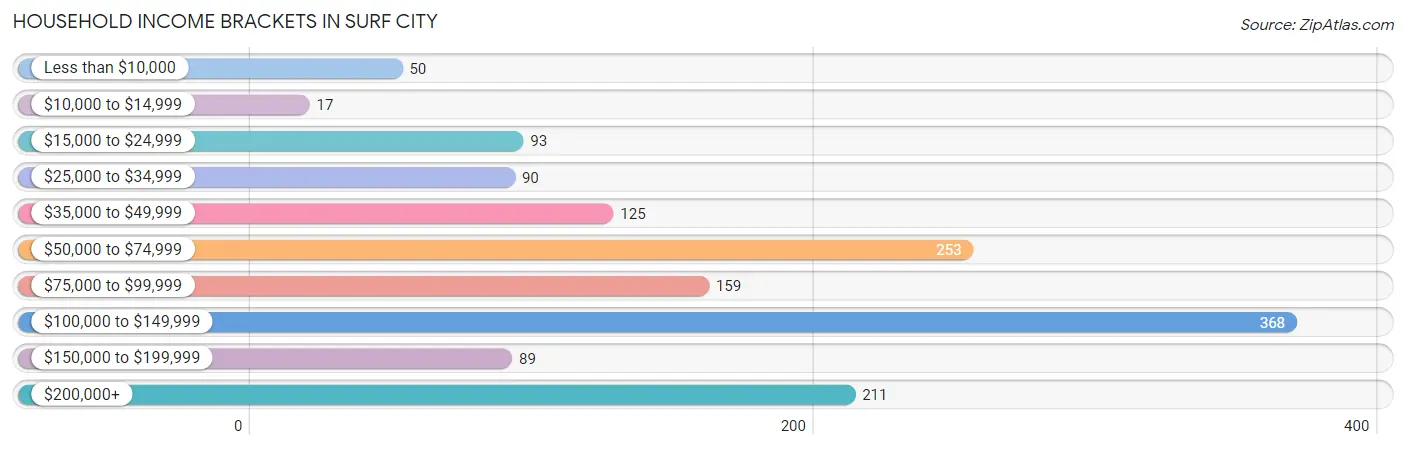
| Income Bracket | # Households | % Households |
| Less than $10,000 | 50 | 3.4% |
| $10,000 to $14,999 | 17 | 1.2% |
| $15,000 to $24,999 | 93 | 6.4% |
| $25,000 to $34,999 | 90 | 6.2% |
| $35,000 to $49,999 | 125 | 8.6% |
| $50,000 to $74,999 | 253 | 17.4% |
| $75,000 to $99,999 | 159 | 10.9% |
| $100,000 to $149,999 | 368 | 25.3% |
| $150,000 to $199,999 | 89 | 6.1% |
| $200,000+ | 211 | 14.5% |
Household Income by Householder Age in Surf City
The median household income in Surf City is $85,714, with the highest median household income of $110,239 found in the 45 to 64 years age bracket for the primary householder. A total of 584 households (40.1%) fall into this category.
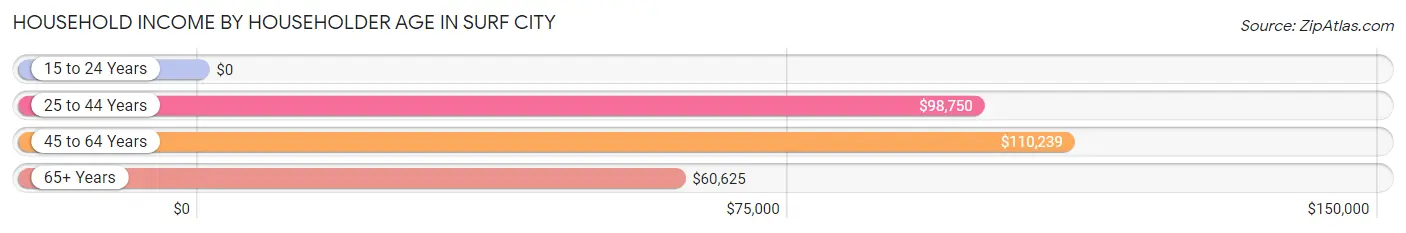
| Income Bracket | # Households | Median Income |
| 15 to 24 Years | 0 (0.0%) | $0 |
| 25 to 44 Years | 414 (28.4%) | $98,750 |
| 45 to 64 Years | 584 (40.1%) | $110,239 |
| 65+ Years | 458 (31.5%) | $60,625 |
| Total | 1,456 (100.0%) | $85,714 |
Poverty in Surf City
Income Below Poverty by Sex and Age in Surf City
With 3.7% poverty level for males and 6.0% for females among the residents of Surf City, 65 to 74 year old males and 15 year old females are the most vulnerable to poverty, with 32 males (12.1%) and 4 females (100.0%) in their respective age groups living below the poverty level.
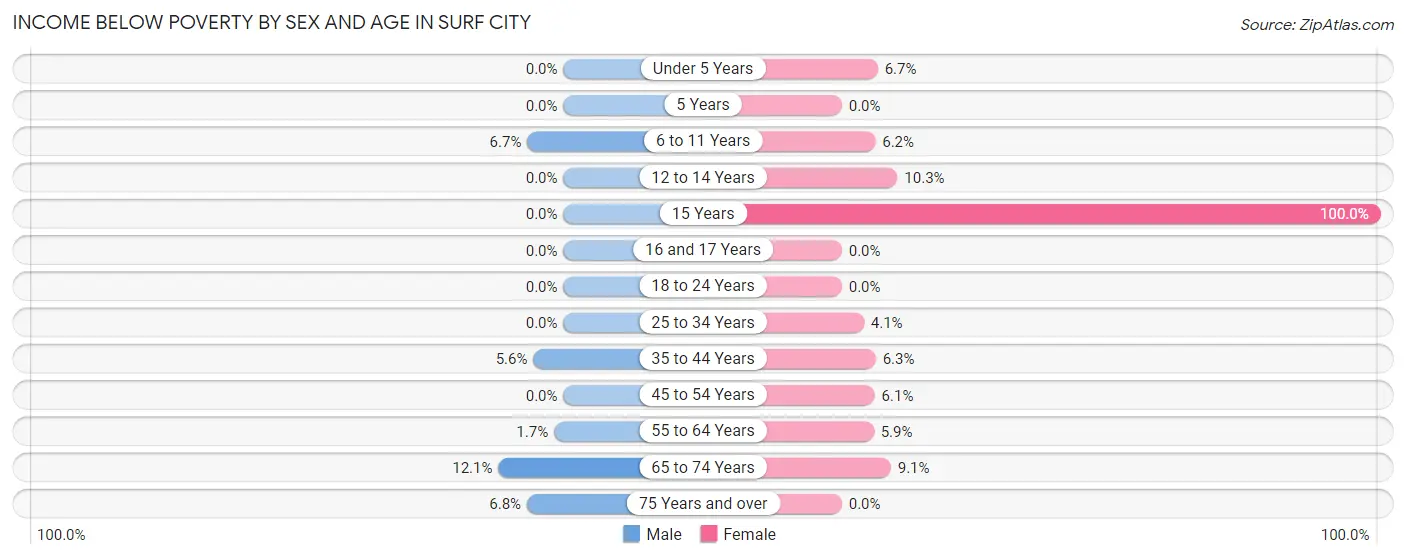
| Age Bracket | Male | Female |
| Under 5 Years | 0 (0.0%) | 6 (6.7%) |
| 5 Years | 0 (0.0%) | 0 (0.0%) |
| 6 to 11 Years | 15 (6.7%) | 13 (6.2%) |
| 12 to 14 Years | 0 (0.0%) | 13 (10.3%) |
| 15 Years | 0 (0.0%) | 4 (100.0%) |
| 16 and 17 Years | 0 (0.0%) | 0 (0.0%) |
| 18 to 24 Years | 0 (0.0%) | 0 (0.0%) |
| 25 to 34 Years | 0 (0.0%) | 8 (4.1%) |
| 35 to 44 Years | 13 (5.6%) | 15 (6.3%) |
| 45 to 54 Years | 0 (0.0%) | 13 (6.1%) |
| 55 to 64 Years | 6 (1.7%) | 20 (5.9%) |
| 65 to 74 Years | 32 (12.1%) | 24 (9.1%) |
| 75 Years and over | 5 (6.8%) | 0 (0.0%) |
| Total | 71 (3.7%) | 116 (6.0%) |
Income Above Poverty by Sex and Age in Surf City
According to the poverty statistics in Surf City, males aged under 5 years and females aged 5 years are the age groups that are most secure financially, with 100.0% of males and 100.0% of females in these age groups living above the poverty line.
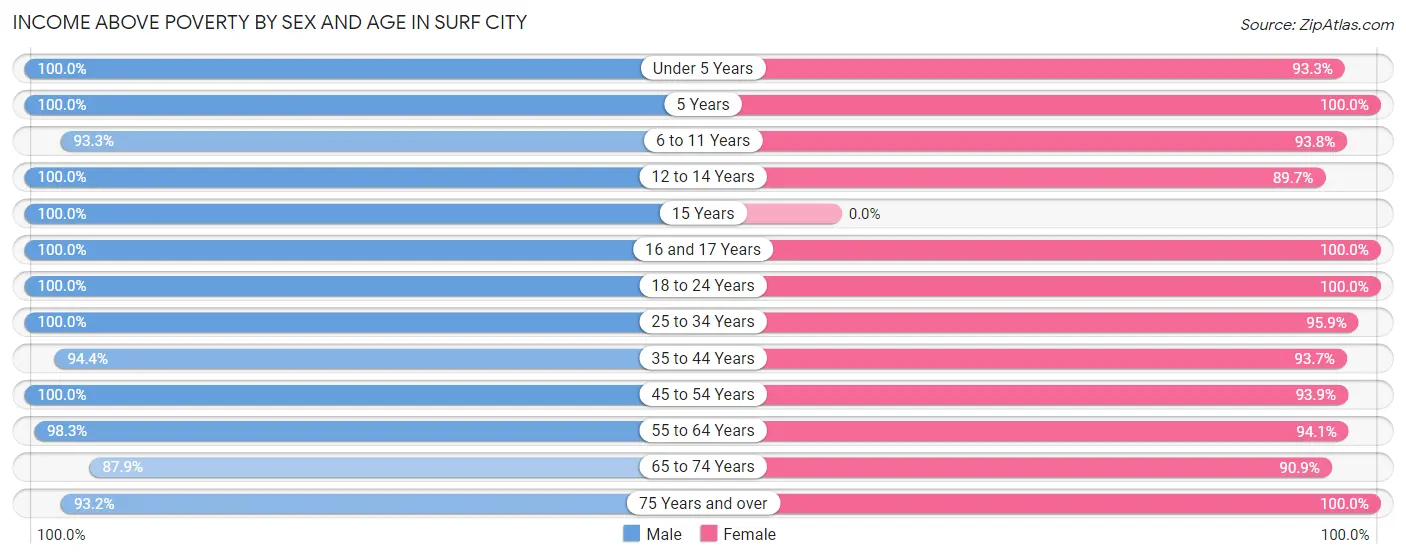
| Age Bracket | Male | Female |
| Under 5 Years | 65 (100.0%) | 84 (93.3%) |
| 5 Years | 26 (100.0%) | 14 (100.0%) |
| 6 to 11 Years | 209 (93.3%) | 196 (93.8%) |
| 12 to 14 Years | 76 (100.0%) | 113 (89.7%) |
| 15 Years | 20 (100.0%) | 0 (0.0%) |
| 16 and 17 Years | 51 (100.0%) | 42 (100.0%) |
| 18 to 24 Years | 161 (100.0%) | 134 (100.0%) |
| 25 to 34 Years | 253 (100.0%) | 187 (95.9%) |
| 35 to 44 Years | 220 (94.4%) | 223 (93.7%) |
| 45 to 54 Years | 133 (100.0%) | 200 (93.9%) |
| 55 to 64 Years | 339 (98.3%) | 317 (94.1%) |
| 65 to 74 Years | 233 (87.9%) | 240 (90.9%) |
| 75 Years and over | 69 (93.2%) | 79 (100.0%) |
| Total | 1,855 (96.3%) | 1,829 (94.0%) |
Income Below Poverty Among Married-Couple Families in Surf City
The poverty statistics for married-couple families in Surf City show that 3.2% or 28 of the total 876 families live below the poverty line. Families with 1 or 2 children have the highest poverty rate of 4.6%, comprising of 9 families. On the other hand, families with 3 or 4 children have the lowest poverty rate of 0.0%, which includes 0 families.
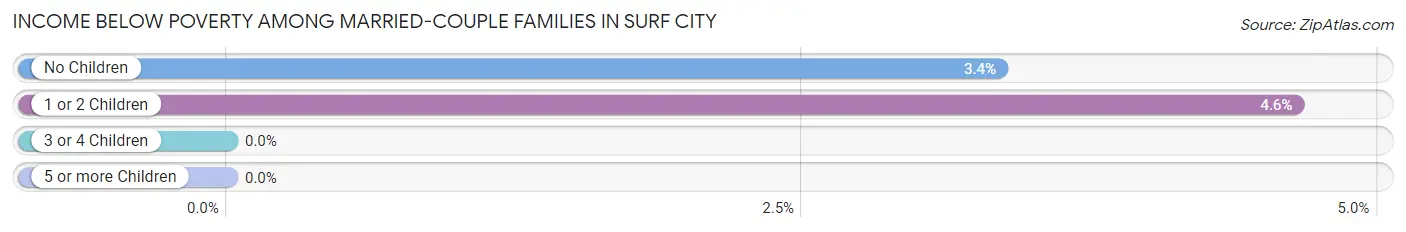
| Children | Above Poverty | Below Poverty |
| No Children | 548 (96.7%) | 19 (3.4%) |
| 1 or 2 Children | 185 (95.4%) | 9 (4.6%) |
| 3 or 4 Children | 115 (100.0%) | 0 (0.0%) |
| 5 or more Children | 0 (0.0%) | 0 (0.0%) |
| Total | 848 (96.8%) | 28 (3.2%) |
Income Below Poverty Among Single-Parent Households in Surf City
According to the poverty data in Surf City, 100.0% or 17 single-father households and 4.9% or 6 single-mother households are living below the poverty line. Among single-father households, those with 1 or 2 children have the highest poverty rate, with 17 households (100.0%) experiencing poverty. Likewise, among single-mother households, those with no children have the highest poverty rate, with 6 households (13.6%) falling below the poverty line.
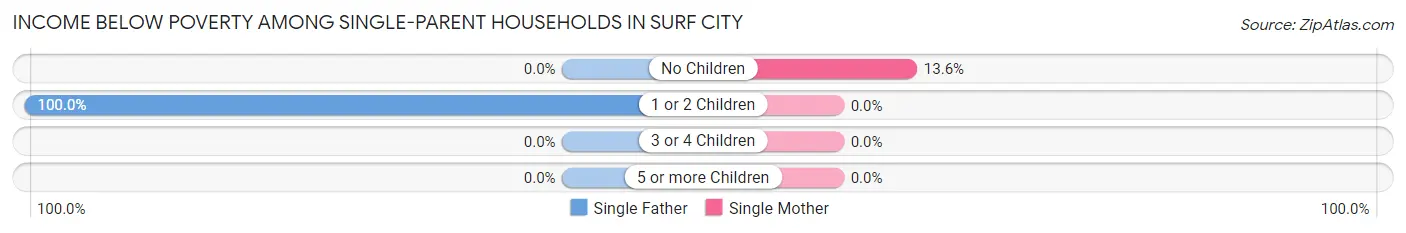
| Children | Single Father | Single Mother |
| No Children | 0 (0.0%) | 6 (13.6%) |
| 1 or 2 Children | 17 (100.0%) | 0 (0.0%) |
| 3 or 4 Children | 0 (0.0%) | 0 (0.0%) |
| 5 or more Children | 0 (0.0%) | 0 (0.0%) |
| Total | 17 (100.0%) | 6 (4.9%) |
Income Below Poverty Among Married-Couple vs Single-Parent Households in Surf City
The poverty data for Surf City shows that 28 of the married-couple family households (3.2%) and 23 of the single-parent households (16.6%) are living below the poverty level. Within the married-couple family households, those with 1 or 2 children have the highest poverty rate, with 9 households (4.6%) falling below the poverty line. Among the single-parent households, those with 1 or 2 children have the highest poverty rate, with 17 household (17.9%) living below poverty.
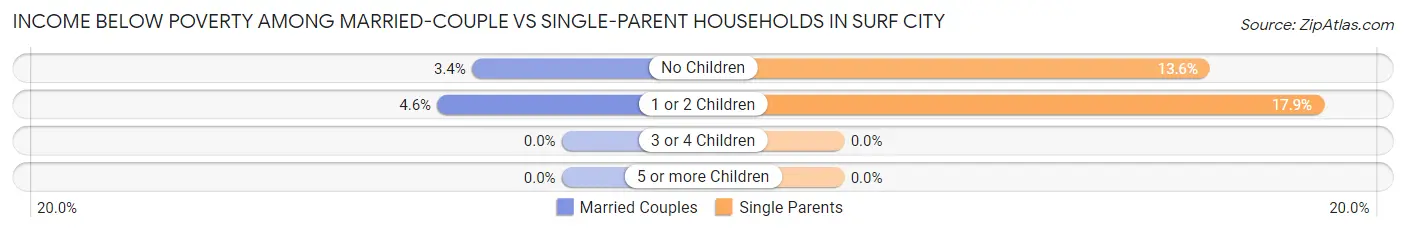
| Children | Married-Couple Families | Single-Parent Households |
| No Children | 19 (3.4%) | 6 (13.6%) |
| 1 or 2 Children | 9 (4.6%) | 17 (17.9%) |
| 3 or 4 Children | 0 (0.0%) | 0 (0.0%) |
| 5 or more Children | 0 (0.0%) | 0 (0.0%) |
| Total | 28 (3.2%) | 23 (16.6%) |
Race in Surf City
The most populous races in Surf City are White / Caucasian (3,531 | 90.8%), Hispanic or Latino (223 | 5.7%), and Two or more Races (189 | 4.9%).
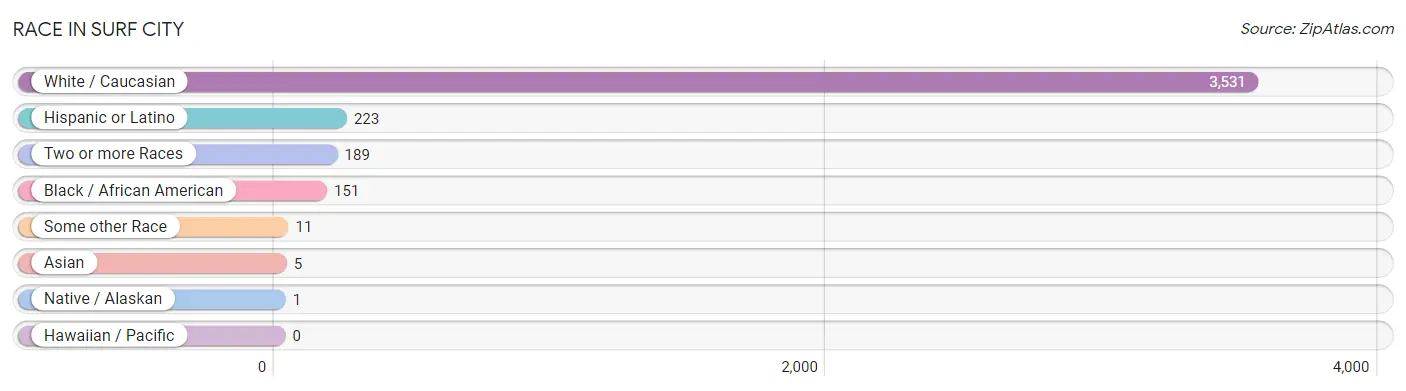
| Race | # Population | % Population |
| Asian | 5 | 0.1% |
| Black / African American | 151 | 3.9% |
| Hawaiian / Pacific | 0 | 0.0% |
| Hispanic or Latino | 223 | 5.7% |
| Native / Alaskan | 1 | 0.0% |
| White / Caucasian | 3,531 | 90.8% |
| Two or more Races | 189 | 4.9% |
| Some other Race | 11 | 0.3% |
| Total | 3,888 | 100.0% |
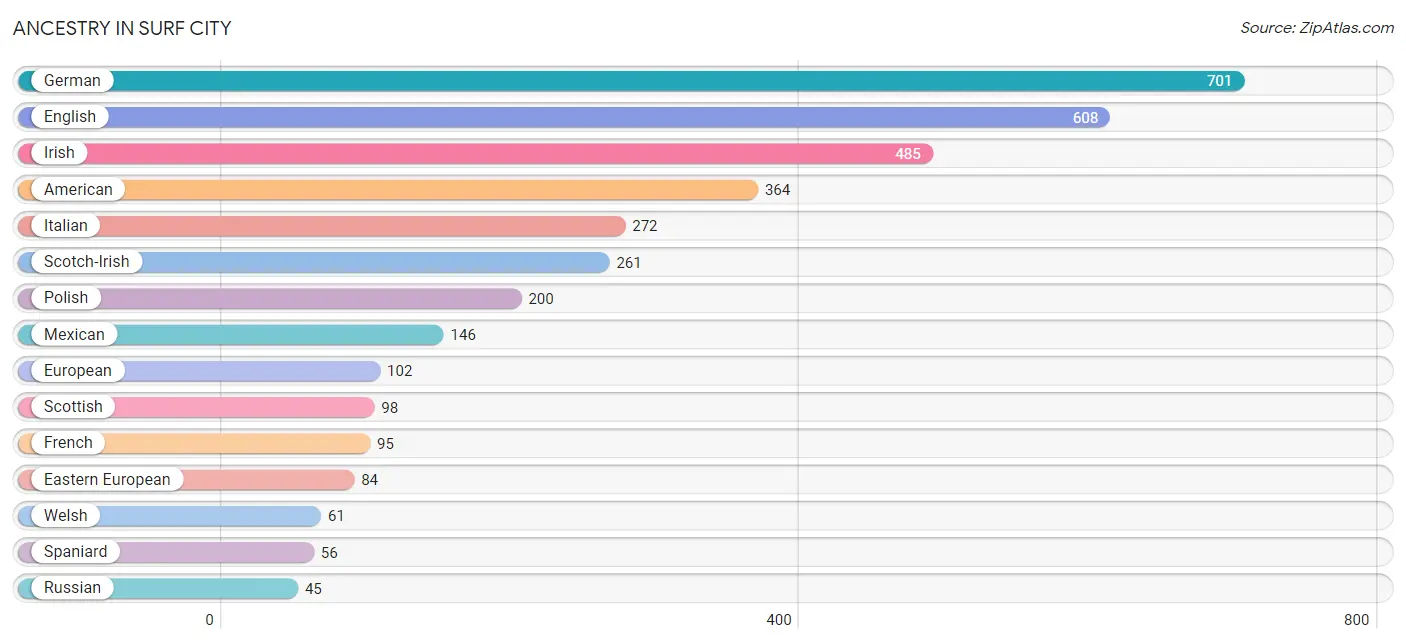
Ancestry in Surf City
The most populous ancestries reported in Surf City are German (701 | 18.0%), English (608 | 15.6%), Irish (485 | 12.5%), American (364 | 9.4%), and Italian (272 | 7.0%), together accounting for 62.5% of all Surf City residents.
| Ancestry | # Population | % Population |
| American | 364 | 9.4% |
| Arab | 10 | 0.3% |
| Austrian | 4 | 0.1% |
| British | 21 | 0.5% |
| Canadian | 21 | 0.5% |
| Central American Indian | 8 | 0.2% |
| Colombian | 4 | 0.1% |
| Cuban | 5 | 0.1% |
| Danish | 5 | 0.1% |
| Dutch | 40 | 1.0% |
| Eastern European | 84 | 2.2% |
| English | 608 | 15.6% |
| European | 102 | 2.6% |
| French | 95 | 2.4% |
| French Canadian | 7 | 0.2% |
| German | 701 | 18.0% |
| Greek | 7 | 0.2% |
| Hungarian | 12 | 0.3% |
| Indian (Asian) | 13 | 0.3% |
| Irish | 485 | 12.5% |
| Italian | 272 | 7.0% |
| Lebanese | 10 | 0.3% |
| Malaysian | 13 | 0.3% |
| Mexican | 146 | 3.8% |
| Norwegian | 41 | 1.1% |
| Pakistani | 4 | 0.1% |
| Polish | 200 | 5.1% |
| Puerto Rican | 8 | 0.2% |
| Russian | 45 | 1.2% |
| Scandinavian | 17 | 0.4% |
| Scotch-Irish | 261 | 6.7% |
| Scottish | 98 | 2.5% |
| Slovak | 29 | 0.7% |
| South American | 8 | 0.2% |
| Spaniard | 56 | 1.4% |
| Sri Lankan | 13 | 0.3% |
| Swiss | 21 | 0.5% |
| Turkish | 18 | 0.5% |
| Ukrainian | 25 | 0.6% |
| Venezuelan | 4 | 0.1% |
| Welsh | 61 | 1.6% |
| West Indian | 8 | 0.2% | View All 42 Rows |
Immigrants in Surf City
The most numerous immigrant groups reported in Surf City came from Latin America (49 | 1.3%), Central America (40 | 1.0%), Mexico (40 | 1.0%), Europe (35 | 0.9%), and Ireland (21 | 0.5%), together accounting for 4.8% of all Surf City residents.
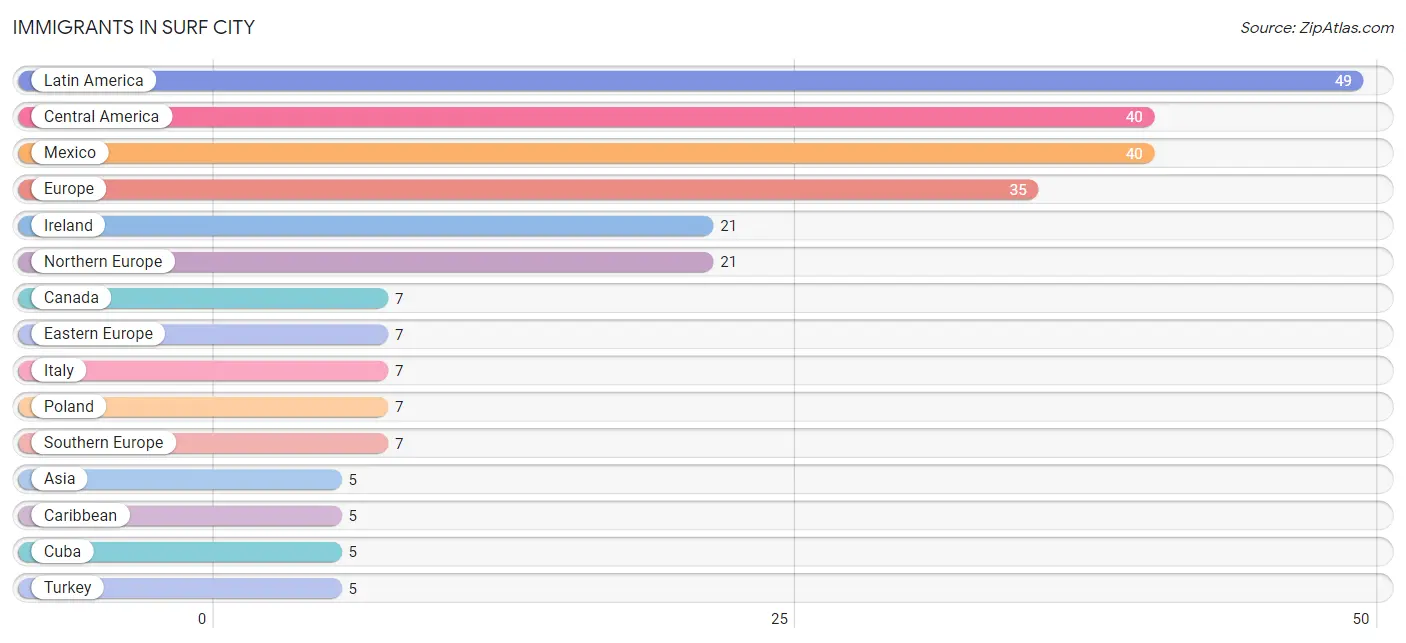
| Immigration Origin | # Population | % Population |
| Asia | 5 | 0.1% |
| Canada | 7 | 0.2% |
| Caribbean | 5 | 0.1% |
| Central America | 40 | 1.0% |
| Cuba | 5 | 0.1% |
| Eastern Europe | 7 | 0.2% |
| Europe | 35 | 0.9% |
| Ireland | 21 | 0.5% |
| Italy | 7 | 0.2% |
| Latin America | 49 | 1.3% |
| Mexico | 40 | 1.0% |
| Northern Europe | 21 | 0.5% |
| Poland | 7 | 0.2% |
| South America | 4 | 0.1% |
| Southern Europe | 7 | 0.2% |
| Turkey | 5 | 0.1% |
| Venezuela | 4 | 0.1% |
| Western Asia | 5 | 0.1% | View All 18 Rows |
Sex and Age in Surf City
Sex and Age in Surf City
The most populous age groups in Surf City are 60 to 64 Years (238 | 12.4%) for men and 10 to 14 Years (230 | 11.7%) for women.
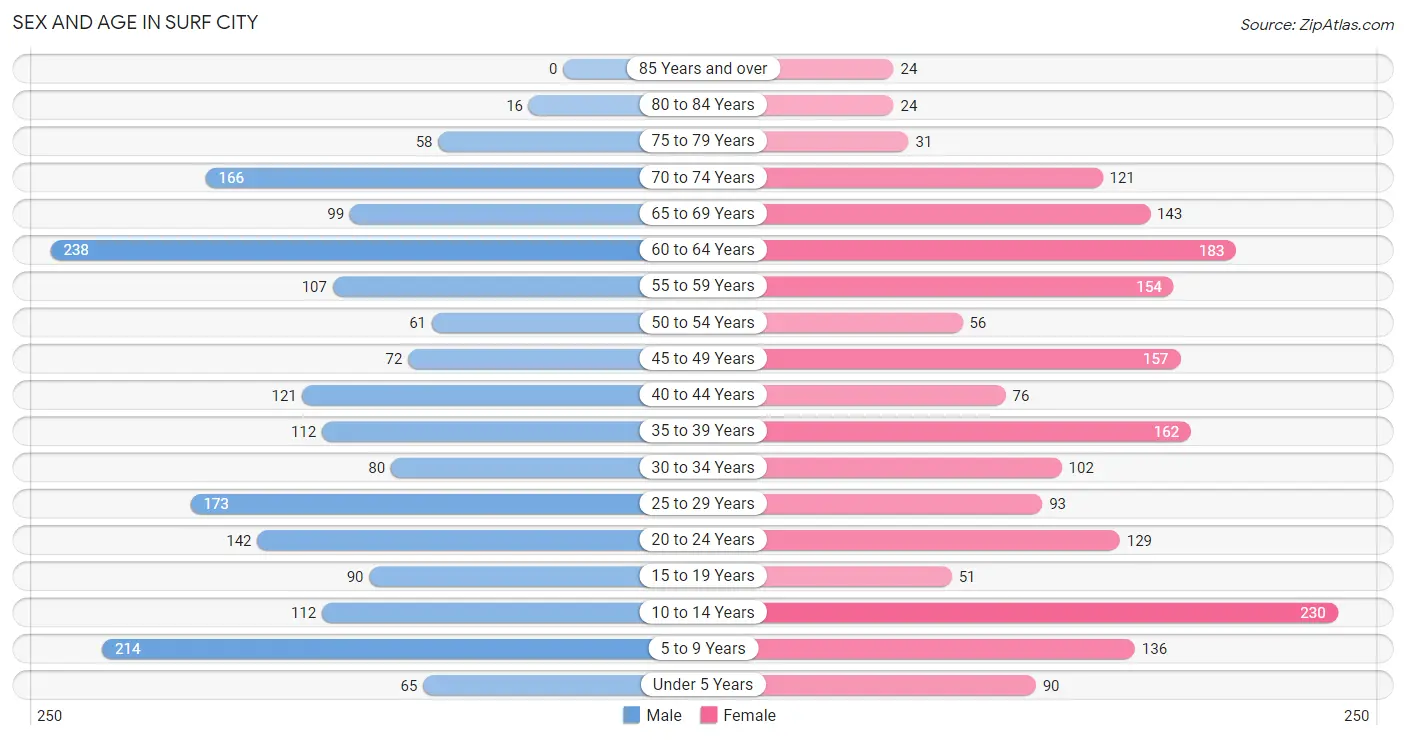
| Age Bracket | Male | Female |
| Under 5 Years | 65 (3.4%) | 90 (4.6%) |
| 5 to 9 Years | 214 (11.1%) | 136 (6.9%) |
| 10 to 14 Years | 112 (5.8%) | 230 (11.7%) |
| 15 to 19 Years | 90 (4.7%) | 51 (2.6%) |
| 20 to 24 Years | 142 (7.4%) | 129 (6.6%) |
| 25 to 29 Years | 173 (9.0%) | 93 (4.7%) |
| 30 to 34 Years | 80 (4.2%) | 102 (5.2%) |
| 35 to 39 Years | 112 (5.8%) | 162 (8.3%) |
| 40 to 44 Years | 121 (6.3%) | 76 (3.9%) |
| 45 to 49 Years | 72 (3.7%) | 157 (8.0%) |
| 50 to 54 Years | 61 (3.2%) | 56 (2.9%) |
| 55 to 59 Years | 107 (5.6%) | 154 (7.9%) |
| 60 to 64 Years | 238 (12.4%) | 183 (9.3%) |
| 65 to 69 Years | 99 (5.1%) | 143 (7.3%) |
| 70 to 74 Years | 166 (8.6%) | 121 (6.2%) |
| 75 to 79 Years | 58 (3.0%) | 31 (1.6%) |
| 80 to 84 Years | 16 (0.8%) | 24 (1.2%) |
| 85 Years and over | 0 (0.0%) | 24 (1.2%) |
| Total | 1,926 (100.0%) | 1,962 (100.0%) |
Families and Households in Surf City
Median Family Size in Surf City
The median family size in Surf City is 3.19 persons per family, with single female/mother families (122 | 12.0%) accounting for the largest median family size of 3.43 persons per family. On the other hand, married-couple families (876 | 86.3%) represent the smallest median family size with 3.16 persons per family.
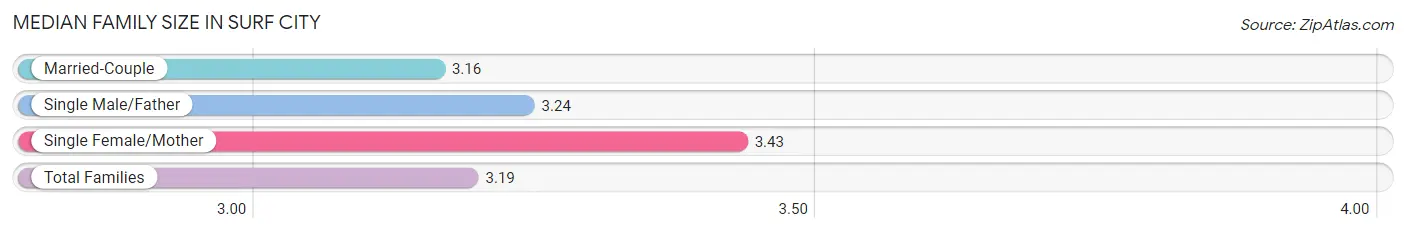
| Family Type | # Families | Family Size |
| Married-Couple | 876 (86.3%) | 3.16 |
| Single Male/Father | 17 (1.7%) | 3.24 |
| Single Female/Mother | 122 (12.0%) | 3.43 |
| Total Families | 1,015 (100.0%) | 3.19 |
Median Household Size in Surf City
The median household size in Surf City is 2.67 persons per household, with single male/father households (17 | 1.2%) accounting for the largest median household size of 3.59 persons per household. non-family households (441 | 30.3%) represent the smallest median household size with 1.24 persons per household.
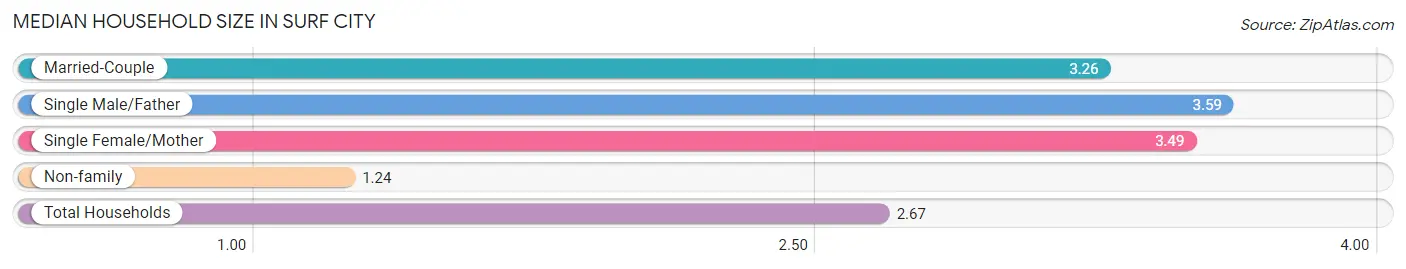
| Household Type | # Households | Household Size |
| Married-Couple | 876 (60.2%) | 3.26 |
| Single Male/Father | 17 (1.2%) | 3.59 |
| Single Female/Mother | 122 (8.4%) | 3.49 |
| Non-family | 441 (30.3%) | 1.24 |
| Total Households | 1,456 (100.0%) | 2.67 |
Household Size by Marriage Status in Surf City
Out of a total of 1,456 households in Surf City, 1,015 (69.7%) are family households, while 441 (30.3%) are nonfamily households. The most numerous type of family households are 2-person households, comprising 553, and the most common type of nonfamily households are 1-person households, comprising 410.
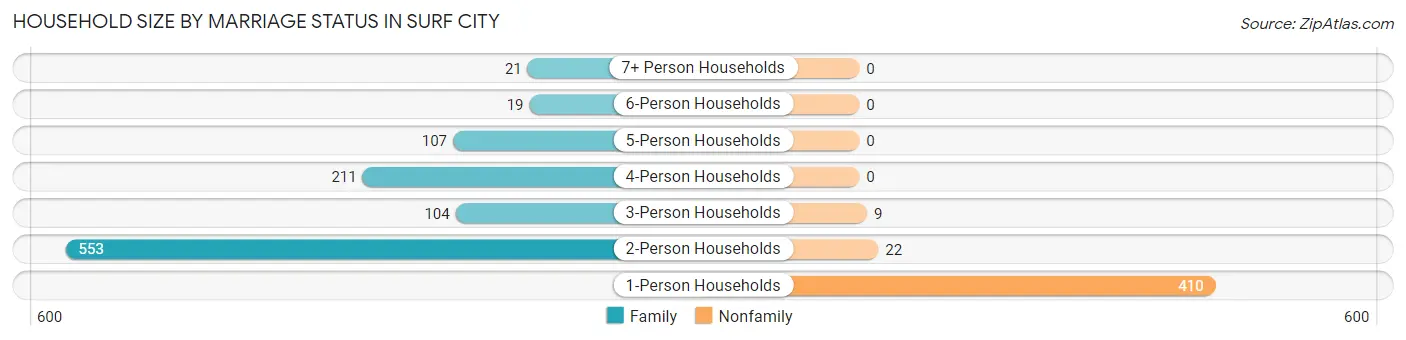
| Household Size | Family Households | Nonfamily Households |
| 1-Person Households | - | 410 (28.2%) |
| 2-Person Households | 553 (38.0%) | 22 (1.5%) |
| 3-Person Households | 104 (7.1%) | 9 (0.6%) |
| 4-Person Households | 211 (14.5%) | 0 (0.0%) |
| 5-Person Households | 107 (7.3%) | 0 (0.0%) |
| 6-Person Households | 19 (1.3%) | 0 (0.0%) |
| 7+ Person Households | 21 (1.4%) | 0 (0.0%) |
| Total | 1,015 (69.7%) | 441 (30.3%) |
Female Fertility in Surf City
Fertility by Age in Surf City
Average fertility rate in Surf City is 43.0 births per 1,000 women. Women in the age bracket of 20 to 34 years have the highest fertility rate with 49.0 births per 1,000 women. Women in the age bracket of 35 to 50 years acount for 51.5% of all women with births.
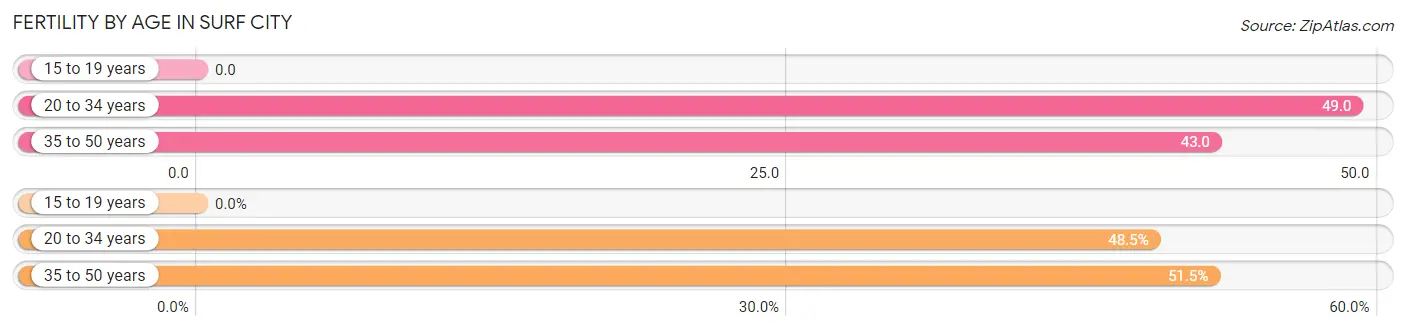
| Age Bracket | Women with Births | Births / 1,000 Women |
| 15 to 19 years | 0 (0.0%) | 0.0 |
| 20 to 34 years | 16 (48.5%) | 49.0 |
| 35 to 50 years | 17 (51.5%) | 43.0 |
| Total | 33 (100.0%) | 43.0 |
Fertility by Age by Marriage Status in Surf City
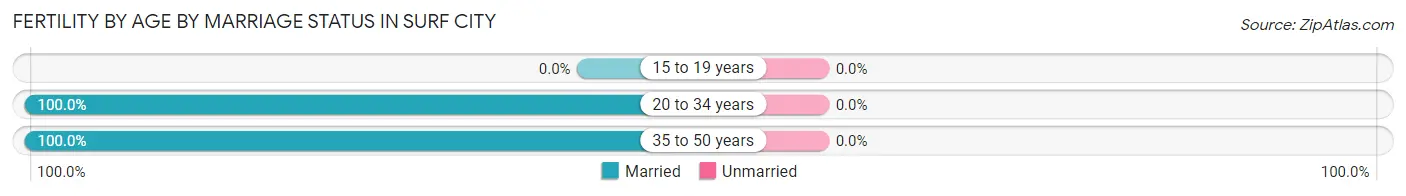
| Age Bracket | Married | Unmarried |
| 15 to 19 years | 0 (0.0%) | 0 (0.0%) |
| 20 to 34 years | 16 (100.0%) | 0 (0.0%) |
| 35 to 50 years | 17 (100.0%) | 0 (0.0%) |
| Total | 33 (100.0%) | 0 (0.0%) |
Fertility by Education in Surf City
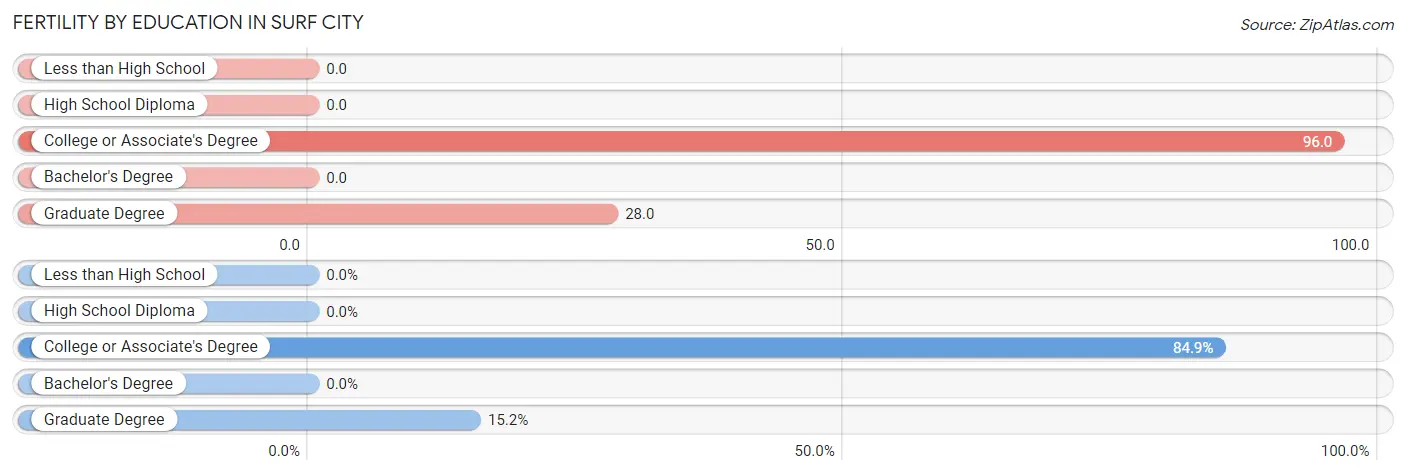
| Educational Attainment | Women with Births | Births / 1,000 Women |
| Less than High School | 0 (0.0%) | 0.0 |
| High School Diploma | 0 (0.0%) | 0.0 |
| College or Associate's Degree | 28 (84.9%) | 96.0 |
| Bachelor's Degree | 0 (0.0%) | 0.0 |
| Graduate Degree | 5 (15.1%) | 28.0 |
| Total | 33 (100.0%) | 43.0 |
Fertility by Education by Marriage Status in Surf City
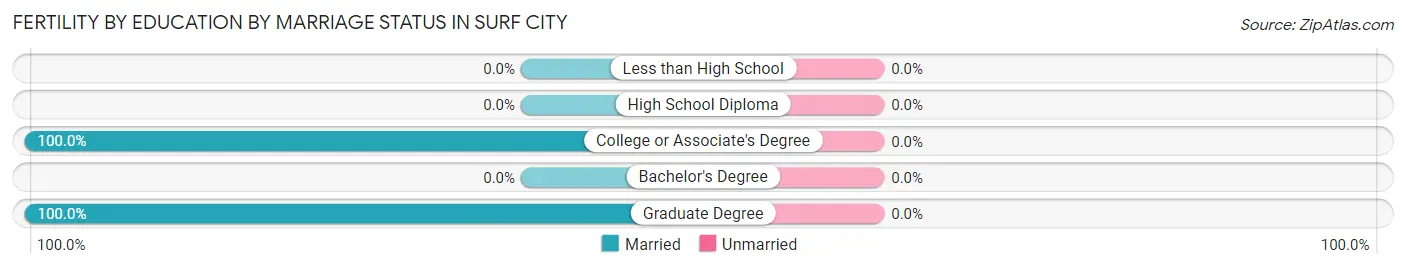
| Educational Attainment | Married | Unmarried |
| Less than High School | 0 (0.0%) | 0 (0.0%) |
| High School Diploma | 0 (0.0%) | 0 (0.0%) |
| College or Associate's Degree | 28 (100.0%) | 0 (0.0%) |
| Bachelor's Degree | 0 (0.0%) | 0 (0.0%) |
| Graduate Degree | 5 (100.0%) | 0 (0.0%) |
| Total | 33 (100.0%) | 0 (0.0%) |
Employment Characteristics in Surf City
Employment by Class of Employer in Surf City
Among the 1,759 employed individuals in Surf City, private company employees (909 | 51.7%), not-for-profit organizations (246 | 14.0%), and local government employees (160 | 9.1%) make up the most common classes of employment.
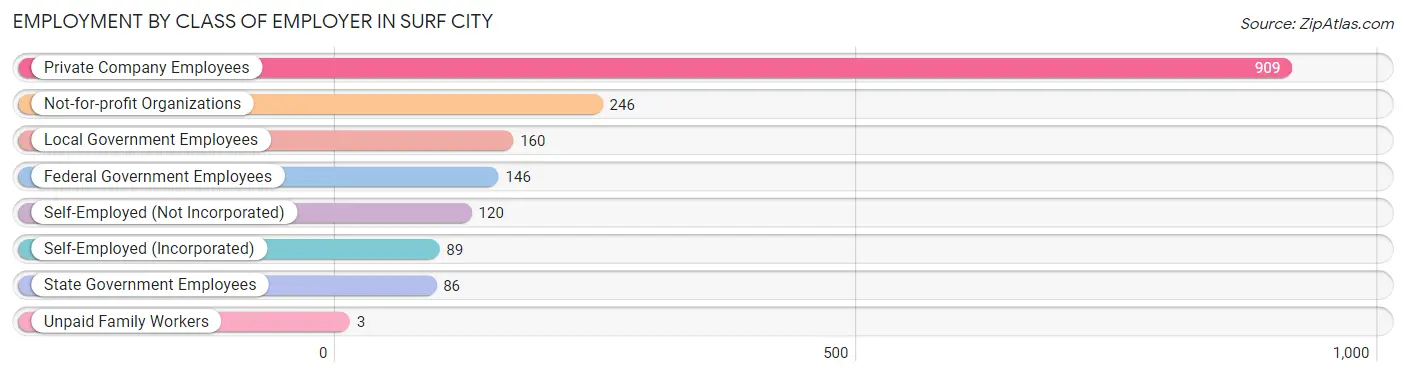
| Employer Class | # Employees | % Employees |
| Private Company Employees | 909 | 51.7% |
| Self-Employed (Incorporated) | 89 | 5.1% |
| Self-Employed (Not Incorporated) | 120 | 6.8% |
| Not-for-profit Organizations | 246 | 14.0% |
| Local Government Employees | 160 | 9.1% |
| State Government Employees | 86 | 4.9% |
| Federal Government Employees | 146 | 8.3% |
| Unpaid Family Workers | 3 | 0.2% |
| Total | 1,759 | 100.0% |
Employment Status by Age in Surf City
According to the labor force statistics for Surf City, out of the total population over 16 years of age (3,017), 61.7% or 1,861 individuals are in the labor force, with 3.0% or 56 of them unemployed. The age group with the highest labor force participation rate is 25 to 29 years, with 96.6% or 257 individuals in the labor force. Within the labor force, the 45 to 54 years age range has the highest percentage of unemployed individuals, with 9.2% or 24 of them being unemployed.
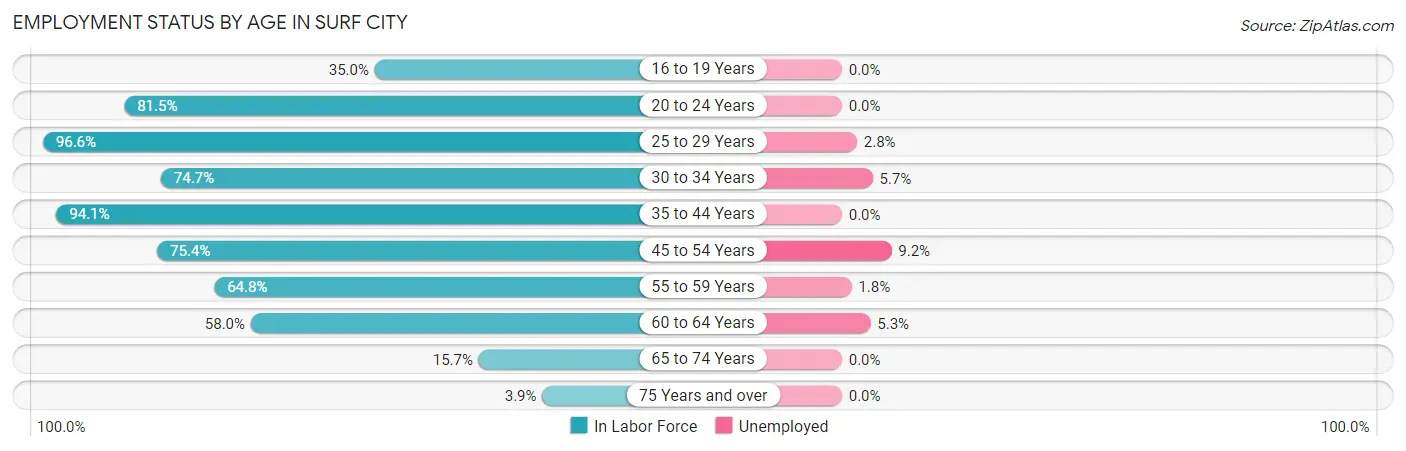
| Age Bracket | In Labor Force | Unemployed |
| 16 to 19 Years | 41 (35.0%) | 0 (0.0%) |
| 20 to 24 Years | 221 (81.5%) | 0 (0.0%) |
| 25 to 29 Years | 257 (96.6%) | 7 (2.8%) |
| 30 to 34 Years | 136 (74.7%) | 8 (5.7%) |
| 35 to 44 Years | 443 (94.1%) | 0 (0.0%) |
| 45 to 54 Years | 261 (75.4%) | 24 (9.2%) |
| 55 to 59 Years | 169 (64.8%) | 3 (1.8%) |
| 60 to 64 Years | 244 (58.0%) | 13 (5.3%) |
| 65 to 74 Years | 83 (15.7%) | 0 (0.0%) |
| 75 Years and over | 6 (3.9%) | 0 (0.0%) |
| Total | 1,861 (61.7%) | 56 (3.0%) |
Employment Status by Educational Attainment in Surf City
According to labor force statistics for Surf City, 77.6% of individuals (1,511) out of the total population between 25 and 64 years of age (1,947) are in the labor force, with 3.7% or 56 of them being unemployed. The group with the highest labor force participation rate are those with the educational attainment of high school diploma, with 83.1% or 299 individuals in the labor force. Within the labor force, individuals with college / associate degree education have the highest percentage of unemployment, with 6.5% or 27 of them being unemployed.
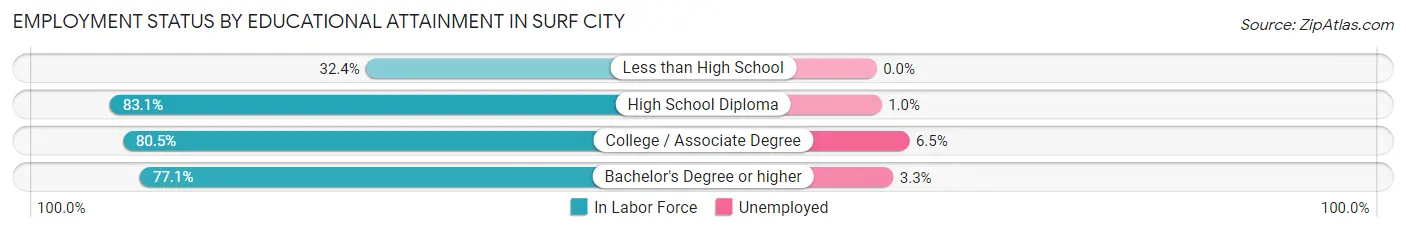
| Educational Attainment | In Labor Force | Unemployed |
| Less than High School | 22 (32.4%) | 0 (0.0%) |
| High School Diploma | 299 (83.1%) | 4 (1.0%) |
| College / Associate Degree | 418 (80.5%) | 34 (6.5%) |
| Bachelor's Degree or higher | 771 (77.1%) | 33 (3.3%) |
| Total | 1,511 (77.6%) | 72 (3.7%) |
Employment Occupations by Sex in Surf City
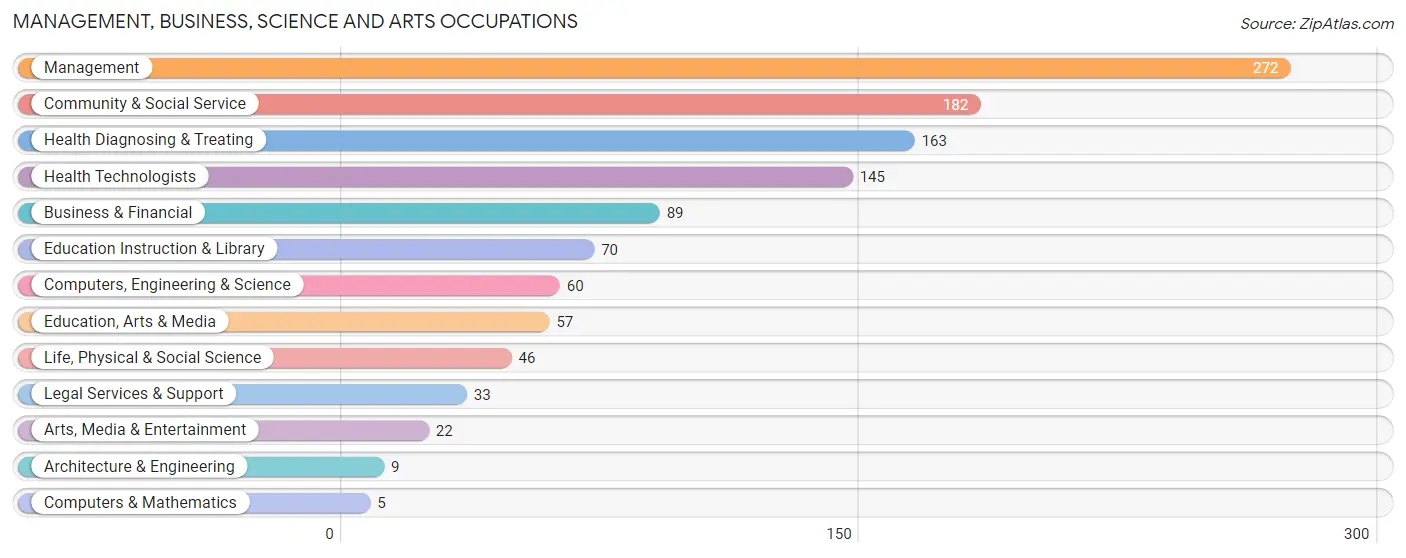
Management, Business, Science and Arts Occupations
The most common Management, Business, Science and Arts occupations in Surf City are Management (272 | 16.1%), Community & Social Service (182 | 10.7%), Health Diagnosing & Treating (163 | 9.6%), Health Technologists (145 | 8.6%), and Business & Financial (89 | 5.3%).
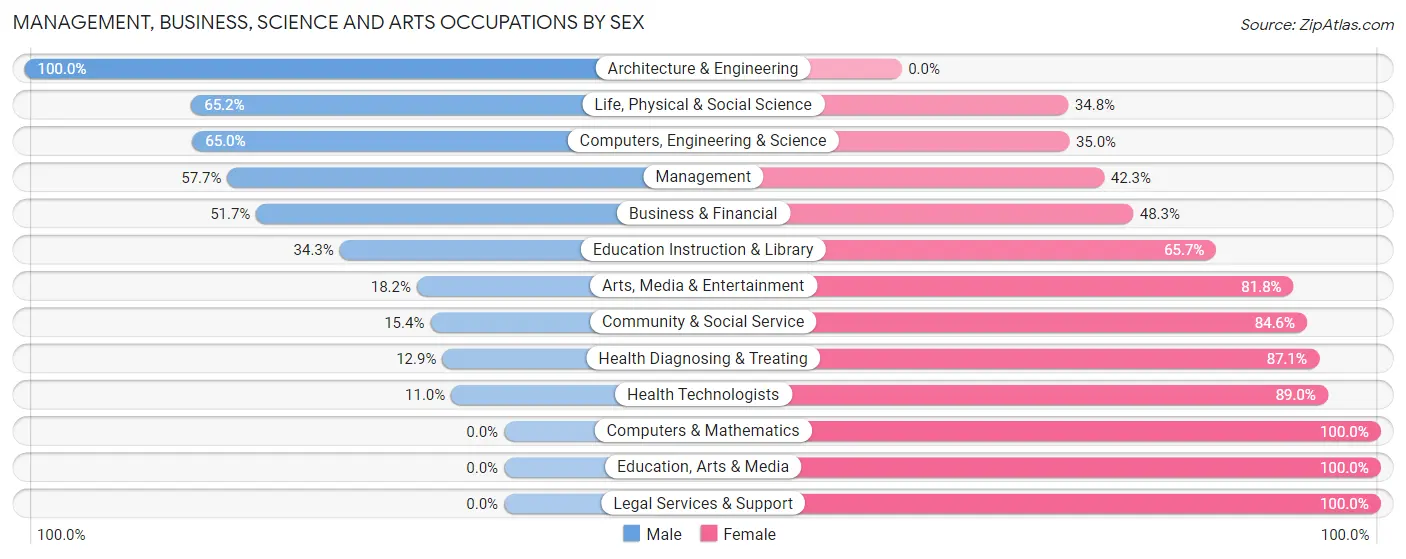
Management, Business, Science and Arts Occupations by Sex
Within the Management, Business, Science and Arts occupations in Surf City, the most male-oriented occupations are Architecture & Engineering (100.0%), Life, Physical & Social Science (65.2%), and Computers, Engineering & Science (65.0%), while the most female-oriented occupations are Computers & Mathematics (100.0%), Education, Arts & Media (100.0%), and Legal Services & Support (100.0%).
| Occupation | Male | Female |
| Management | 157 (57.7%) | 115 (42.3%) |
| Business & Financial | 46 (51.7%) | 43 (48.3%) |
| Computers, Engineering & Science | 39 (65.0%) | 21 (35.0%) |
| Computers & Mathematics | 0 (0.0%) | 5 (100.0%) |
| Architecture & Engineering | 9 (100.0%) | 0 (0.0%) |
| Life, Physical & Social Science | 30 (65.2%) | 16 (34.8%) |
| Community & Social Service | 28 (15.4%) | 154 (84.6%) |
| Education, Arts & Media | 0 (0.0%) | 57 (100.0%) |
| Legal Services & Support | 0 (0.0%) | 33 (100.0%) |
| Education Instruction & Library | 24 (34.3%) | 46 (65.7%) |
| Arts, Media & Entertainment | 4 (18.2%) | 18 (81.8%) |
| Health Diagnosing & Treating | 21 (12.9%) | 142 (87.1%) |
| Health Technologists | 16 (11.0%) | 129 (89.0%) |
| Total (Category) | 291 (38.0%) | 475 (62.0%) |
| Total (Overall) | 897 (53.0%) | 796 (47.0%) |
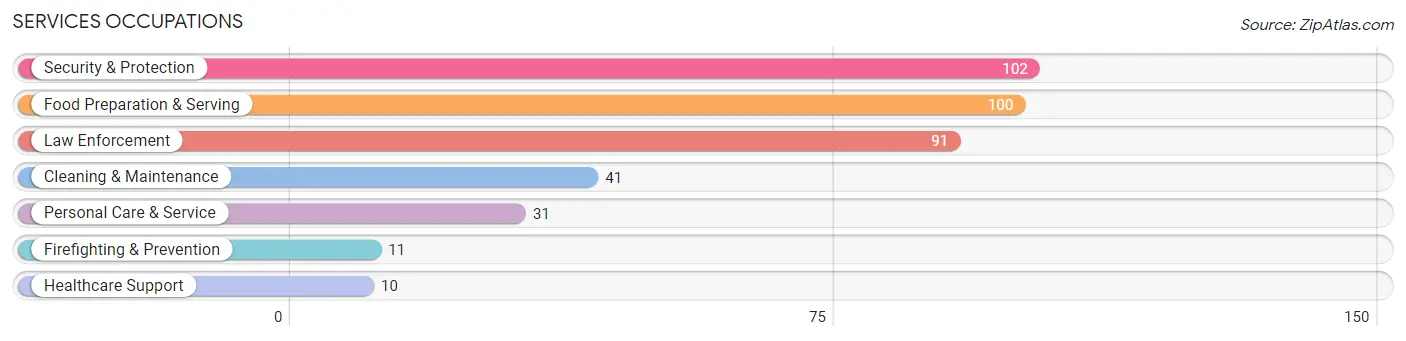
Services Occupations
The most common Services occupations in Surf City are Security & Protection (102 | 6.0%), Food Preparation & Serving (100 | 5.9%), Law Enforcement (91 | 5.4%), Cleaning & Maintenance (41 | 2.4%), and Personal Care & Service (31 | 1.8%).
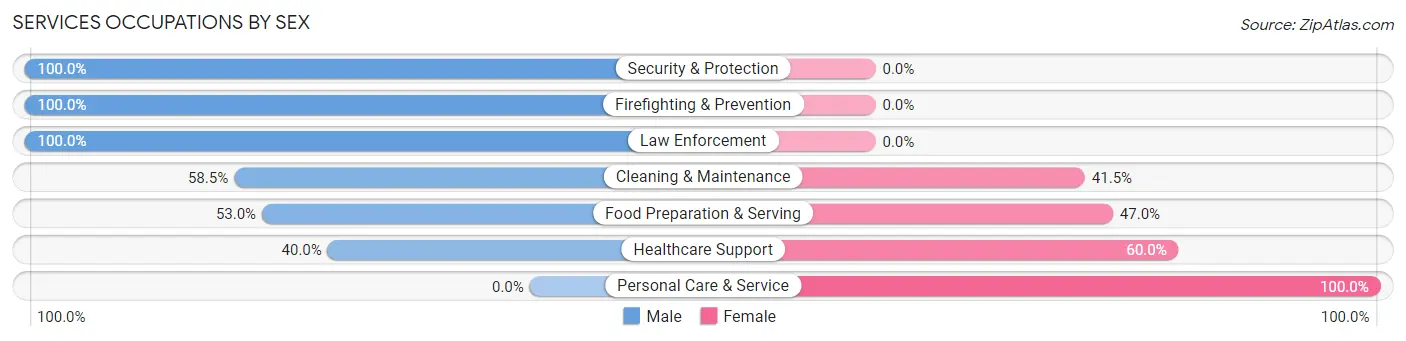
Services Occupations by Sex
Within the Services occupations in Surf City, the most male-oriented occupations are Security & Protection (100.0%), Firefighting & Prevention (100.0%), and Law Enforcement (100.0%), while the most female-oriented occupations are Personal Care & Service (100.0%), Healthcare Support (60.0%), and Food Preparation & Serving (47.0%).
| Occupation | Male | Female |
| Healthcare Support | 4 (40.0%) | 6 (60.0%) |
| Security & Protection | 102 (100.0%) | 0 (0.0%) |
| Firefighting & Prevention | 11 (100.0%) | 0 (0.0%) |
| Law Enforcement | 91 (100.0%) | 0 (0.0%) |
| Food Preparation & Serving | 53 (53.0%) | 47 (47.0%) |
| Cleaning & Maintenance | 24 (58.5%) | 17 (41.5%) |
| Personal Care & Service | 0 (0.0%) | 31 (100.0%) |
| Total (Category) | 183 (64.4%) | 101 (35.6%) |
| Total (Overall) | 897 (53.0%) | 796 (47.0%) |
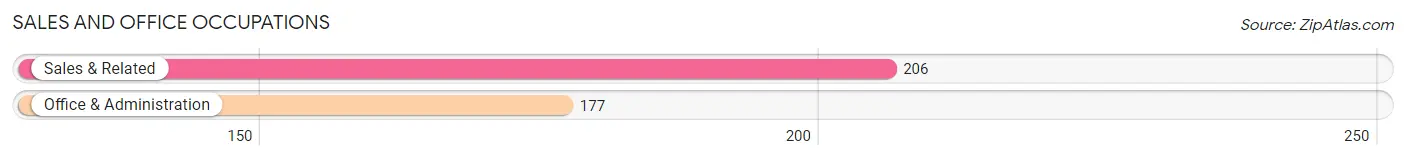
Sales and Office Occupations
The most common Sales and Office occupations in Surf City are Sales & Related (206 | 12.2%), and Office & Administration (177 | 10.4%).
Sales and Office Occupations by Sex
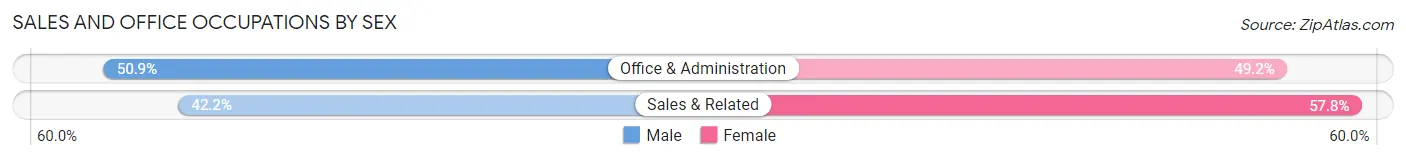
| Occupation | Male | Female |
| Sales & Related | 87 (42.2%) | 119 (57.8%) |
| Office & Administration | 90 (50.8%) | 87 (49.1%) |
| Total (Category) | 177 (46.2%) | 206 (53.8%) |
| Total (Overall) | 897 (53.0%) | 796 (47.0%) |
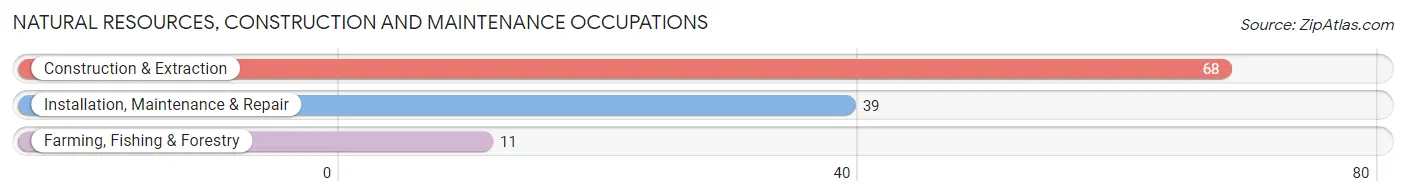
Natural Resources, Construction and Maintenance Occupations
The most common Natural Resources, Construction and Maintenance occupations in Surf City are Construction & Extraction (68 | 4.0%), Installation, Maintenance & Repair (39 | 2.3%), and Farming, Fishing & Forestry (11 | 0.6%).
Natural Resources, Construction and Maintenance Occupations by Sex
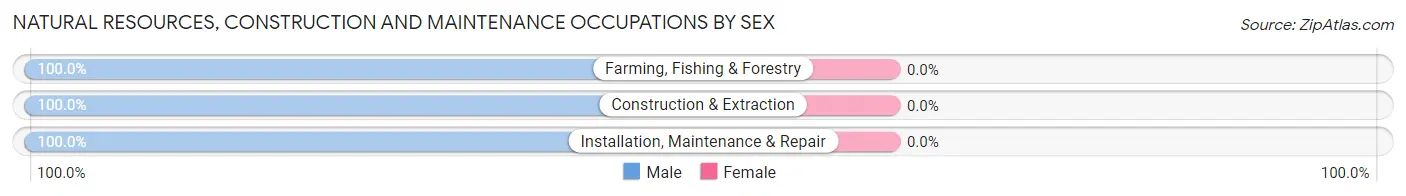
| Occupation | Male | Female |
| Farming, Fishing & Forestry | 11 (100.0%) | 0 (0.0%) |
| Construction & Extraction | 68 (100.0%) | 0 (0.0%) |
| Installation, Maintenance & Repair | 39 (100.0%) | 0 (0.0%) |
| Total (Category) | 118 (100.0%) | 0 (0.0%) |
| Total (Overall) | 897 (53.0%) | 796 (47.0%) |
Production, Transportation and Moving Occupations
The most common Production, Transportation and Moving occupations in Surf City are Material Moving (64 | 3.8%), Production (60 | 3.5%), and Transportation (18 | 1.1%).
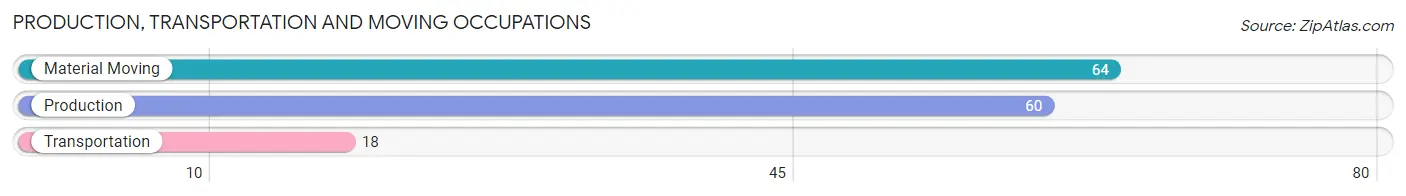
Production, Transportation and Moving Occupations by Sex
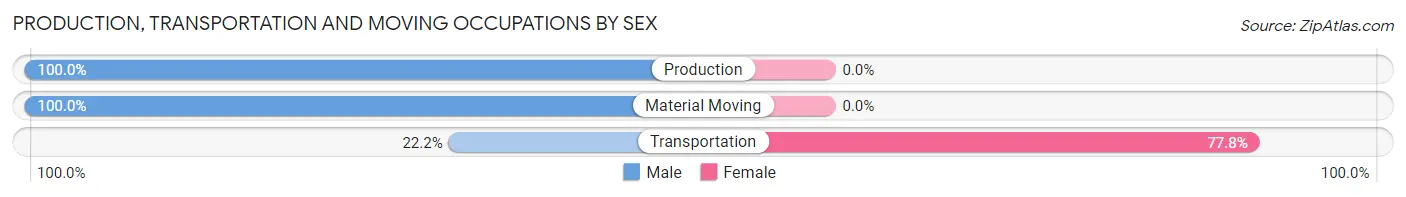
| Occupation | Male | Female |
| Production | 60 (100.0%) | 0 (0.0%) |
| Transportation | 4 (22.2%) | 14 (77.8%) |
| Material Moving | 64 (100.0%) | 0 (0.0%) |
| Total (Category) | 128 (90.1%) | 14 (9.9%) |
| Total (Overall) | 897 (53.0%) | 796 (47.0%) |
Employment Industries by Sex in Surf City
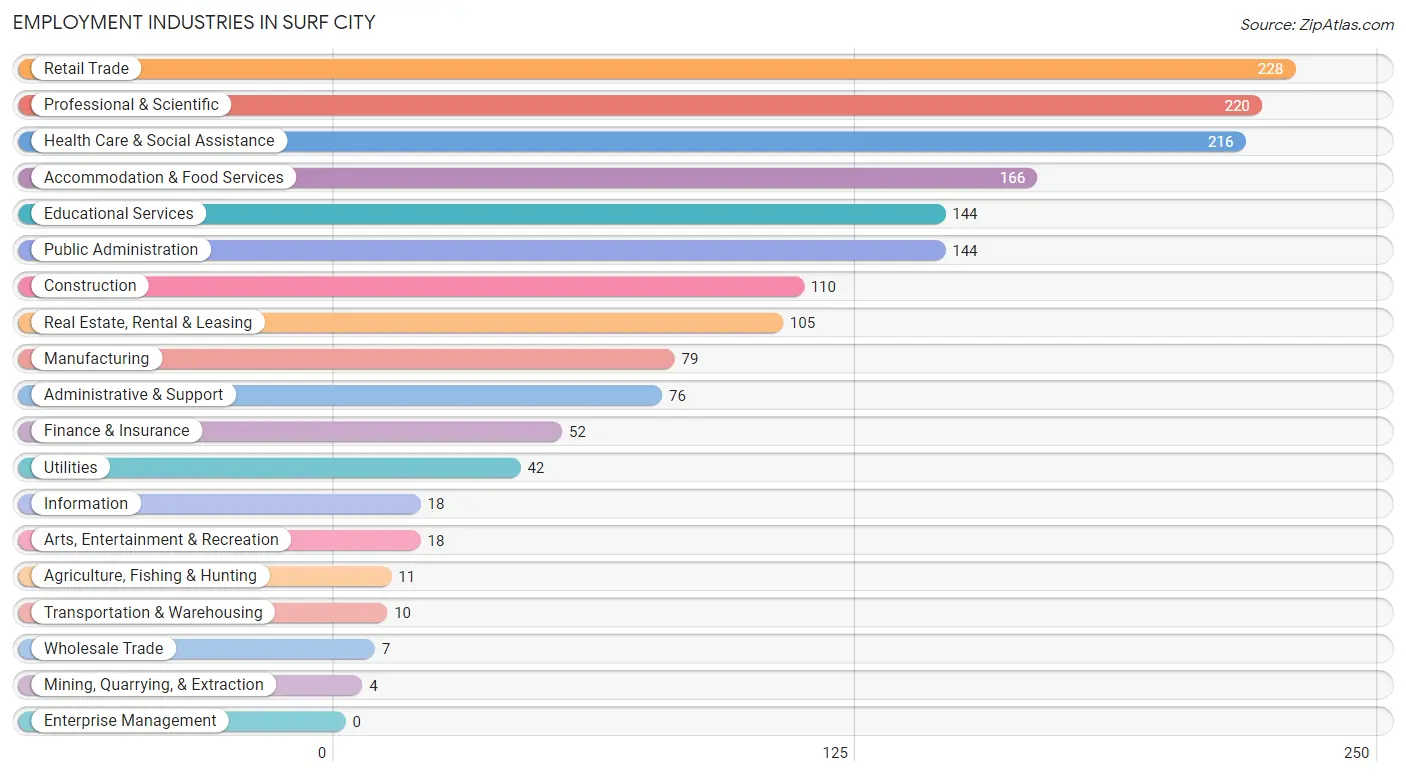
Employment Industries in Surf City
The major employment industries in Surf City include Retail Trade (228 | 13.5%), Professional & Scientific (220 | 13.0%), Health Care & Social Assistance (216 | 12.8%), Accommodation & Food Services (166 | 9.8%), and Educational Services (144 | 8.5%).
Employment Industries by Sex in Surf City
The Surf City industries that see more men than women are Agriculture, Fishing & Hunting (100.0%), Construction (100.0%), and Wholesale Trade (100.0%), whereas the industries that tend to have a higher number of women are Mining, Quarrying, & Extraction (100.0%), Arts, Entertainment & Recreation (100.0%), and Health Care & Social Assistance (83.3%).
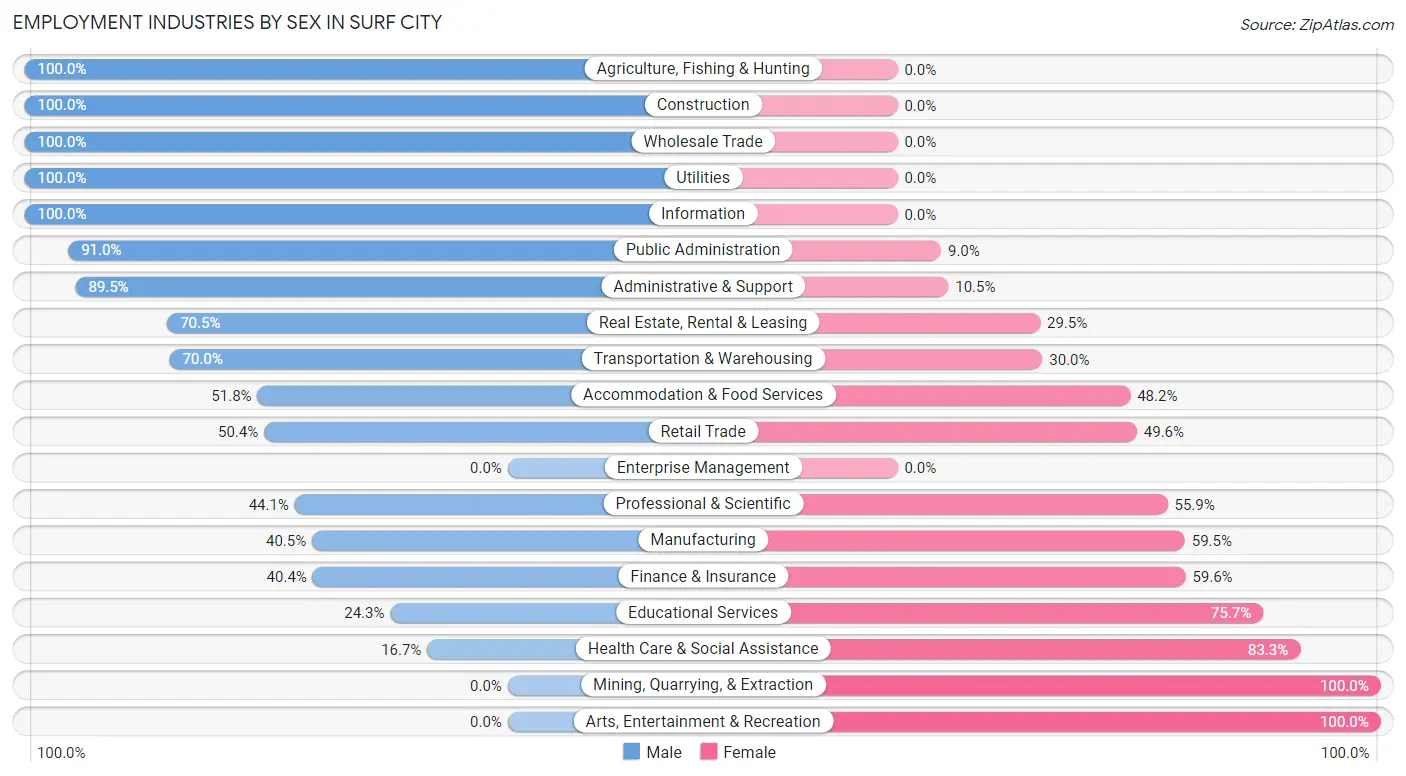
| Industry | Male | Female |
| Agriculture, Fishing & Hunting | 11 (100.0%) | 0 (0.0%) |
| Mining, Quarrying, & Extraction | 0 (0.0%) | 4 (100.0%) |
| Construction | 110 (100.0%) | 0 (0.0%) |
| Manufacturing | 32 (40.5%) | 47 (59.5%) |
| Wholesale Trade | 7 (100.0%) | 0 (0.0%) |
| Retail Trade | 115 (50.4%) | 113 (49.6%) |
| Transportation & Warehousing | 7 (70.0%) | 3 (30.0%) |
| Utilities | 42 (100.0%) | 0 (0.0%) |
| Information | 18 (100.0%) | 0 (0.0%) |
| Finance & Insurance | 21 (40.4%) | 31 (59.6%) |
| Real Estate, Rental & Leasing | 74 (70.5%) | 31 (29.5%) |
| Professional & Scientific | 97 (44.1%) | 123 (55.9%) |
| Enterprise Management | 0 (0.0%) | 0 (0.0%) |
| Administrative & Support | 68 (89.5%) | 8 (10.5%) |
| Educational Services | 35 (24.3%) | 109 (75.7%) |
| Health Care & Social Assistance | 36 (16.7%) | 180 (83.3%) |
| Arts, Entertainment & Recreation | 0 (0.0%) | 18 (100.0%) |
| Accommodation & Food Services | 86 (51.8%) | 80 (48.2%) |
| Public Administration | 131 (91.0%) | 13 (9.0%) |
| Total | 897 (53.0%) | 796 (47.0%) |
Education in Surf City
School Enrollment in Surf City
The most common levels of schooling among the 975 students in Surf City are elementary school (306 | 31.4%), middle school (294 | 30.1%), and college / undergraduate (126 | 12.9%).
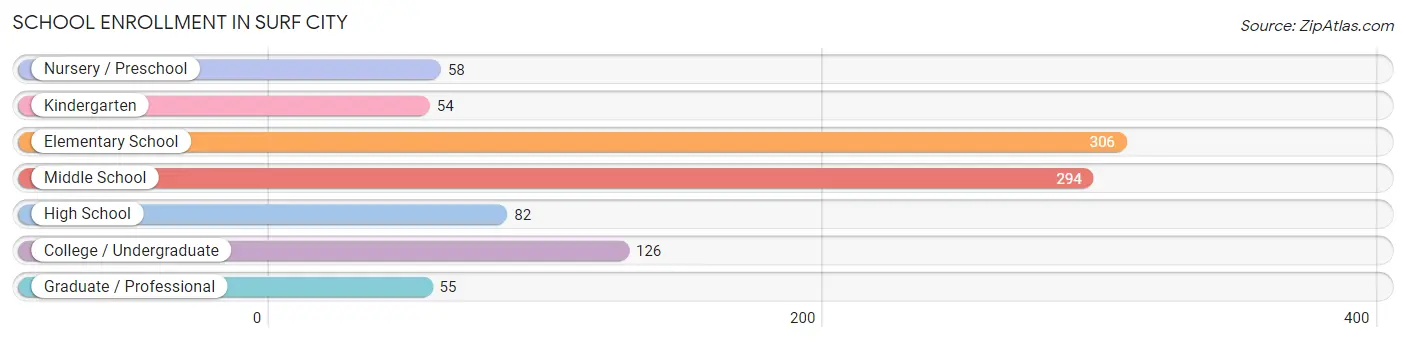
| School Level | # Students | % Students |
| Nursery / Preschool | 58 | 5.9% |
| Kindergarten | 54 | 5.5% |
| Elementary School | 306 | 31.4% |
| Middle School | 294 | 30.1% |
| High School | 82 | 8.4% |
| College / Undergraduate | 126 | 12.9% |
| Graduate / Professional | 55 | 5.6% |
| Total | 975 | 100.0% |
School Enrollment by Age by Funding Source in Surf City
Out of a total of 975 students who are enrolled in schools in Surf City, 182 (18.7%) attend a private institution, while the remaining 793 (81.3%) are enrolled in public schools. The age group of 3 to 4 year olds has the highest likelihood of being enrolled in private schools, with 26 (53.1% in the age bracket) enrolled. Conversely, the age group of 18 to 19 year olds has the lowest likelihood of being enrolled in a private school, with 24 (100.0% in the age bracket) attending a public institution.
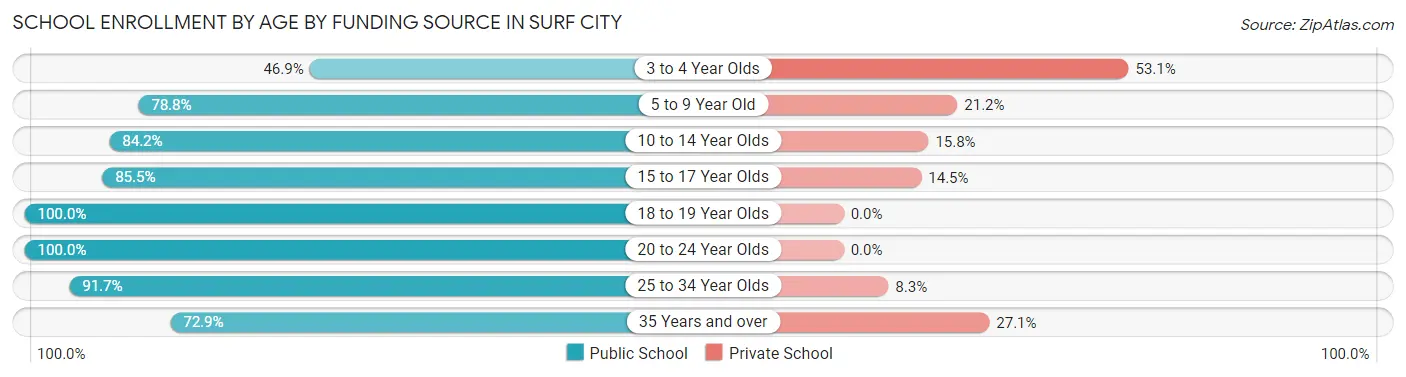
| Age Bracket | Public School | Private School |
| 3 to 4 Year Olds | 23 (46.9%) | 26 (53.1%) |
| 5 to 9 Year Old | 253 (78.8%) | 68 (21.2%) |
| 10 to 14 Year Olds | 288 (84.2%) | 54 (15.8%) |
| 15 to 17 Year Olds | 65 (85.5%) | 11 (14.5%) |
| 18 to 19 Year Olds | 24 (100.0%) | 0 (0.0%) |
| 20 to 24 Year Olds | 45 (100.0%) | 0 (0.0%) |
| 25 to 34 Year Olds | 44 (91.7%) | 4 (8.3%) |
| 35 Years and over | 51 (72.9%) | 19 (27.1%) |
| Total | 793 (81.3%) | 182 (18.7%) |
Educational Attainment by Field of Study in Surf City
Business (377 | 27.0%), arts & humanities (157 | 11.2%), social sciences (135 | 9.7%), education (123 | 8.8%), and computers & mathematics (120 | 8.6%) are the most common fields of study among 1,399 individuals in Surf City who have obtained a bachelor's degree or higher.
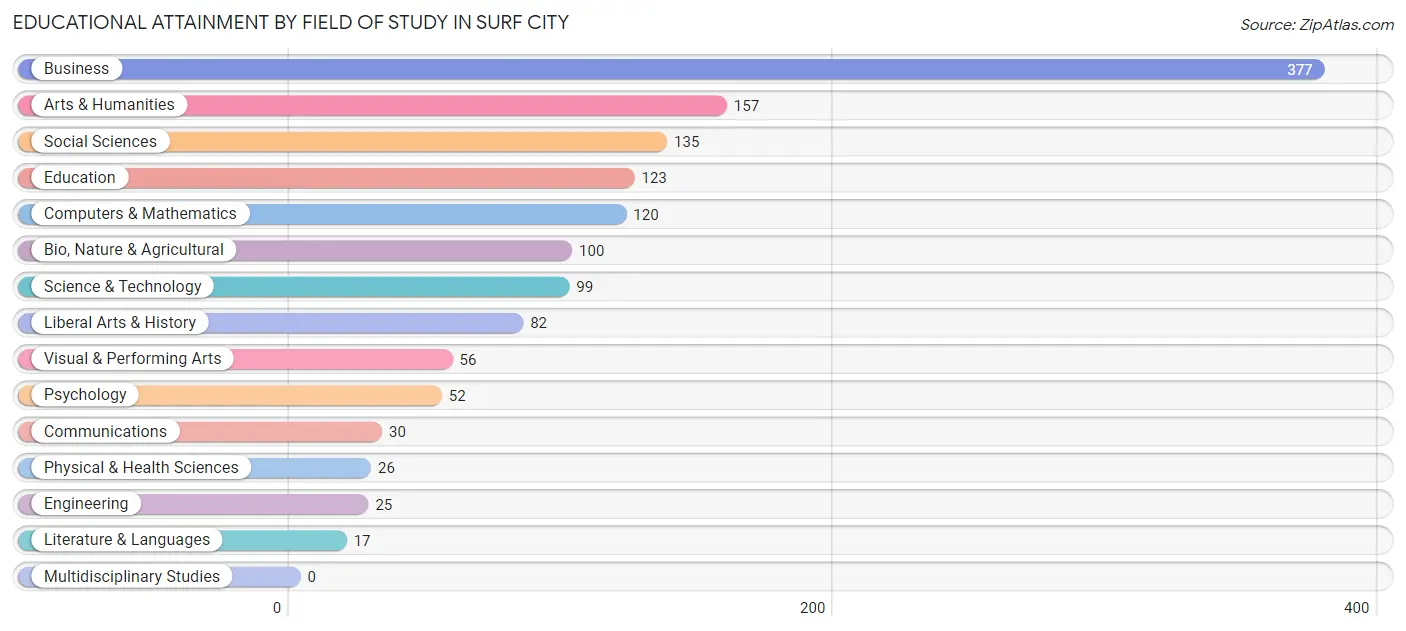
| Field of Study | # Graduates | % Graduates |
| Computers & Mathematics | 120 | 8.6% |
| Bio, Nature & Agricultural | 100 | 7.1% |
| Physical & Health Sciences | 26 | 1.9% |
| Psychology | 52 | 3.7% |
| Social Sciences | 135 | 9.7% |
| Engineering | 25 | 1.8% |
| Multidisciplinary Studies | 0 | 0.0% |
| Science & Technology | 99 | 7.1% |
| Business | 377 | 27.0% |
| Education | 123 | 8.8% |
| Literature & Languages | 17 | 1.2% |
| Liberal Arts & History | 82 | 5.9% |
| Visual & Performing Arts | 56 | 4.0% |
| Communications | 30 | 2.1% |
| Arts & Humanities | 157 | 11.2% |
| Total | 1,399 | 100.0% |
Transportation & Commute in Surf City
Vehicle Availability by Sex in Surf City
The most prevalent vehicle ownership categories in Surf City are males with 2 vehicles (497, accounting for 50.7%) and females with 2 vehicles (287, making up 63.9%).
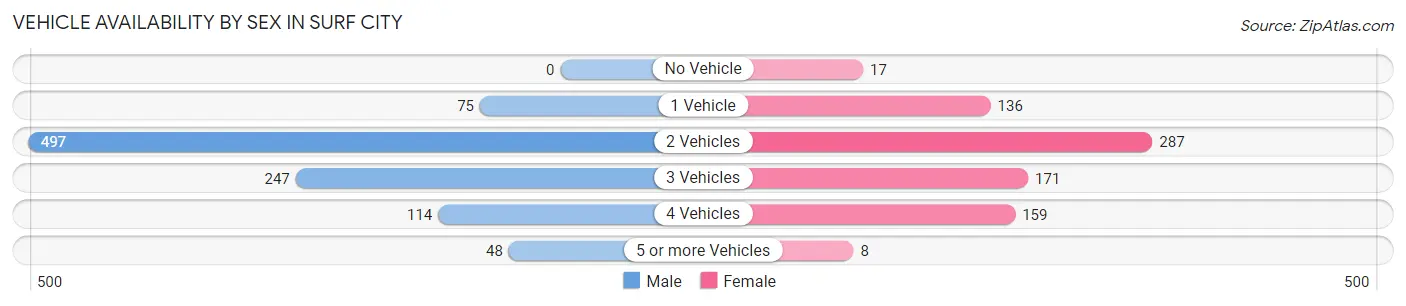
| Vehicles Available | Male | Female |
| No Vehicle | 0 (0.0%) | 17 (2.2%) |
| 1 Vehicle | 75 (7.6%) | 136 (17.5%) |
| 2 Vehicles | 497 (50.7%) | 287 (36.9%) |
| 3 Vehicles | 247 (25.2%) | 171 (22.0%) |
| 4 Vehicles | 114 (11.6%) | 159 (20.4%) |
| 5 or more Vehicles | 48 (4.9%) | 8 (1.0%) |
| Total | 981 (100.0%) | 778 (100.0%) |
Commute Time in Surf City
The most frequently occuring commute durations in Surf City are 45 to 59 minutes (275 commuters, 19.6%), 5 to 9 minutes (265 commuters, 18.9%), and 10 to 14 minutes (181 commuters, 12.9%).
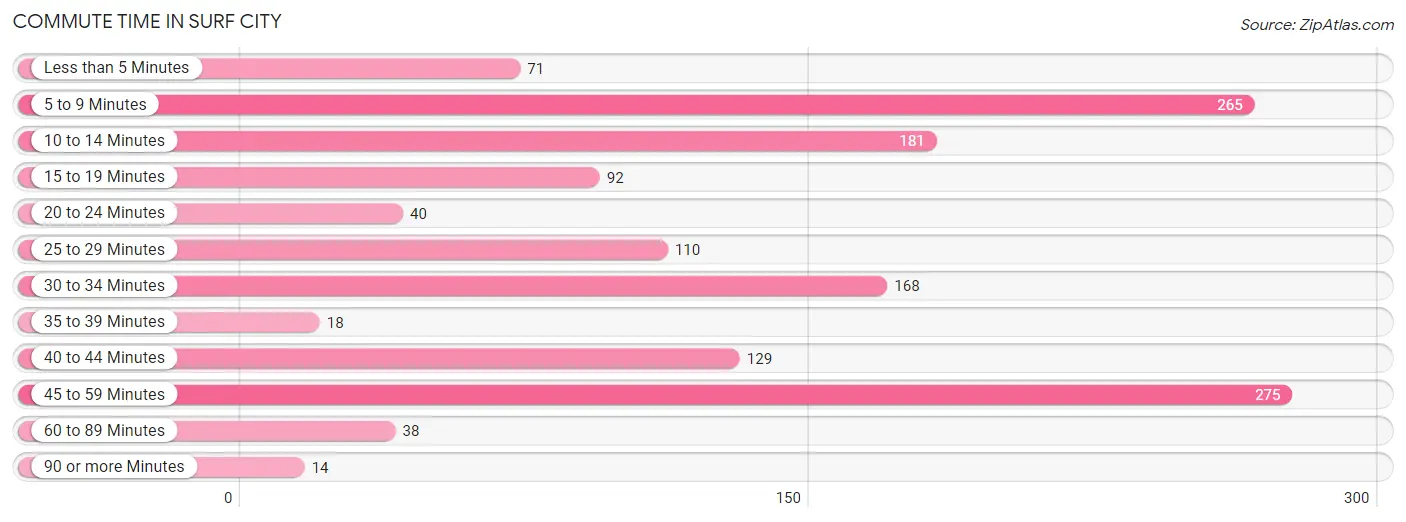
| Commute Time | # Commuters | % Commuters |
| Less than 5 Minutes | 71 | 5.1% |
| 5 to 9 Minutes | 265 | 18.9% |
| 10 to 14 Minutes | 181 | 12.9% |
| 15 to 19 Minutes | 92 | 6.6% |
| 20 to 24 Minutes | 40 | 2.9% |
| 25 to 29 Minutes | 110 | 7.9% |
| 30 to 34 Minutes | 168 | 12.0% |
| 35 to 39 Minutes | 18 | 1.3% |
| 40 to 44 Minutes | 129 | 9.2% |
| 45 to 59 Minutes | 275 | 19.6% |
| 60 to 89 Minutes | 38 | 2.7% |
| 90 or more Minutes | 14 | 1.0% |
Commute Time by Sex in Surf City
The most common commute times in Surf City are 45 to 59 minutes (208 commuters, 24.8%) for males and 5 to 9 minutes (127 commuters, 22.6%) for females.
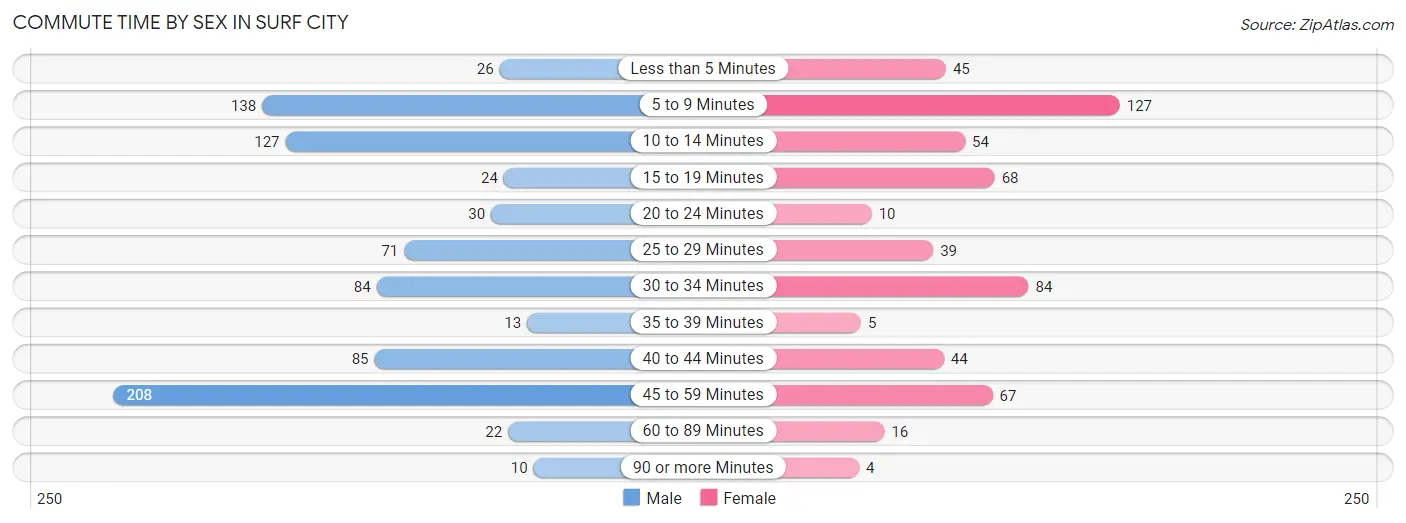
| Commute Time | Male | Female |
| Less than 5 Minutes | 26 (3.1%) | 45 (8.0%) |
| 5 to 9 Minutes | 138 (16.5%) | 127 (22.6%) |
| 10 to 14 Minutes | 127 (15.2%) | 54 (9.6%) |
| 15 to 19 Minutes | 24 (2.9%) | 68 (12.1%) |
| 20 to 24 Minutes | 30 (3.6%) | 10 (1.8%) |
| 25 to 29 Minutes | 71 (8.5%) | 39 (6.9%) |
| 30 to 34 Minutes | 84 (10.0%) | 84 (14.9%) |
| 35 to 39 Minutes | 13 (1.5%) | 5 (0.9%) |
| 40 to 44 Minutes | 85 (10.1%) | 44 (7.8%) |
| 45 to 59 Minutes | 208 (24.8%) | 67 (11.9%) |
| 60 to 89 Minutes | 22 (2.6%) | 16 (2.8%) |
| 90 or more Minutes | 10 (1.2%) | 4 (0.7%) |
Time of Departure to Work by Sex in Surf City
The most frequent times of departure to work in Surf City are 8:00 AM to 8:29 AM (160, 19.1%) for males and 7:00 AM to 7:29 AM (162, 28.8%) for females.
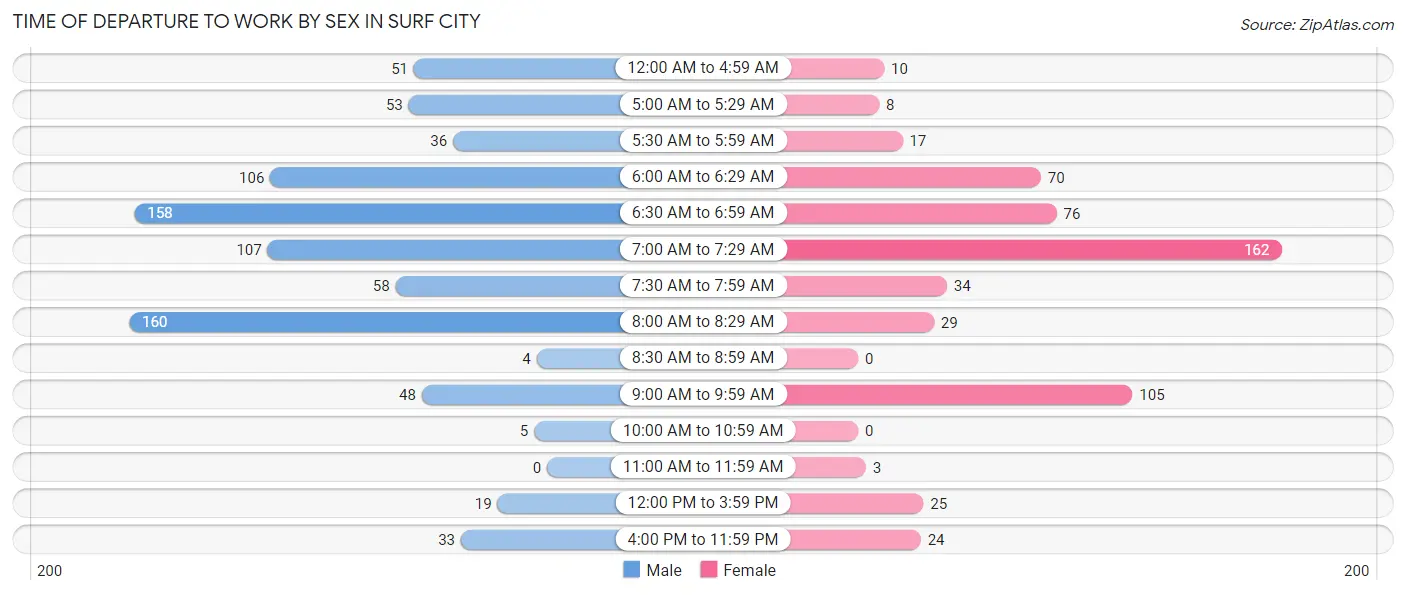
| Time of Departure | Male | Female |
| 12:00 AM to 4:59 AM | 51 (6.1%) | 10 (1.8%) |
| 5:00 AM to 5:29 AM | 53 (6.3%) | 8 (1.4%) |
| 5:30 AM to 5:59 AM | 36 (4.3%) | 17 (3.0%) |
| 6:00 AM to 6:29 AM | 106 (12.7%) | 70 (12.4%) |
| 6:30 AM to 6:59 AM | 158 (18.9%) | 76 (13.5%) |
| 7:00 AM to 7:29 AM | 107 (12.8%) | 162 (28.8%) |
| 7:30 AM to 7:59 AM | 58 (6.9%) | 34 (6.0%) |
| 8:00 AM to 8:29 AM | 160 (19.1%) | 29 (5.1%) |
| 8:30 AM to 8:59 AM | 4 (0.5%) | 0 (0.0%) |
| 9:00 AM to 9:59 AM | 48 (5.7%) | 105 (18.6%) |
| 10:00 AM to 10:59 AM | 5 (0.6%) | 0 (0.0%) |
| 11:00 AM to 11:59 AM | 0 (0.0%) | 3 (0.5%) |
| 12:00 PM to 3:59 PM | 19 (2.3%) | 25 (4.4%) |
| 4:00 PM to 11:59 PM | 33 (3.9%) | 24 (4.3%) |
| Total | 838 (100.0%) | 563 (100.0%) |
Housing Occupancy in Surf City
Occupancy by Ownership in Surf City
Of the total 1,456 dwellings in Surf City, owner-occupied units account for 1,178 (80.9%), while renter-occupied units make up 278 (19.1%).
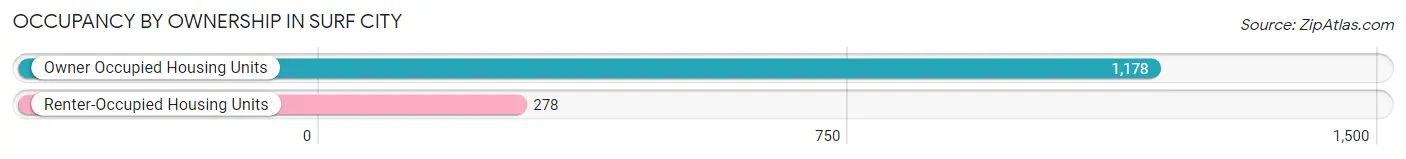
| Occupancy | # Housing Units | % Housing Units |
| Owner Occupied Housing Units | 1,178 | 80.9% |
| Renter-Occupied Housing Units | 278 | 19.1% |
| Total Occupied Housing Units | 1,456 | 100.0% |
Occupancy by Household Size in Surf City
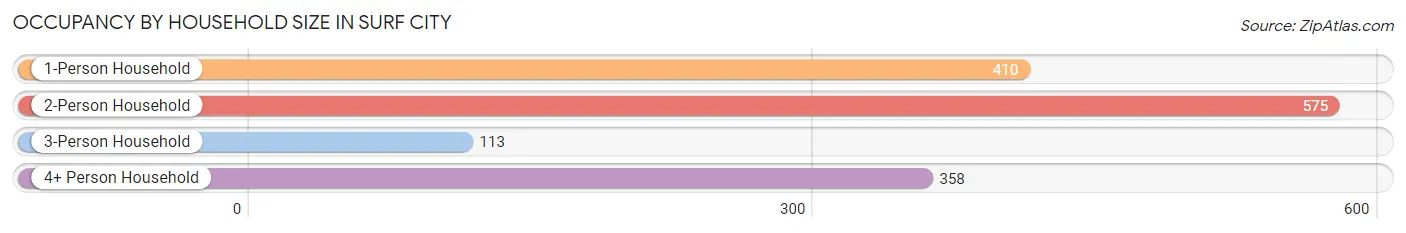
| Household Size | # Housing Units | % Housing Units |
| 1-Person Household | 410 | 28.2% |
| 2-Person Household | 575 | 39.5% |
| 3-Person Household | 113 | 7.8% |
| 4+ Person Household | 358 | 24.6% |
| Total Housing Units | 1,456 | 100.0% |
Occupancy by Ownership by Household Size in Surf City
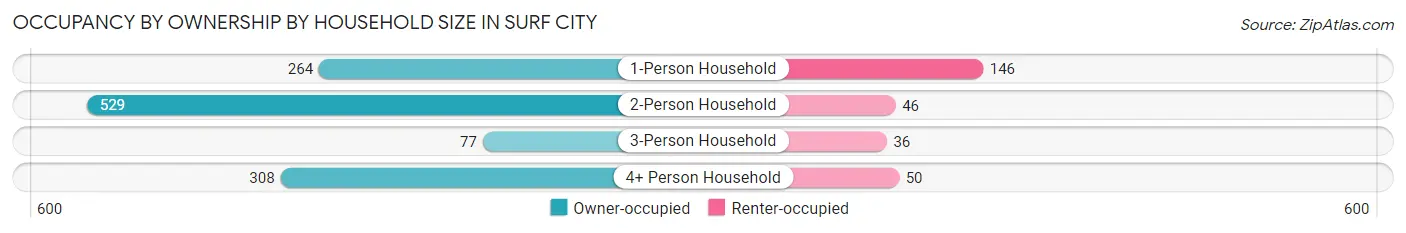
| Household Size | Owner-occupied | Renter-occupied |
| 1-Person Household | 264 (64.4%) | 146 (35.6%) |
| 2-Person Household | 529 (92.0%) | 46 (8.0%) |
| 3-Person Household | 77 (68.1%) | 36 (31.9%) |
| 4+ Person Household | 308 (86.0%) | 50 (14.0%) |
| Total Housing Units | 1,178 (80.9%) | 278 (19.1%) |
Occupancy by Educational Attainment in Surf City
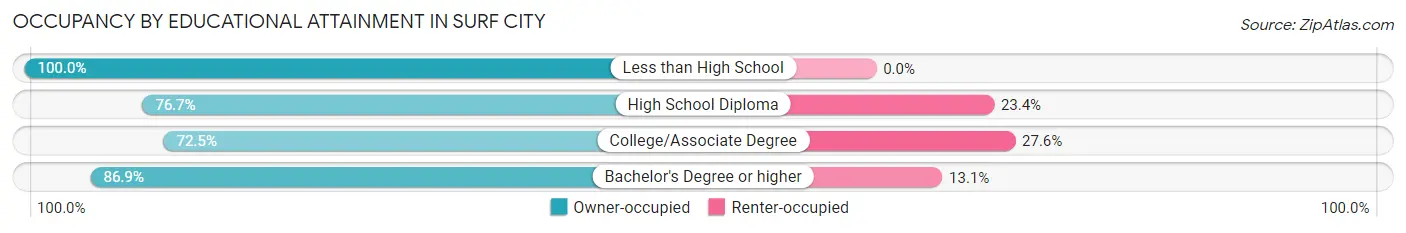
| Household Size | Owner-occupied | Renter-occupied |
| Less than High School | 19 (100.0%) | 0 (0.0%) |
| High School Diploma | 174 (76.6%) | 53 (23.4%) |
| College/Associate Degree | 334 (72.5%) | 127 (27.6%) |
| Bachelor's Degree or higher | 651 (86.9%) | 98 (13.1%) |
Occupancy by Age of Householder in Surf City
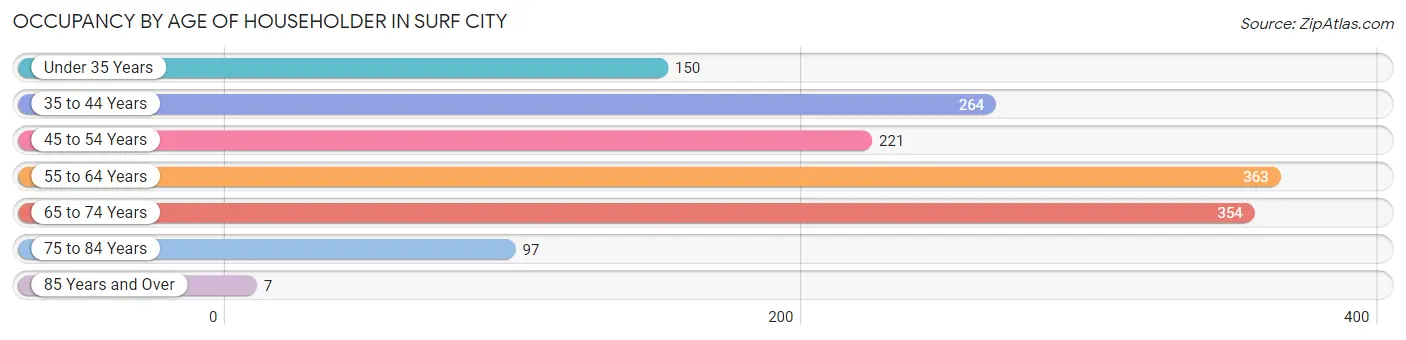
| Age Bracket | # Households | % Households |
| Under 35 Years | 150 | 10.3% |
| 35 to 44 Years | 264 | 18.1% |
| 45 to 54 Years | 221 | 15.2% |
| 55 to 64 Years | 363 | 24.9% |
| 65 to 74 Years | 354 | 24.3% |
| 75 to 84 Years | 97 | 6.7% |
| 85 Years and Over | 7 | 0.5% |
| Total | 1,456 | 100.0% |
Housing Finances in Surf City
Median Income by Occupancy in Surf City
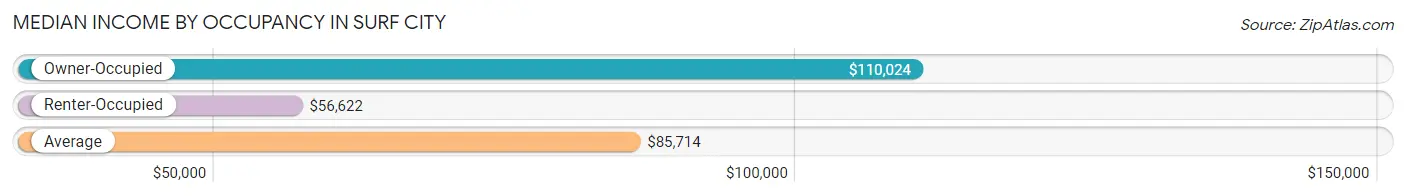
| Occupancy Type | # Households | Median Income |
| Owner-Occupied | 1,178 (80.9%) | $110,024 |
| Renter-Occupied | 278 (19.1%) | $56,622 |
| Average | 1,456 (100.0%) | $85,714 |
Occupancy by Householder Income Bracket in Surf City
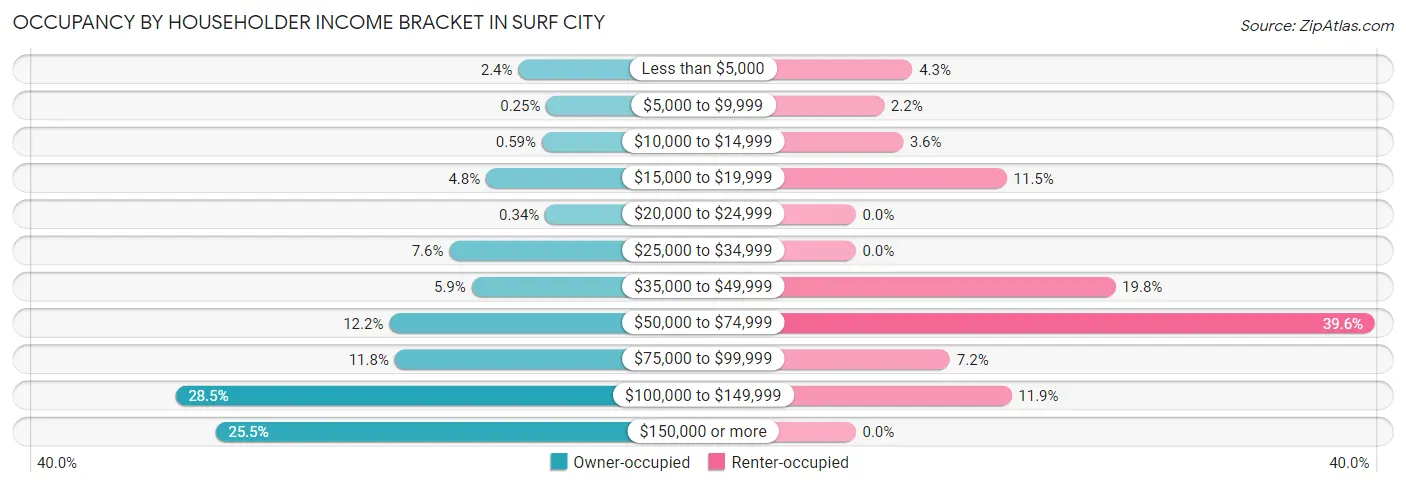
| Income Bracket | Owner-occupied | Renter-occupied |
| Less than $5,000 | 28 (2.4%) | 12 (4.3%) |
| $5,000 to $9,999 | 3 (0.3%) | 6 (2.2%) |
| $10,000 to $14,999 | 7 (0.6%) | 10 (3.6%) |
| $15,000 to $19,999 | 57 (4.8%) | 32 (11.5%) |
| $20,000 to $24,999 | 4 (0.3%) | 0 (0.0%) |
| $25,000 to $34,999 | 90 (7.6%) | 0 (0.0%) |
| $35,000 to $49,999 | 70 (5.9%) | 55 (19.8%) |
| $50,000 to $74,999 | 144 (12.2%) | 110 (39.6%) |
| $75,000 to $99,999 | 139 (11.8%) | 20 (7.2%) |
| $100,000 to $149,999 | 336 (28.5%) | 33 (11.9%) |
| $150,000 or more | 300 (25.5%) | 0 (0.0%) |
| Total | 1,178 (100.0%) | 278 (100.0%) |
Monthly Housing Cost Tiers in Surf City
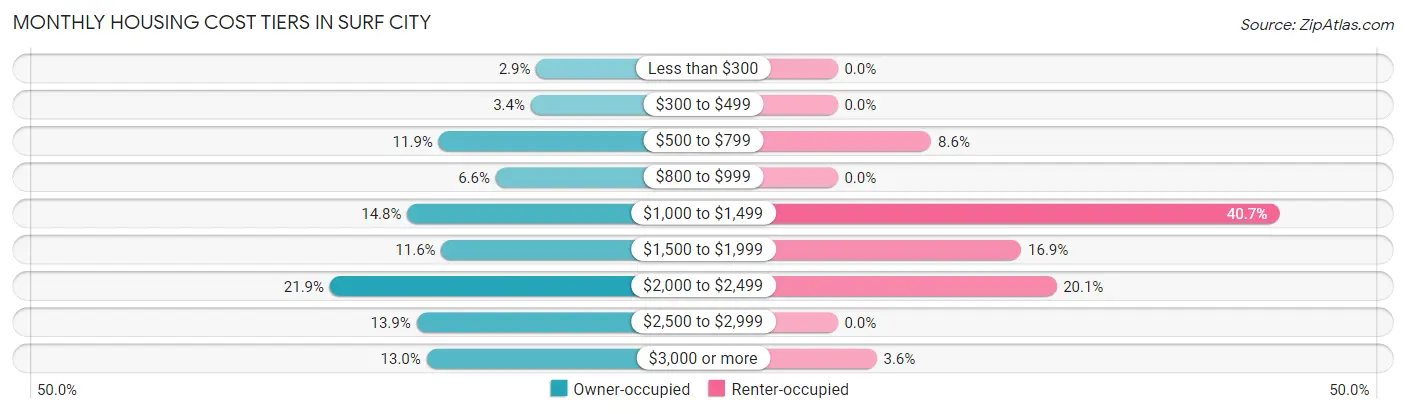
| Monthly Cost | Owner-occupied | Renter-occupied |
| Less than $300 | 34 (2.9%) | 0 (0.0%) |
| $300 to $499 | 40 (3.4%) | 0 (0.0%) |
| $500 to $799 | 140 (11.9%) | 24 (8.6%) |
| $800 to $999 | 78 (6.6%) | 0 (0.0%) |
| $1,000 to $1,499 | 174 (14.8%) | 113 (40.6%) |
| $1,500 to $1,999 | 137 (11.6%) | 47 (16.9%) |
| $2,000 to $2,499 | 258 (21.9%) | 56 (20.1%) |
| $2,500 to $2,999 | 164 (13.9%) | 0 (0.0%) |
| $3,000 or more | 153 (13.0%) | 10 (3.6%) |
| Total | 1,178 (100.0%) | 278 (100.0%) |
Physical Housing Characteristics in Surf City
Housing Structures in Surf City
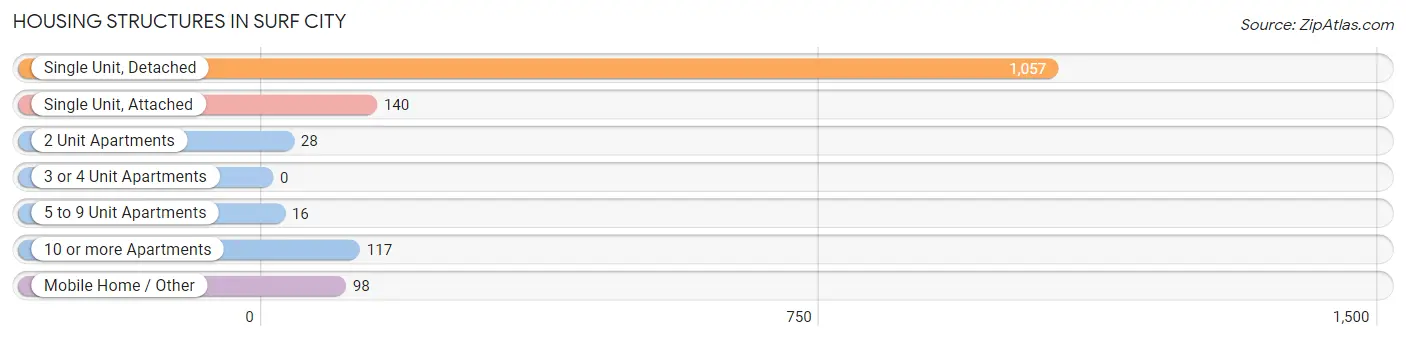
| Structure Type | # Housing Units | % Housing Units |
| Single Unit, Detached | 1,057 | 72.6% |
| Single Unit, Attached | 140 | 9.6% |
| 2 Unit Apartments | 28 | 1.9% |
| 3 or 4 Unit Apartments | 0 | 0.0% |
| 5 to 9 Unit Apartments | 16 | 1.1% |
| 10 or more Apartments | 117 | 8.0% |
| Mobile Home / Other | 98 | 6.7% |
| Total | 1,456 | 100.0% |
Housing Structures by Occupancy in Surf City
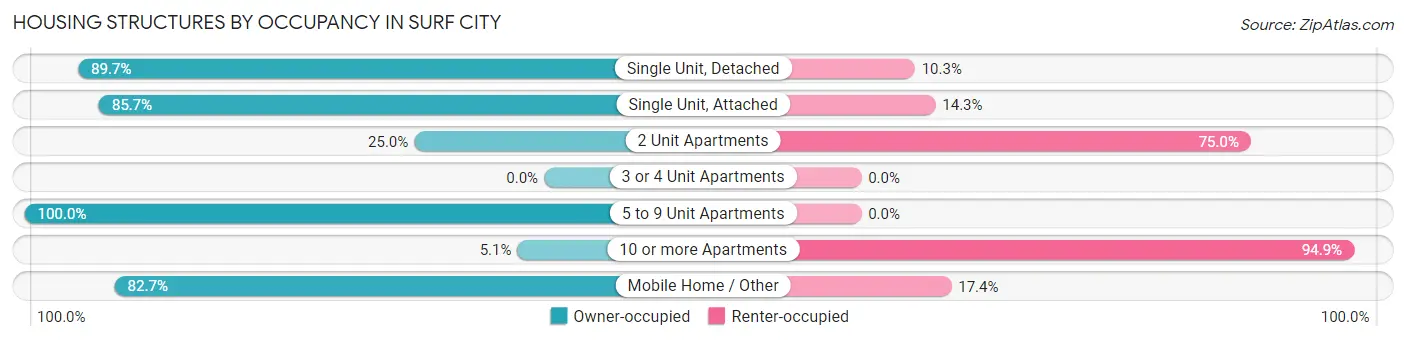
| Structure Type | Owner-occupied | Renter-occupied |
| Single Unit, Detached | 948 (89.7%) | 109 (10.3%) |
| Single Unit, Attached | 120 (85.7%) | 20 (14.3%) |
| 2 Unit Apartments | 7 (25.0%) | 21 (75.0%) |
| 3 or 4 Unit Apartments | 0 (0.0%) | 0 (0.0%) |
| 5 to 9 Unit Apartments | 16 (100.0%) | 0 (0.0%) |
| 10 or more Apartments | 6 (5.1%) | 111 (94.9%) |
| Mobile Home / Other | 81 (82.7%) | 17 (17.3%) |
| Total | 1,178 (80.9%) | 278 (19.1%) |
Housing Structures by Number of Rooms in Surf City
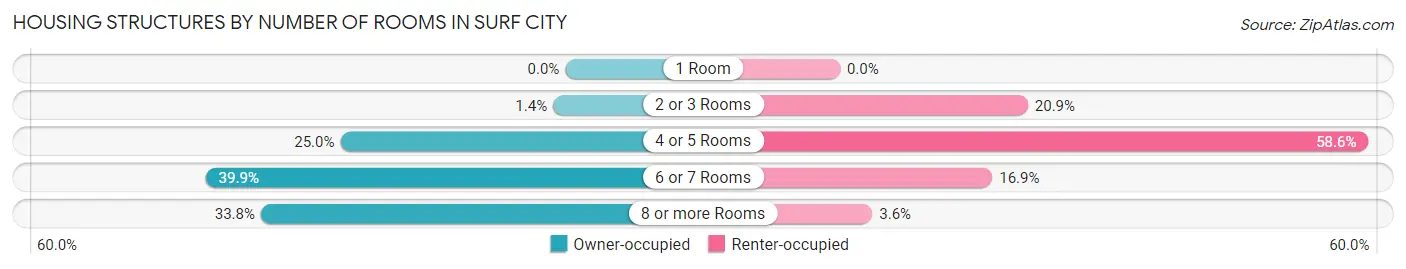
| Number of Rooms | Owner-occupied | Renter-occupied |
| 1 Room | 0 (0.0%) | 0 (0.0%) |
| 2 or 3 Rooms | 16 (1.4%) | 58 (20.9%) |
| 4 or 5 Rooms | 294 (25.0%) | 163 (58.6%) |
| 6 or 7 Rooms | 470 (39.9%) | 47 (16.9%) |
| 8 or more Rooms | 398 (33.8%) | 10 (3.6%) |
| Total | 1,178 (100.0%) | 278 (100.0%) |
Housing Structure by Heating Type in Surf City
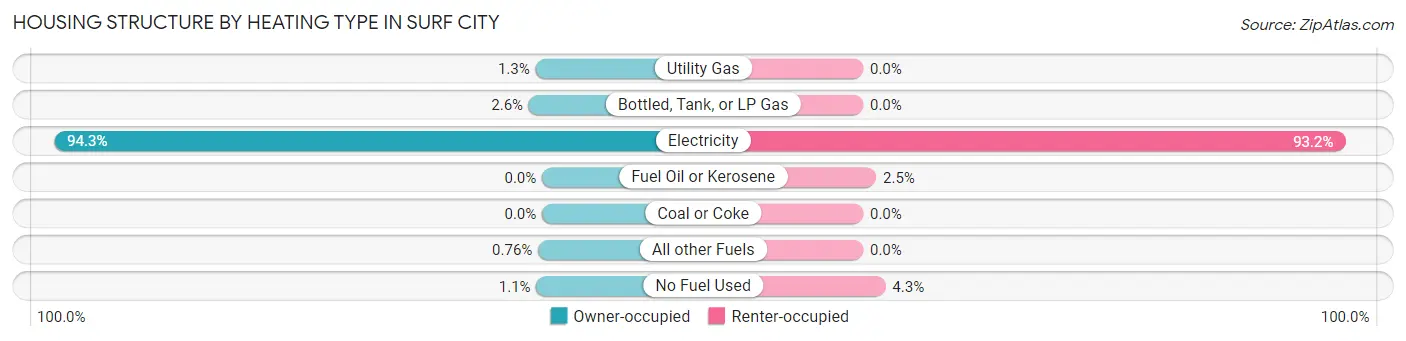
| Heating Type | Owner-occupied | Renter-occupied |
| Utility Gas | 15 (1.3%) | 0 (0.0%) |
| Bottled, Tank, or LP Gas | 30 (2.5%) | 0 (0.0%) |
| Electricity | 1,111 (94.3%) | 259 (93.2%) |
| Fuel Oil or Kerosene | 0 (0.0%) | 7 (2.5%) |
| Coal or Coke | 0 (0.0%) | 0 (0.0%) |
| All other Fuels | 9 (0.8%) | 0 (0.0%) |
| No Fuel Used | 13 (1.1%) | 12 (4.3%) |
| Total | 1,178 (100.0%) | 278 (100.0%) |
Household Vehicle Usage in Surf City
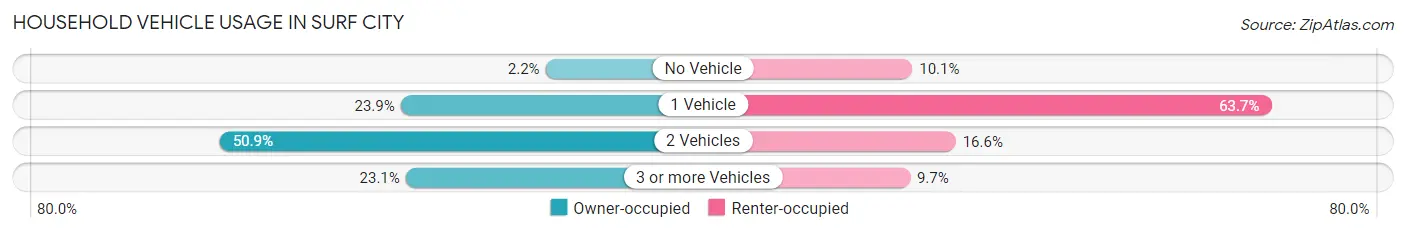
| Vehicles per Household | Owner-occupied | Renter-occupied |
| No Vehicle | 26 (2.2%) | 28 (10.1%) |
| 1 Vehicle | 281 (23.8%) | 177 (63.7%) |
| 2 Vehicles | 599 (50.8%) | 46 (16.6%) |
| 3 or more Vehicles | 272 (23.1%) | 27 (9.7%) |
| Total | 1,178 (100.0%) | 278 (100.0%) |
Real Estate & Mortgages in Surf City
Real Estate and Mortgage Overview in Surf City
| Characteristic | Without Mortgage | With Mortgage |
| Housing Units | 379 | 799 |
| Median Property Value | $454,900 | $450,700 |
| Median Household Income | $83,438 | $254 |
| Monthly Housing Costs | $773 | $153 |
| Real Estate Taxes | $3,193 | $4 |
Property Value by Mortgage Status in Surf City
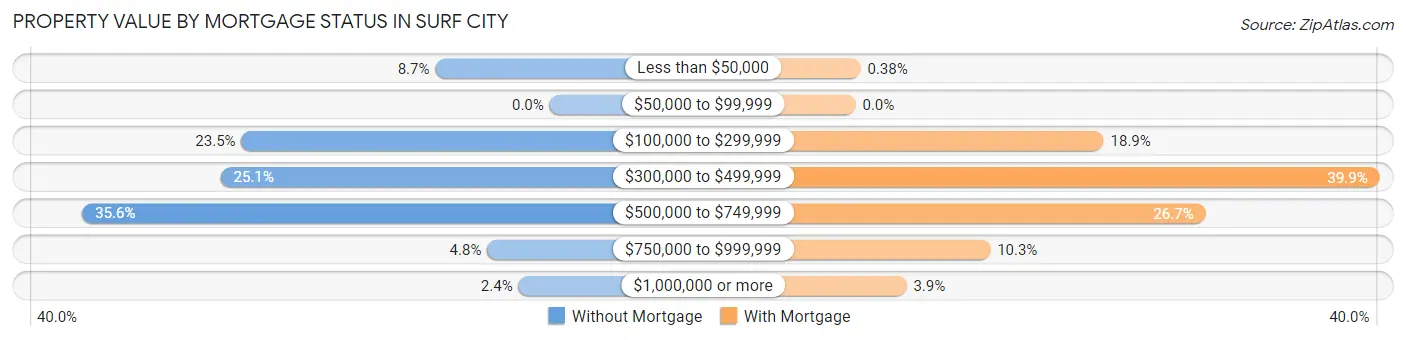
| Property Value | Without Mortgage | With Mortgage |
| Less than $50,000 | 33 (8.7%) | 3 (0.4%) |
| $50,000 to $99,999 | 0 (0.0%) | 0 (0.0%) |
| $100,000 to $299,999 | 89 (23.5%) | 151 (18.9%) |
| $300,000 to $499,999 | 95 (25.1%) | 319 (39.9%) |
| $500,000 to $749,999 | 135 (35.6%) | 213 (26.7%) |
| $750,000 to $999,999 | 18 (4.8%) | 82 (10.3%) |
| $1,000,000 or more | 9 (2.4%) | 31 (3.9%) |
| Total | 379 (100.0%) | 799 (100.0%) |
Household Income by Mortgage Status in Surf City
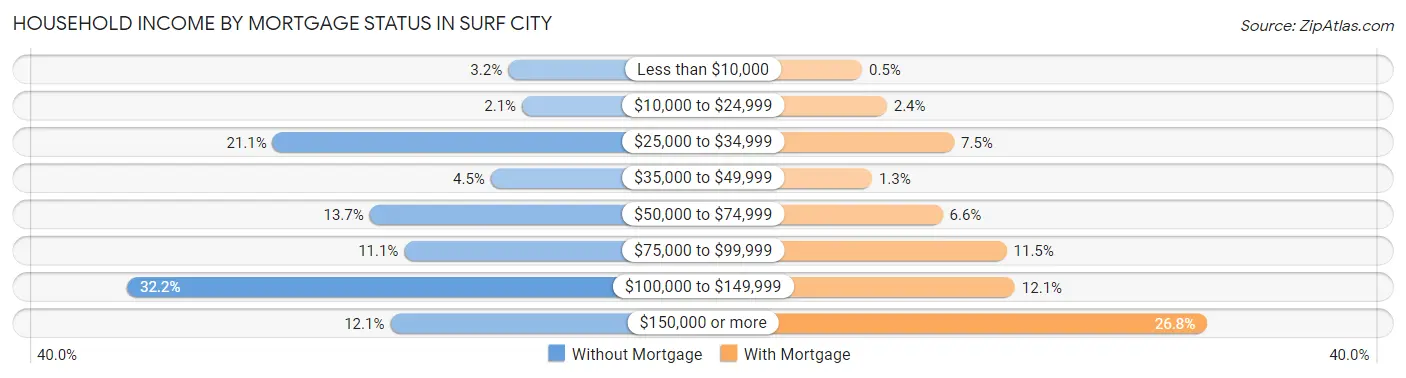
| Household Income | Without Mortgage | With Mortgage |
| Less than $10,000 | 12 (3.2%) | 4 (0.5%) |
| $10,000 to $24,999 | 8 (2.1%) | 19 (2.4%) |
| $25,000 to $34,999 | 80 (21.1%) | 60 (7.5%) |
| $35,000 to $49,999 | 17 (4.5%) | 10 (1.3%) |
| $50,000 to $74,999 | 52 (13.7%) | 53 (6.6%) |
| $75,000 to $99,999 | 42 (11.1%) | 92 (11.5%) |
| $100,000 to $149,999 | 122 (32.2%) | 97 (12.1%) |
| $150,000 or more | 46 (12.1%) | 214 (26.8%) |
| Total | 379 (100.0%) | 799 (100.0%) |
Property Value to Household Income Ratio in Surf City
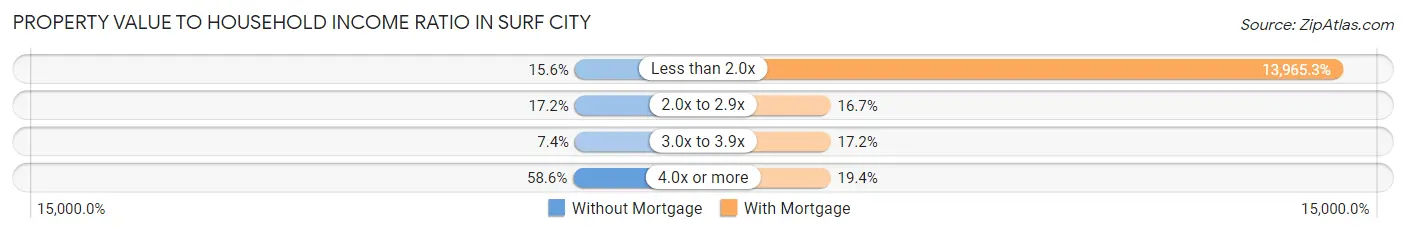
| Value-to-Income Ratio | Without Mortgage | With Mortgage |
| Less than 2.0x | 59 (15.6%) | 111,583 (13,965.3%) |
| 2.0x to 2.9x | 65 (17.2%) | 133 (16.7%) |
| 3.0x to 3.9x | 28 (7.4%) | 137 (17.2%) |
| 4.0x or more | 222 (58.6%) | 155 (19.4%) |
| Total | 379 (100.0%) | 799 (100.0%) |
Real Estate Taxes by Mortgage Status in Surf City
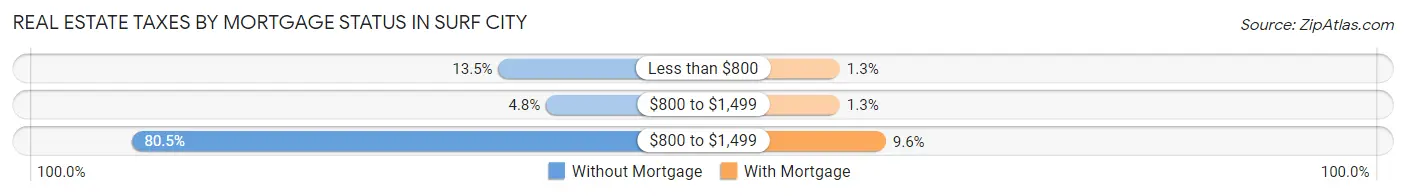
| Property Taxes | Without Mortgage | With Mortgage |
| Less than $800 | 51 (13.5%) | 10 (1.3%) |
| $800 to $1,499 | 18 (4.8%) | 10 (1.3%) |
| $800 to $1,499 | 305 (80.5%) | 77 (9.6%) |
| Total | 379 (100.0%) | 799 (100.0%) |
Health & Disability in Surf City
Health Insurance Coverage by Age in Surf City
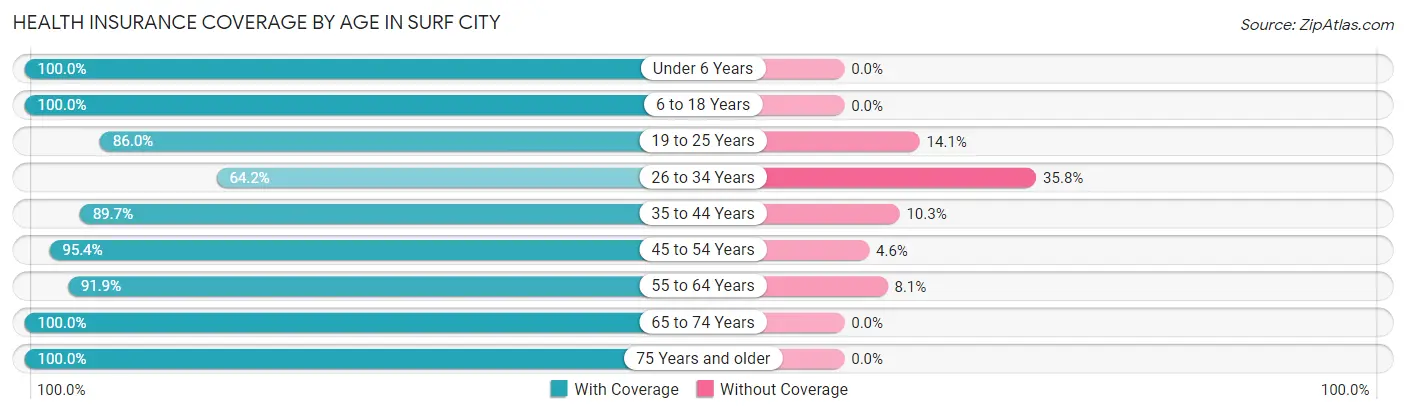
| Age Bracket | With Coverage | Without Coverage |
| Under 6 Years | 195 (100.0%) | 0 (0.0%) |
| 6 to 18 Years | 783 (100.0%) | 0 (0.0%) |
| 19 to 25 Years | 312 (86.0%) | 51 (14.1%) |
| 26 to 34 Years | 201 (64.2%) | 112 (35.8%) |
| 35 to 44 Years | 366 (89.7%) | 42 (10.3%) |
| 45 to 54 Years | 330 (95.4%) | 16 (4.6%) |
| 55 to 64 Years | 627 (91.9%) | 55 (8.1%) |
| 65 to 74 Years | 529 (100.0%) | 0 (0.0%) |
| 75 Years and older | 153 (100.0%) | 0 (0.0%) |
| Total | 3,496 (92.7%) | 276 (7.3%) |
Health Insurance Coverage by Citizenship Status in Surf City
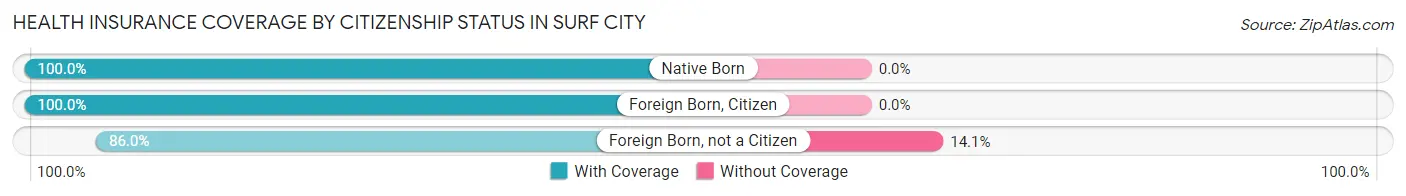
| Citizenship Status | With Coverage | Without Coverage |
| Native Born | 195 (100.0%) | 0 (0.0%) |
| Foreign Born, Citizen | 783 (100.0%) | 0 (0.0%) |
| Foreign Born, not a Citizen | 312 (86.0%) | 51 (14.1%) |
Health Insurance Coverage by Household Income in Surf City
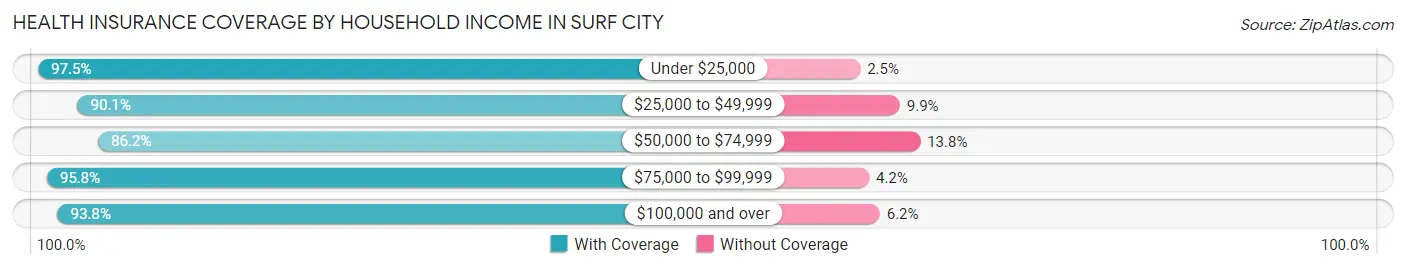
| Household Income | With Coverage | Without Coverage |
| Under $25,000 | 232 (97.5%) | 6 (2.5%) |
| $25,000 to $49,999 | 326 (90.1%) | 36 (9.9%) |
| $50,000 to $74,999 | 520 (86.2%) | 83 (13.8%) |
| $75,000 to $99,999 | 368 (95.8%) | 16 (4.2%) |
| $100,000 and over | 2,050 (93.8%) | 135 (6.2%) |
Public vs Private Health Insurance Coverage by Age in Surf City
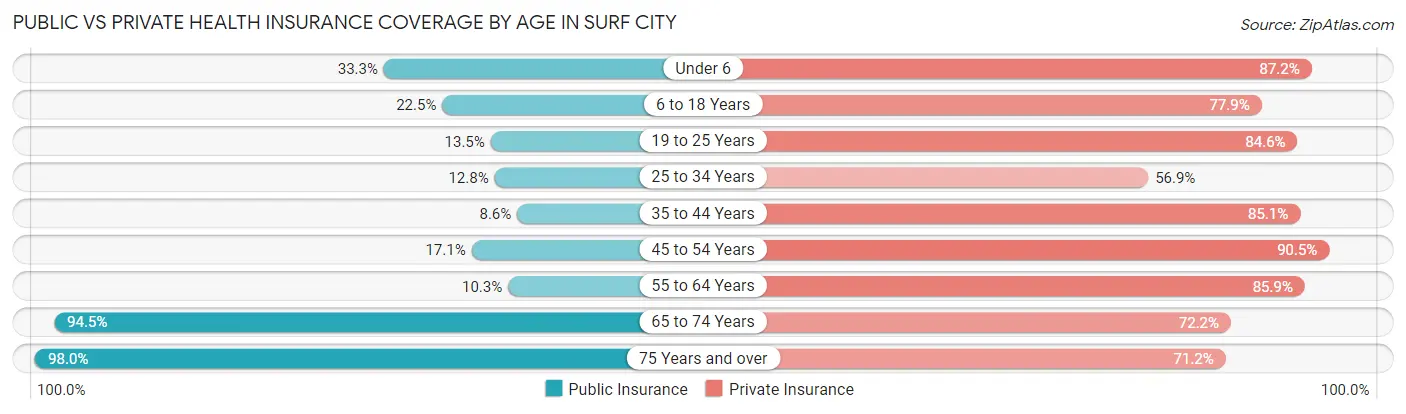
| Age Bracket | Public Insurance | Private Insurance |
| Under 6 | 65 (33.3%) | 170 (87.2%) |
| 6 to 18 Years | 176 (22.5%) | 610 (77.9%) |
| 19 to 25 Years | 49 (13.5%) | 307 (84.6%) |
| 25 to 34 Years | 40 (12.8%) | 178 (56.9%) |
| 35 to 44 Years | 35 (8.6%) | 347 (85.1%) |
| 45 to 54 Years | 59 (17.1%) | 313 (90.5%) |
| 55 to 64 Years | 70 (10.3%) | 586 (85.9%) |
| 65 to 74 Years | 500 (94.5%) | 382 (72.2%) |
| 75 Years and over | 150 (98.0%) | 109 (71.2%) |
| Total | 1,144 (30.3%) | 3,002 (79.6%) |
Disability Status by Sex by Age in Surf City
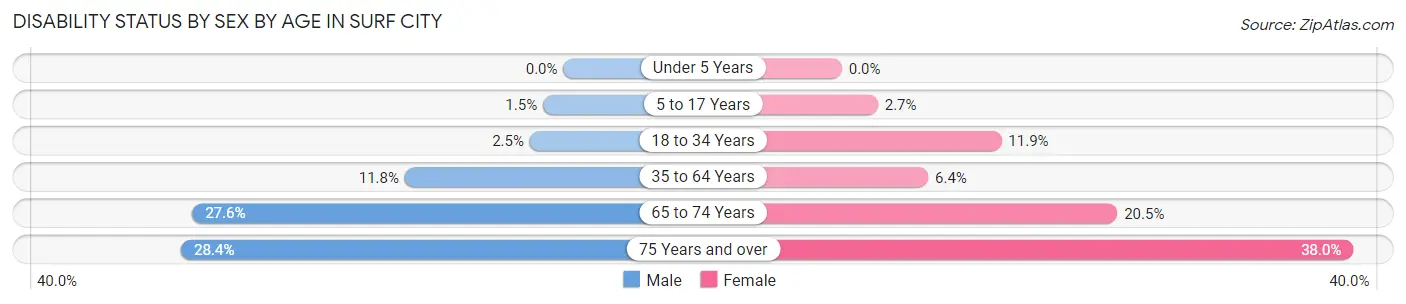
| Age Bracket | Male | Female |
| Under 5 Years | 0 (0.0%) | 0 (0.0%) |
| 5 to 17 Years | 6 (1.5%) | 11 (2.7%) |
| 18 to 34 Years | 9 (2.5%) | 39 (11.8%) |
| 35 to 64 Years | 79 (11.8%) | 49 (6.4%) |
| 65 to 74 Years | 73 (27.6%) | 54 (20.4%) |
| 75 Years and over | 21 (28.4%) | 30 (38.0%) |
Disability Class by Sex by Age in Surf City
Disability Class: Hearing Difficulty
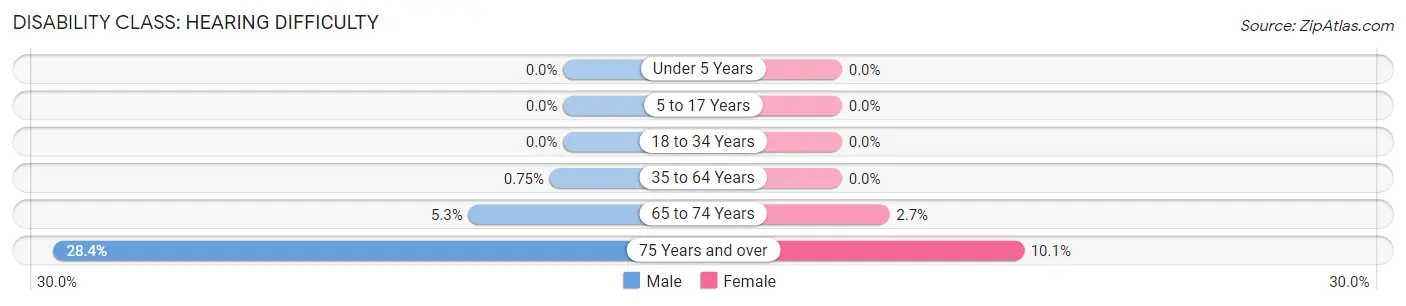
| Age Bracket | Male | Female |
| Under 5 Years | 0 (0.0%) | 0 (0.0%) |
| 5 to 17 Years | 0 (0.0%) | 0 (0.0%) |
| 18 to 34 Years | 0 (0.0%) | 0 (0.0%) |
| 35 to 64 Years | 5 (0.7%) | 0 (0.0%) |
| 65 to 74 Years | 14 (5.3%) | 7 (2.6%) |
| 75 Years and over | 21 (28.4%) | 8 (10.1%) |
Disability Class: Vision Difficulty
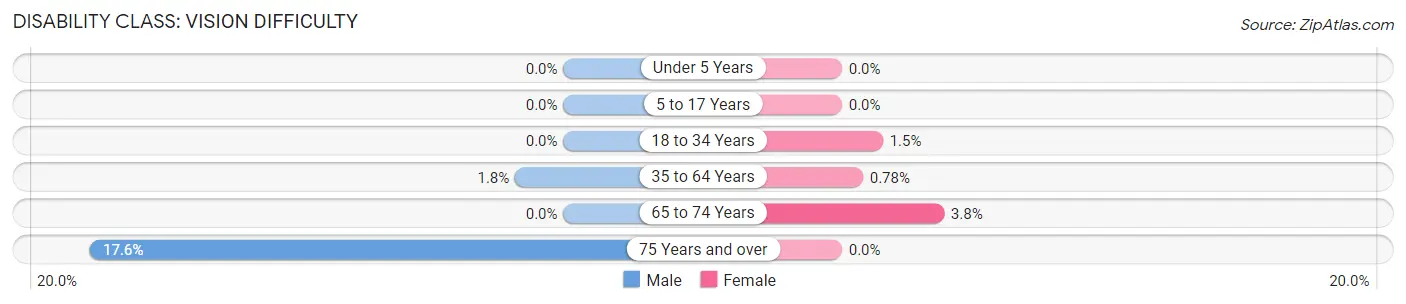
| Age Bracket | Male | Female |
| Under 5 Years | 0 (0.0%) | 0 (0.0%) |
| 5 to 17 Years | 0 (0.0%) | 0 (0.0%) |
| 18 to 34 Years | 0 (0.0%) | 5 (1.5%) |
| 35 to 64 Years | 12 (1.8%) | 6 (0.8%) |
| 65 to 74 Years | 0 (0.0%) | 10 (3.8%) |
| 75 Years and over | 13 (17.6%) | 0 (0.0%) |
Disability Class: Cognitive Difficulty
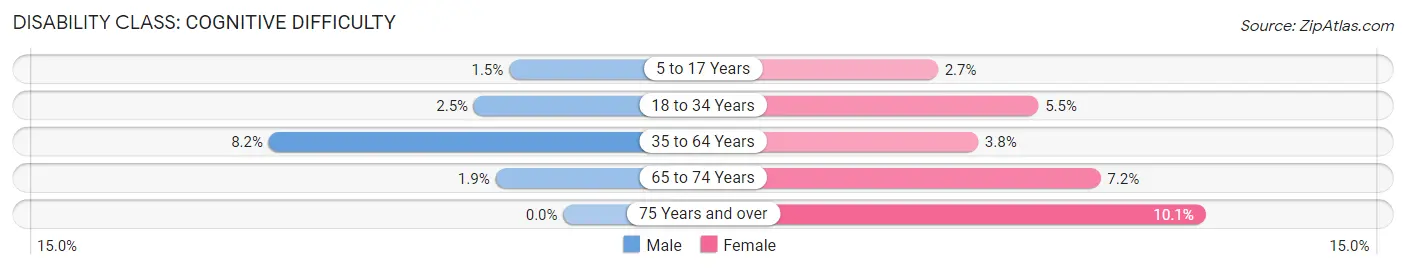
| Age Bracket | Male | Female |
| 5 to 17 Years | 6 (1.5%) | 11 (2.7%) |
| 18 to 34 Years | 9 (2.5%) | 18 (5.5%) |
| 35 to 64 Years | 55 (8.2%) | 29 (3.8%) |
| 65 to 74 Years | 5 (1.9%) | 19 (7.2%) |
| 75 Years and over | 0 (0.0%) | 8 (10.1%) |
Disability Class: Ambulatory Difficulty
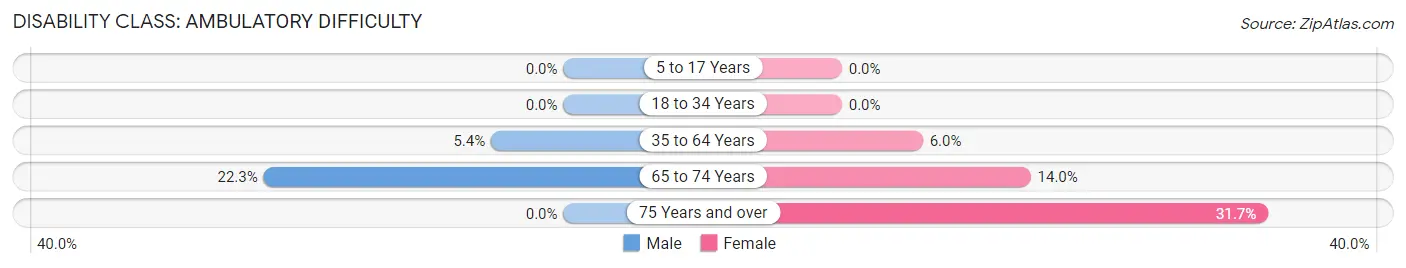
| Age Bracket | Male | Female |
| 5 to 17 Years | 0 (0.0%) | 0 (0.0%) |
| 18 to 34 Years | 0 (0.0%) | 0 (0.0%) |
| 35 to 64 Years | 36 (5.4%) | 46 (6.0%) |
| 65 to 74 Years | 59 (22.3%) | 37 (14.0%) |
| 75 Years and over | 0 (0.0%) | 25 (31.7%) |
Disability Class: Self-Care Difficulty
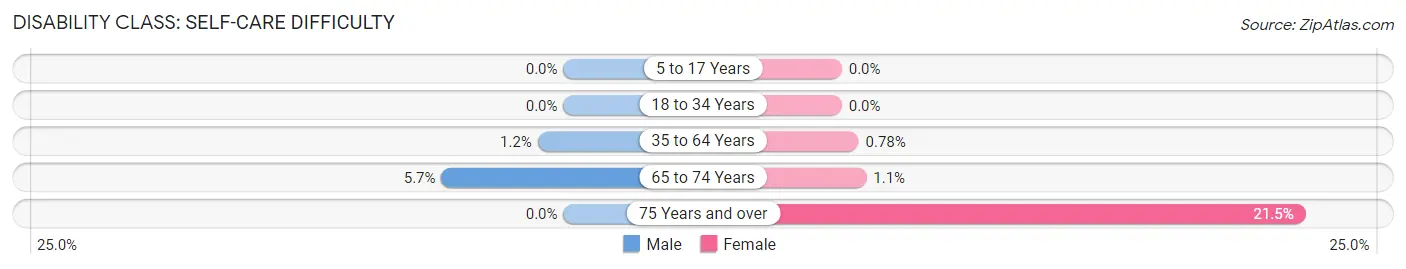
| Age Bracket | Male | Female |
| 5 to 17 Years | 0 (0.0%) | 0 (0.0%) |
| 18 to 34 Years | 0 (0.0%) | 0 (0.0%) |
| 35 to 64 Years | 8 (1.2%) | 6 (0.8%) |
| 65 to 74 Years | 15 (5.7%) | 3 (1.1%) |
| 75 Years and over | 0 (0.0%) | 17 (21.5%) |
Technology Access in Surf City
Computing Device Access in Surf City
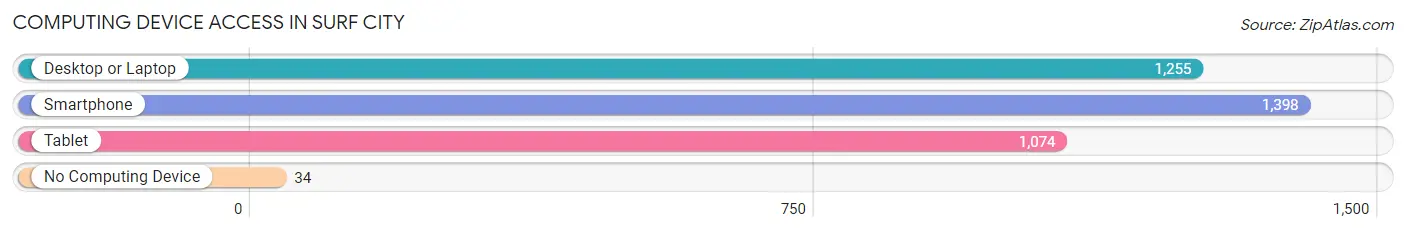
| Device Type | # Households | % Households |
| Desktop or Laptop | 1,255 | 86.2% |
| Smartphone | 1,398 | 96.0% |
| Tablet | 1,074 | 73.8% |
| No Computing Device | 34 | 2.3% |
| Total | 1,456 | 100.0% |
Internet Access in Surf City
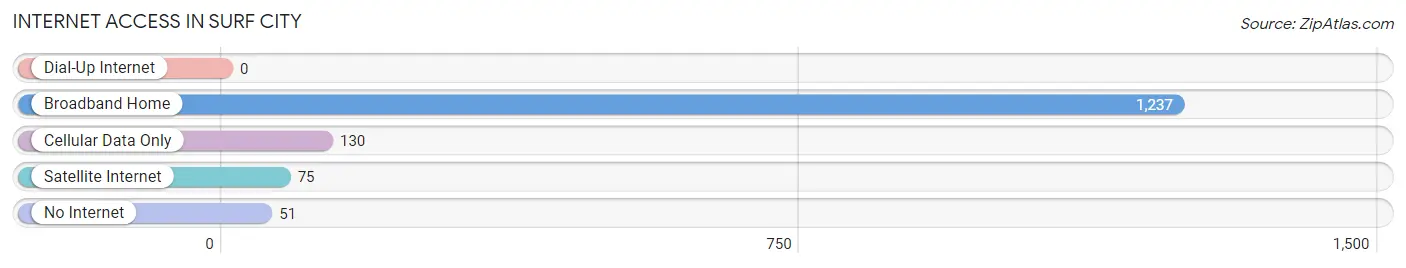
| Internet Type | # Households | % Households |
| Dial-Up Internet | 0 | 0.0% |
| Broadband Home | 1,237 | 85.0% |
| Cellular Data Only | 130 | 8.9% |
| Satellite Internet | 75 | 5.1% |
| No Internet | 51 | 3.5% |
| Total | 1,456 | 100.0% |
Surf City Summary
Surf City, North Carolina is a small town located in Pender County, North Carolina. It is situated on the Atlantic Ocean, just north of Wilmington, and is part of the Wilmington Metropolitan Statistical Area. The town has a population of approximately 2,000 people and is a popular tourist destination due to its proximity to the beach.
Geography
Surf City is located on the Atlantic Ocean, just north of Wilmington, North Carolina. It is situated on the Intracoastal Waterway, which is a navigable waterway that runs along the eastern coast of the United States. The town is bordered by the towns of Topsail Beach to the north, Holly Ridge to the east, and Hampstead to the south. The town is located on a barrier island, which is a long, narrow strip of land that separates the ocean from the mainland. The island is approximately 4 miles long and 1 mile wide.
The town is located in a humid subtropical climate zone, which is characterized by hot, humid summers and mild winters. The average temperature in the summer is around 80 degrees Fahrenheit, and the average temperature in the winter is around 50 degrees Fahrenheit. The town receives an average of 50 inches of rain per year.
Economy
Surf City’s economy is largely based on tourism. The town is a popular destination for beachgoers, and it is home to several hotels, restaurants, and other businesses that cater to tourists. The town also has a thriving fishing industry, and it is home to several seafood restaurants.
The town is also home to several manufacturing companies, including a boat manufacturing company and a furniture manufacturing company. The town is also home to several small businesses, including a grocery store, a hardware store, and a pharmacy.
Demographics
As of the 2010 census, the population of Surf City was 2,037. The racial makeup of the town was 94.3% White, 2.2% African American, 0.7% Native American, 0.7% Asian, 0.2% Pacific Islander, 0.7% from other races, and 1.2% from two or more races. Hispanic or Latino of any race were 2.2% of the population.
The median household income in Surf City was $41,250, and the median family income was $50,000. The per capita income for the town was $20,945. About 11.2% of families and 14.2% of the population were below the poverty line, including 18.2% of those under age 18 and 8.3% of those age 65 or over.
Conclusion
Surf City, North Carolina is a small town located in Pender County, North Carolina. It is situated on the Atlantic Ocean, just north of Wilmington, and is part of the Wilmington Metropolitan Statistical Area. The town has a population of approximately 2,000 people and is a popular tourist destination due to its proximity to the beach. The town’s economy is largely based on tourism, and it is home to several manufacturing companies and small businesses. The town has a diverse population, with a median household income of $41,250 and a median family income of $50,000.
Common Questions
What is Per Capita Income in Surf City?
Per Capita income in Surf City is $45,364.
What is the Median Family Income in Surf City?
Median Family Income in Surf City is $110,554.
What is the Median Household income in Surf City?
Median Household Income in Surf City is $85,714.
What is Income or Wage Gap in Surf City?
Income or Wage Gap in Surf City is 25.8%.
Women in Surf City earn 74.2 cents for every dollar earned by a man.
What is Inequality or Gini Index in Surf City?
Inequality or Gini Index in Surf City is 0.45.
What is the Total Population of Surf City?
Total Population of Surf City is 3,888.
What is the Total Male Population of Surf City?
Total Male Population of Surf City is 1,926.
What is the Total Female Population of Surf City?
Total Female Population of Surf City is 1,962.
What is the Ratio of Males per 100 Females in Surf City?
There are 98.17 Males per 100 Females in Surf City.
What is the Ratio of Females per 100 Males in Surf City?
There are 101.87 Females per 100 Males in Surf City.
What is the Median Population Age in Surf City?
Median Population Age in Surf City is 39.3 Years.
What is the Average Family Size in Surf City
Average Family Size in Surf City is 3.2 People.
What is the Average Household Size in Surf City
Average Household Size in Surf City is 2.7 People.
How Large is the Labor Force in Surf City?
There are 1,861 People in the Labor Forcein in Surf City.
What is the Percentage of People in the Labor Force in Surf City?
61.7% of People are in the Labor Force in Surf City.
What is the Unemployment Rate in Surf City?
Unemployment Rate in Surf City is 3.0%.