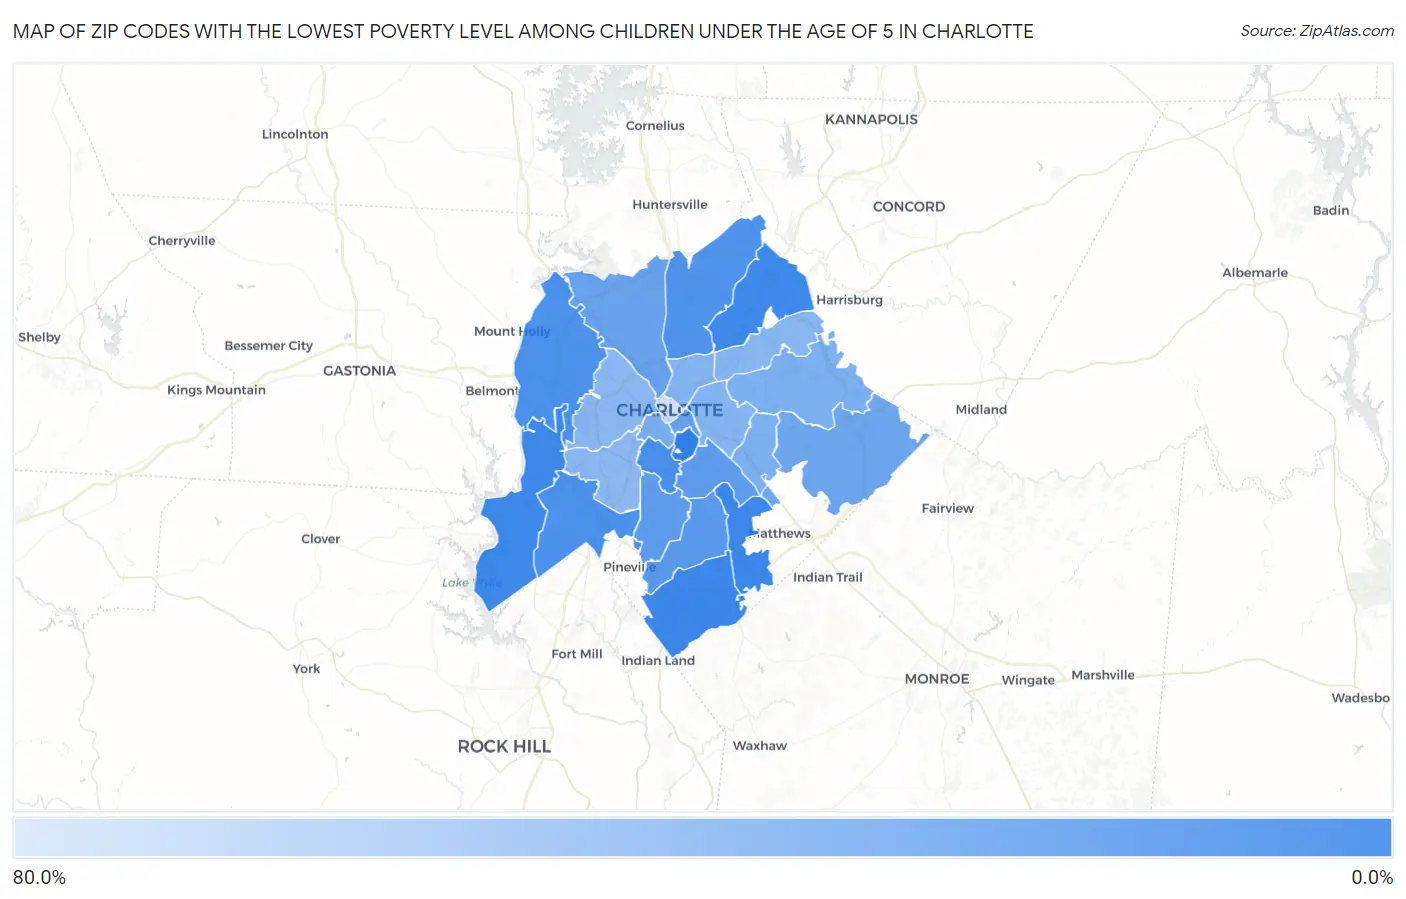
Zip Codes with the Lowest Poverty Level Among Children Under the Age of 5 in Charlotte, NC
RELATED REPORTS & OPTIONS
Lowest Poverty | Child 0-5
Charlotte
Compare Zip Codes
Map of Zip Codes with the Lowest Poverty Level Among Children Under the Age of 5 in Charlotte
68.5%
1.7%
Zip Codes with the Lowest Poverty Level Among Children Under the Age of 5 in Charlotte, NC
| Zip Code | Child Poverty | vs State | vs National | |
| 1. | 28277 | 1.7% | 20.3%(-18.6)#14 | 18.1%(-16.4)#644 |
| 2. | 28270 | 1.9% | 20.3%(-18.4)#15 | 18.1%(-16.2)#755 |
| 3. | 28278 | 2.6% | 20.3%(-17.7)#20 | 18.1%(-15.5)#1,213 |
| 4. | 28262 | 2.8% | 20.3%(-17.5)#23 | 18.1%(-15.3)#1,330 |
| 5. | 28209 | 5.5% | 20.3%(-14.8)#61 | 18.1%(-12.6)#3,249 |
| 6. | 28273 | 7.2% | 20.3%(-13.1)#87 | 18.1%(-10.9)#4,397 |
| 7. | 28214 | 7.2% | 20.3%(-13.0)#88 | 18.1%(-10.8)#4,441 |
| 8. | 28269 | 8.6% | 20.3%(-11.6)#118 | 18.1%(-9.42)#5,362 |
| 9. | 28226 | 12.2% | 20.3%(-8.05)#166 | 18.1%(-5.83)#7,593 |
| 10. | 28210 | 14.6% | 20.3%(-5.67)#193 | 18.1%(-3.45)#8,997 |
| 11. | 28211 | 14.7% | 20.3%(-5.62)#196 | 18.1%(-3.41)#9,020 |
| 12. | 28204 | 17.2% | 20.3%(-3.06)#240 | 18.1%(-0.842)#10,348 |
| 13. | 28216 | 18.1% | 20.3%(-2.21)#260 | 18.1%(+0.006)#10,742 |
| 14. | 28227 | 20.9% | 20.3%(+0.645)#300 | 18.1%(+2.86)#12,040 |
| 15. | 28203 | 25.1% | 20.3%(+4.79)#349 | 18.1%(+7.01)#13,717 |
| 16. | 28212 | 26.4% | 20.3%(+6.07)#362 | 18.1%(+8.29)#14,148 |
| 17. | 28215 | 27.0% | 20.3%(+6.70)#369 | 18.1%(+8.92)#14,358 |
| 18. | 28206 | 29.8% | 20.3%(+9.51)#393 | 18.1%(+11.7)#15,267 |
| 19. | 28205 | 30.5% | 20.3%(+10.3)#400 | 18.1%(+12.5)#15,467 |
| 20. | 28213 | 31.6% | 20.3%(+11.3)#408 | 18.1%(+13.5)#15,728 |
| 21. | 28208 | 32.2% | 20.3%(+11.9)#414 | 18.1%(+14.1)#15,868 |
| 22. | 28217 | 33.7% | 20.3%(+13.4)#429 | 18.1%(+15.7)#16,303 |
| 23. | 28202 | 68.5% | 20.3%(+48.2)#563 | 18.1%(+50.5)#20,462 |
1
Common Questions
What are the Top 10 Zip Codes with the Lowest Poverty Level Among Children Under the Age of 5 in Charlotte, NC?
Top 10 Zip Codes with the Lowest Poverty Level Among Children Under the Age of 5 in Charlotte, NC are:
What zip code has the Lowest Poverty Level Among Children Under the Age of 5 in Charlotte, NC?
28277 has the Lowest Poverty Level Among Children Under the Age of 5 in Charlotte, NC with 1.7%.
What is the Poverty Level Among Children Under the Age of 5 in Charlotte, NC?
Poverty Level Among Children Under the Age of 5 in Charlotte is 17.0%.
What is the Poverty Level Among Children Under the Age of 5 in North Carolina?
Poverty Level Among Children Under the Age of 5 in North Carolina is 20.3%.
What is the Poverty Level Among Children Under the Age of 5 in the United States?
Poverty Level Among Children Under the Age of 5 in the United States is 18.1%.