Half Moon, NC Map & Demographics
Half Moon Map
Half Moon Overview
$31,244
PER CAPITA INCOME
$77,230
AVG FAMILY INCOME
$66,042
AVG HOUSEHOLD INCOME
20.8%
WAGE / INCOME GAP [ % ]
79.2¢/ $1
WAGE / INCOME GAP [ $ ]
0.41
INEQUALITY / GINI INDEX
8,381
TOTAL POPULATION
4,375
MALE POPULATION
4,006
FEMALE POPULATION
109.21
MALES / 100 FEMALES
91.57
FEMALES / 100 MALES
27.3
MEDIAN AGE
3.2
AVG FAMILY SIZE
2.8
AVG HOUSEHOLD SIZE
4,156
LABOR FORCE [ PEOPLE ]
67.6%
PERCENT IN LABOR FORCE
5.7%
UNEMPLOYMENT RATE
Income in Half Moon
Income Overview in Half Moon
Per Capita Income in Half Moon is $31,244, while median incomes of families and households are $77,230 and $66,042 respectively.
| Characteristic | Number | Measure |
| Per Capita Income | 8,381 | $31,244 |
| Median Family Income | 2,317 | $77,230 |
| Mean Family Income | 2,317 | $90,558 |
| Median Household Income | 2,965 | $66,042 |
| Mean Household Income | 2,965 | $84,112 |
| Income Deficit | 2,317 | $0 |
| Wage / Income Gap (%) | 8,381 | 20.81% |
| Wage / Income Gap ($) | 8,381 | 79.19¢ per $1 |
| Gini / Inequality Index | 8,381 | 0.41 |
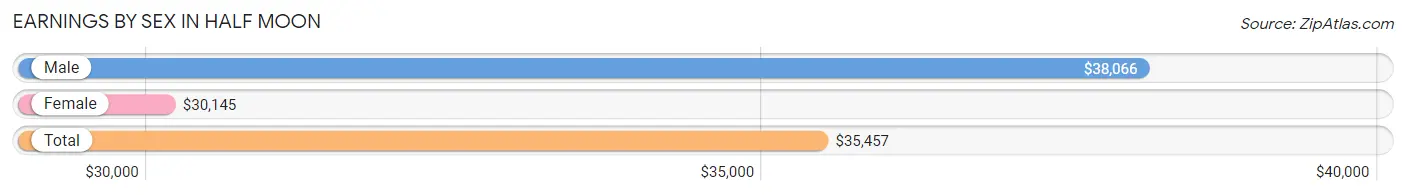
Earnings by Sex in Half Moon
Average Earnings in Half Moon are $35,457, $38,066 for men and $30,145 for women, a difference of 20.8%.
| Sex | Number | Average Earnings |
| Male | 2,483 (57.1%) | $38,066 |
| Female | 1,869 (42.9%) | $30,145 |
| Total | 4,352 (100.0%) | $35,457 |
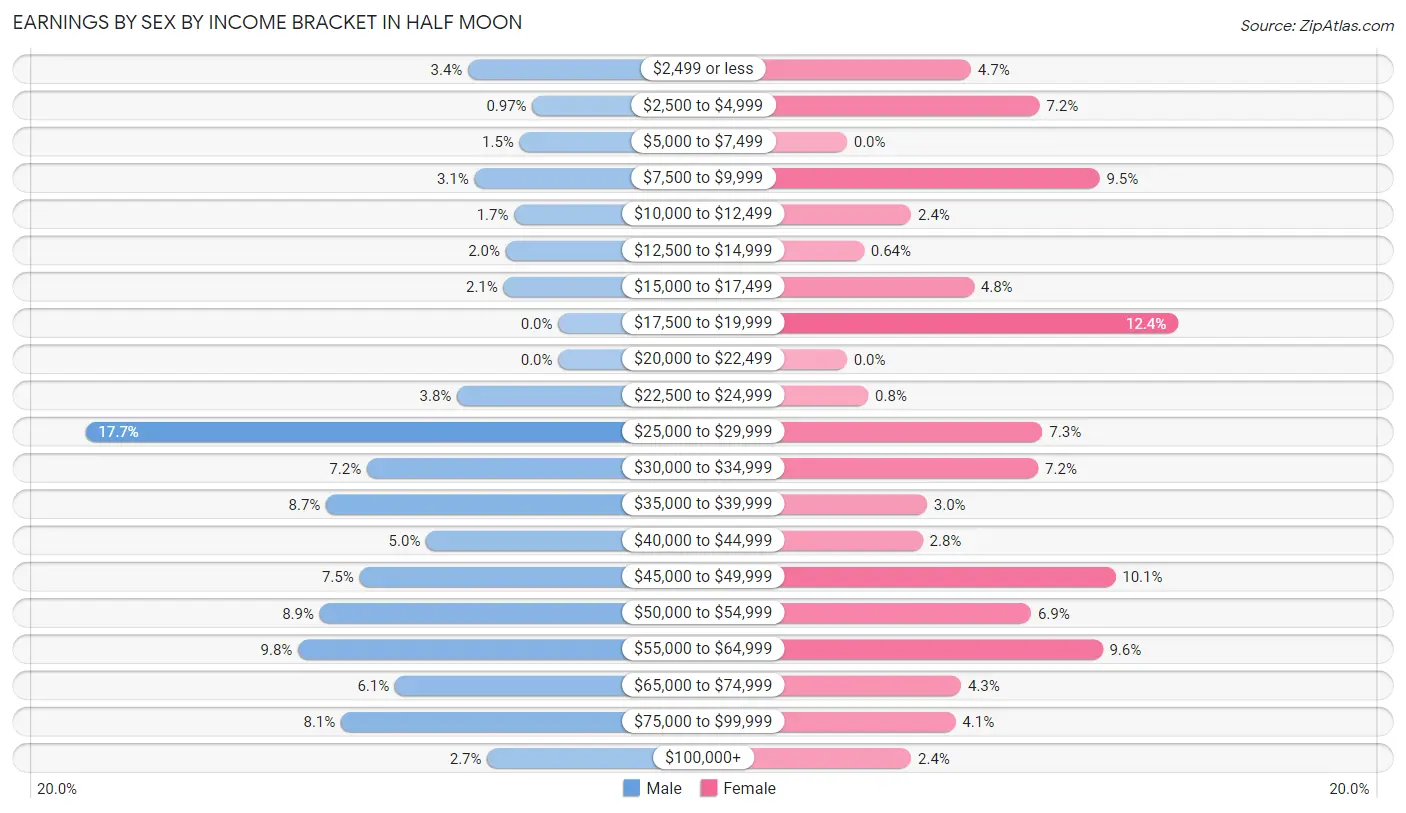
Earnings by Sex by Income Bracket in Half Moon
The most common earnings brackets in Half Moon are $25,000 to $29,999 for men (440 | 17.7%) and $17,500 to $19,999 for women (232 | 12.4%).
| Income | Male | Female |
| $2,499 or less | 84 (3.4%) | 87 (4.6%) |
| $2,500 to $4,999 | 24 (1.0%) | 135 (7.2%) |
| $5,000 to $7,499 | 36 (1.5%) | 0 (0.0%) |
| $7,500 to $9,999 | 78 (3.1%) | 177 (9.5%) |
| $10,000 to $12,499 | 41 (1.7%) | 45 (2.4%) |
| $12,500 to $14,999 | 49 (2.0%) | 12 (0.6%) |
| $15,000 to $17,499 | 51 (2.1%) | 89 (4.8%) |
| $17,500 to $19,999 | 0 (0.0%) | 232 (12.4%) |
| $20,000 to $22,499 | 0 (0.0%) | 0 (0.0%) |
| $22,500 to $24,999 | 94 (3.8%) | 15 (0.8%) |
| $25,000 to $29,999 | 440 (17.7%) | 137 (7.3%) |
| $30,000 to $34,999 | 178 (7.2%) | 134 (7.2%) |
| $35,000 to $39,999 | 216 (8.7%) | 56 (3.0%) |
| $40,000 to $44,999 | 123 (5.0%) | 53 (2.8%) |
| $45,000 to $49,999 | 185 (7.4%) | 188 (10.1%) |
| $50,000 to $54,999 | 222 (8.9%) | 129 (6.9%) |
| $55,000 to $64,999 | 242 (9.8%) | 179 (9.6%) |
| $65,000 to $74,999 | 152 (6.1%) | 80 (4.3%) |
| $75,000 to $99,999 | 202 (8.1%) | 76 (4.1%) |
| $100,000+ | 66 (2.7%) | 45 (2.4%) |
| Total | 2,483 (100.0%) | 1,869 (100.0%) |
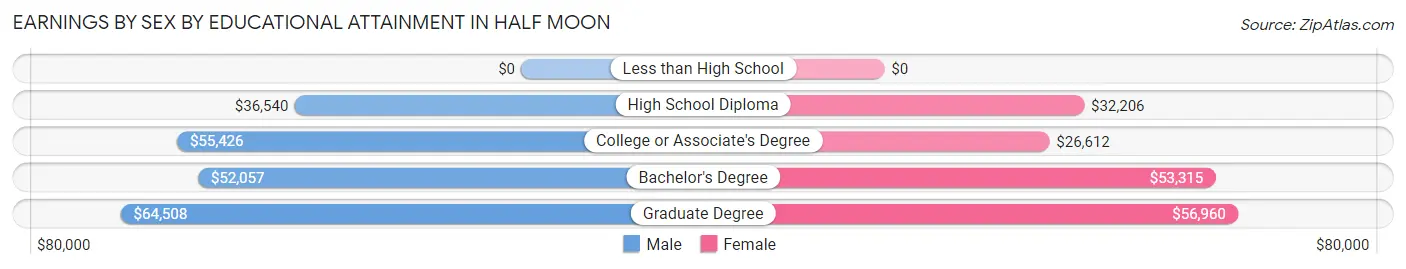
Earnings by Sex by Educational Attainment in Half Moon
Average earnings in Half Moon are $50,885 for men and $36,763 for women, a difference of 27.8%. Men with an educational attainment of graduate degree enjoy the highest average annual earnings of $64,508, while those with high school diploma education earn the least with $36,540. Women with an educational attainment of graduate degree earn the most with the average annual earnings of $56,960, while those with college or associate's degree education have the smallest earnings of $26,612.
| Educational Attainment | Male Income | Female Income |
| Less than High School | - | - |
| High School Diploma | $36,540 | $32,206 |
| College or Associate's Degree | $55,426 | $26,612 |
| Bachelor's Degree | $52,057 | $53,315 |
| Graduate Degree | $64,508 | $56,960 |
| Total | $50,885 | $36,763 |
Family Income in Half Moon
Family Income Brackets in Half Moon
According to the Half Moon family income data, there are 494 families falling into the $100,000 to $149,999 income range, which is the most common income bracket and makes up 21.3% of all families. Conversely, the $10,000 to $14,999 income bracket is the least frequent group with only 7 families (0.3%) belonging to this category.
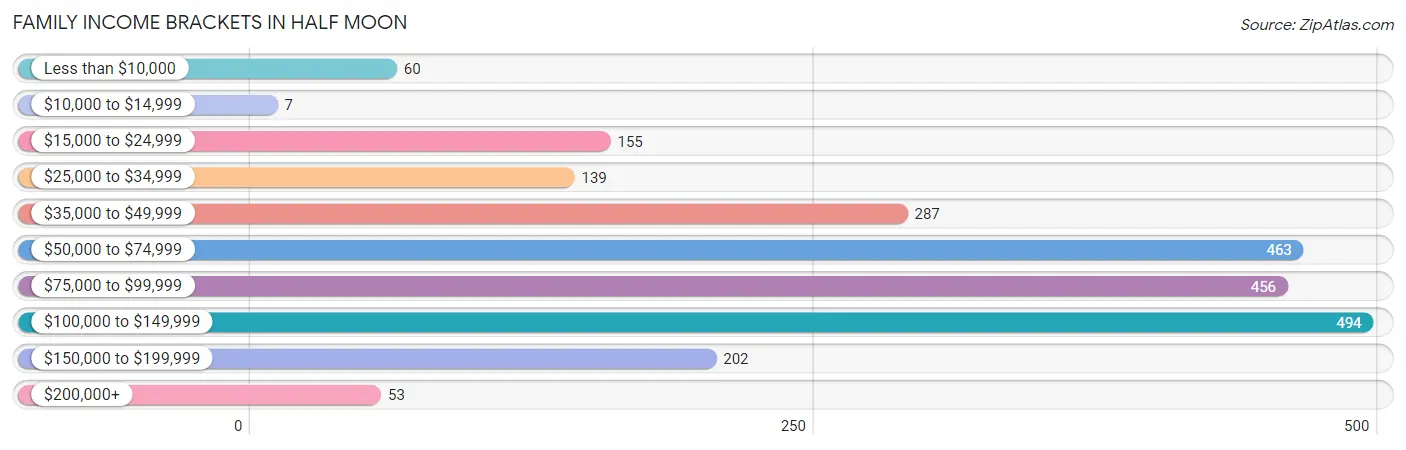
| Income Bracket | # Families | % Families |
| Less than $10,000 | 60 | 2.6% |
| $10,000 to $14,999 | 7 | 0.3% |
| $15,000 to $24,999 | 155 | 6.7% |
| $25,000 to $34,999 | 139 | 6.0% |
| $35,000 to $49,999 | 287 | 12.4% |
| $50,000 to $74,999 | 463 | 20.0% |
| $75,000 to $99,999 | 456 | 19.7% |
| $100,000 to $149,999 | 494 | 21.3% |
| $150,000 to $199,999 | 202 | 8.7% |
| $200,000+ | 53 | 2.3% |
Family Income by Famaliy Size in Half Moon
5-person families (256 | 11.1%) account for the highest median family income in Half Moon with $106,760 per family, while 2-person families (829 | 35.8%) have the highest median income of $31,524 per family member.
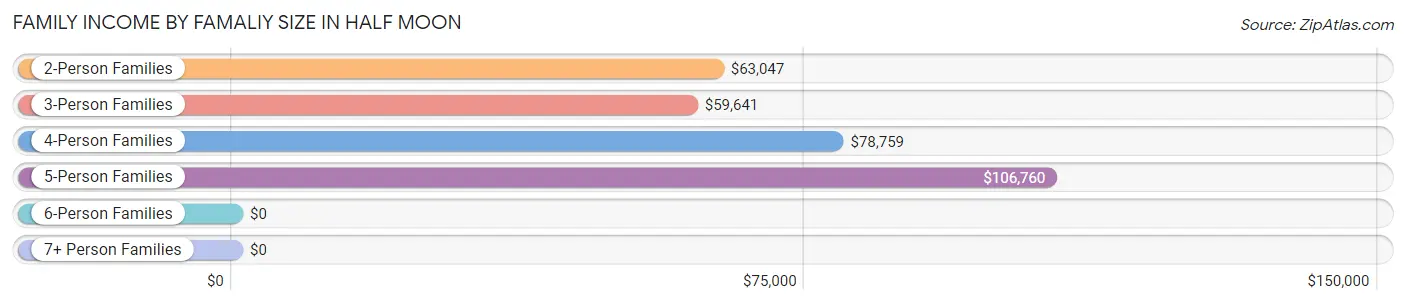
| Income Bracket | # Families | Median Income |
| 2-Person Families | 829 (35.8%) | $63,047 |
| 3-Person Families | 859 (37.1%) | $59,641 |
| 4-Person Families | 373 (16.1%) | $78,759 |
| 5-Person Families | 256 (11.1%) | $106,760 |
| 6-Person Families | 0 (0.0%) | $0 |
| 7+ Person Families | 0 (0.0%) | $0 |
| Total | 2,317 (100.0%) | $77,230 |
Family Income by Number of Earners in Half Moon
The median family income in Half Moon is $77,230, with families comprising 3+ earners (261) having the highest median family income of $79,120, while families with 1 earner (773) have the lowest median family income of $58,941, accounting for 11.3% and 33.4% of families, respectively.
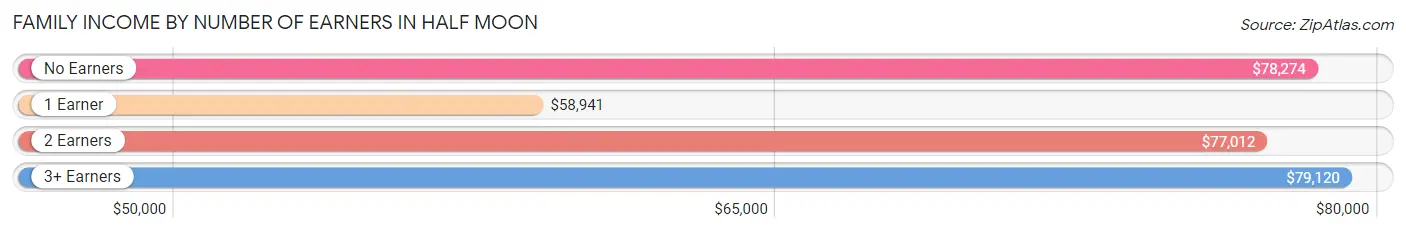
| Number of Earners | # Families | Median Income |
| No Earners | 445 (19.2%) | $78,274 |
| 1 Earner | 773 (33.4%) | $58,941 |
| 2 Earners | 838 (36.2%) | $77,012 |
| 3+ Earners | 261 (11.3%) | $79,120 |
| Total | 2,317 (100.0%) | $77,230 |
Household Income in Half Moon
Household Income Brackets in Half Moon
With 599 households falling in the category, the $100,000 to $149,999 income range is the most frequent in Half Moon, accounting for 20.2% of all households. In contrast, only 21 households (0.7%) fall into the $10,000 to $14,999 income bracket, making it the least populous group.
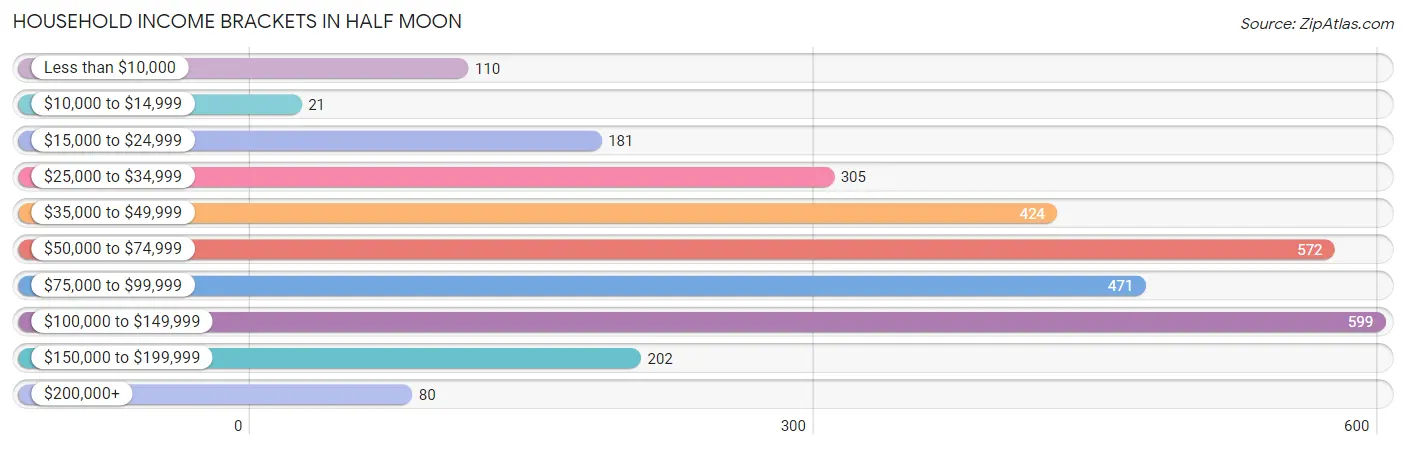
| Income Bracket | # Households | % Households |
| Less than $10,000 | 110 | 3.7% |
| $10,000 to $14,999 | 21 | 0.7% |
| $15,000 to $24,999 | 181 | 6.1% |
| $25,000 to $34,999 | 305 | 10.3% |
| $35,000 to $49,999 | 424 | 14.3% |
| $50,000 to $74,999 | 572 | 19.3% |
| $75,000 to $99,999 | 471 | 15.9% |
| $100,000 to $149,999 | 599 | 20.2% |
| $150,000 to $199,999 | 202 | 6.8% |
| $200,000+ | 80 | 2.7% |
Household Income by Householder Age in Half Moon
The median household income in Half Moon is $66,042, with the highest median household income of $94,614 found in the 45 to 64 years age bracket for the primary householder. A total of 851 households (28.7%) fall into this category. Meanwhile, the 65+ years age bracket for the primary householder has the lowest median household income of $39,125, with 505 households (17.0%) in this group.
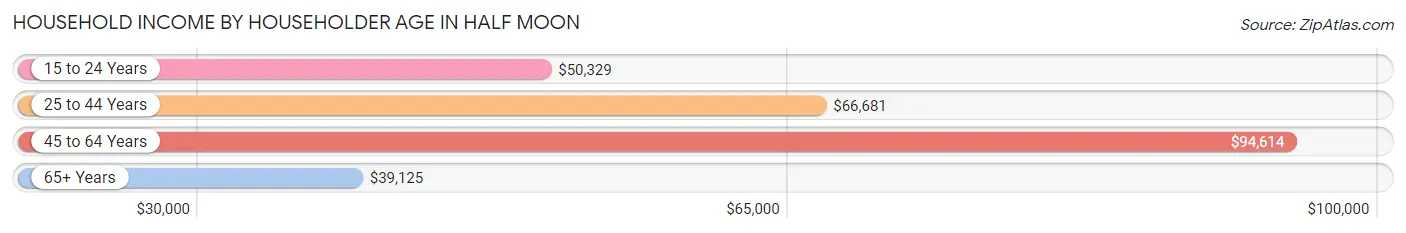
| Income Bracket | # Households | Median Income |
| 15 to 24 Years | 654 (22.1%) | $50,329 |
| 25 to 44 Years | 955 (32.2%) | $66,681 |
| 45 to 64 Years | 851 (28.7%) | $94,614 |
| 65+ Years | 505 (17.0%) | $39,125 |
| Total | 2,965 (100.0%) | $66,042 |
Poverty in Half Moon
Income Below Poverty by Sex and Age in Half Moon
With 11.0% poverty level for males and 5.2% for females among the residents of Half Moon, 16 and 17 year old males and 15 year old females are the most vulnerable to poverty, with 8 males (53.3%) and 9 females (100.0%) in their respective age groups living below the poverty level.
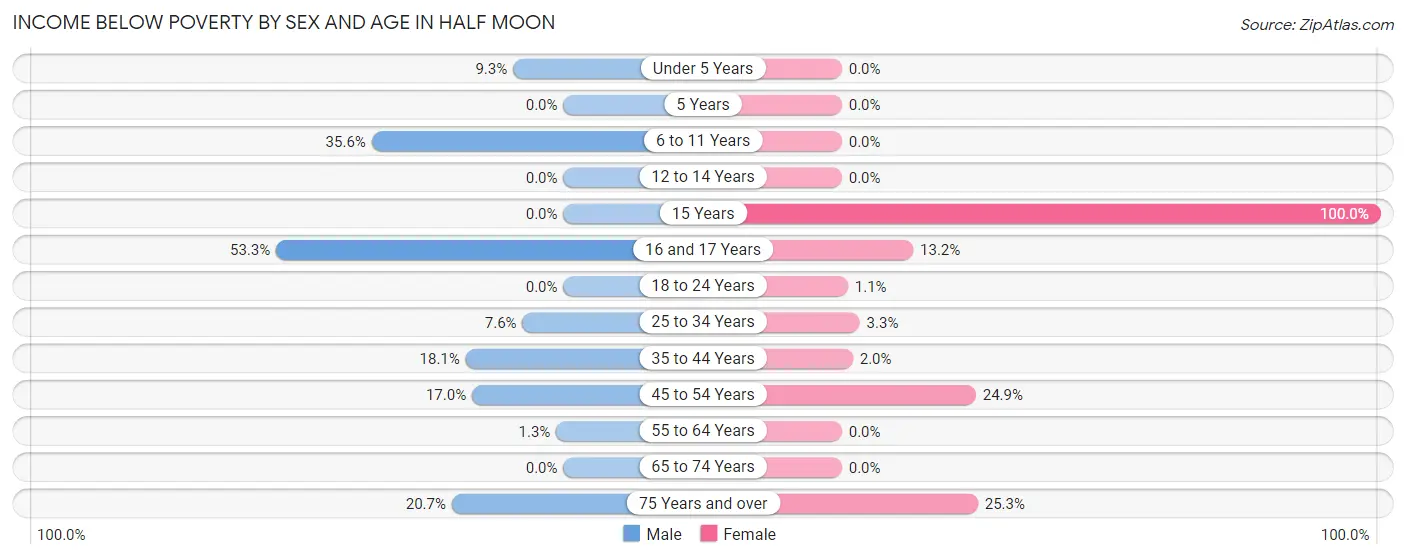
| Age Bracket | Male | Female |
| Under 5 Years | 49 (9.3%) | 0 (0.0%) |
| 5 Years | 0 (0.0%) | 0 (0.0%) |
| 6 to 11 Years | 153 (35.6%) | 0 (0.0%) |
| 12 to 14 Years | 0 (0.0%) | 0 (0.0%) |
| 15 Years | 0 (0.0%) | 9 (100.0%) |
| 16 and 17 Years | 8 (53.3%) | 9 (13.2%) |
| 18 to 24 Years | 0 (0.0%) | 8 (1.1%) |
| 25 to 34 Years | 61 (7.6%) | 14 (3.3%) |
| 35 to 44 Years | 86 (18.1%) | 8 (2.0%) |
| 45 to 54 Years | 78 (17.0%) | 108 (24.9%) |
| 55 to 64 Years | 4 (1.3%) | 0 (0.0%) |
| 65 to 74 Years | 0 (0.0%) | 0 (0.0%) |
| 75 Years and over | 41 (20.7%) | 51 (25.3%) |
| Total | 480 (11.0%) | 207 (5.2%) |
Income Above Poverty by Sex and Age in Half Moon
According to the poverty statistics in Half Moon, males aged 12 to 14 years and females aged under 5 years are the age groups that are most secure financially, with 100.0% of males and 100.0% of females in these age groups living above the poverty line.
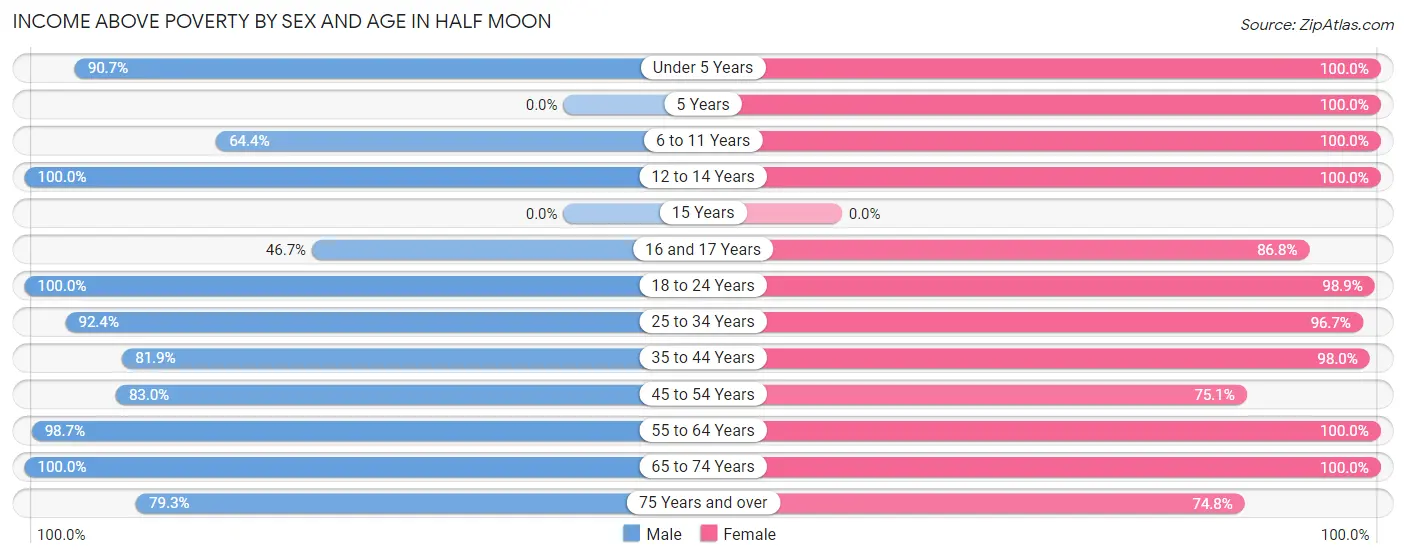
| Age Bracket | Male | Female |
| Under 5 Years | 476 (90.7%) | 794 (100.0%) |
| 5 Years | 0 (0.0%) | 17 (100.0%) |
| 6 to 11 Years | 277 (64.4%) | 213 (100.0%) |
| 12 to 14 Years | 132 (100.0%) | 52 (100.0%) |
| 15 Years | 0 (0.0%) | 0 (0.0%) |
| 16 and 17 Years | 7 (46.7%) | 59 (86.8%) |
| 18 to 24 Years | 810 (100.0%) | 708 (98.9%) |
| 25 to 34 Years | 742 (92.4%) | 408 (96.7%) |
| 35 to 44 Years | 388 (81.9%) | 385 (98.0%) |
| 45 to 54 Years | 382 (83.0%) | 326 (75.1%) |
| 55 to 64 Years | 296 (98.7%) | 284 (100.0%) |
| 65 to 74 Years | 228 (100.0%) | 341 (100.0%) |
| 75 Years and over | 157 (79.3%) | 151 (74.8%) |
| Total | 3,895 (89.0%) | 3,738 (94.8%) |
Income Below Poverty Among Married-Couple Families in Half Moon
The poverty statistics for married-couple families in Half Moon show that 6.2% or 119 of the total 1,903 families live below the poverty line. Families with 1 or 2 children have the highest poverty rate of 11.0%, comprising of 72 families. On the other hand, families with 3 or 4 children have the lowest poverty rate of 2.3%, which includes 6 families.
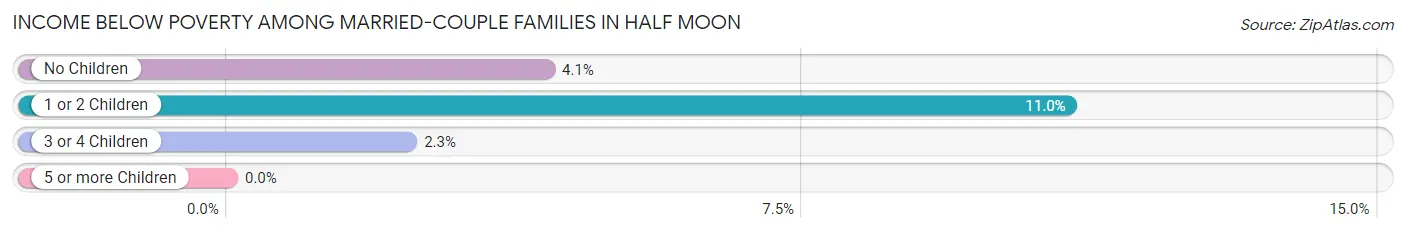
| Children | Above Poverty | Below Poverty |
| No Children | 949 (95.9%) | 41 (4.1%) |
| 1 or 2 Children | 585 (89.0%) | 72 (11.0%) |
| 3 or 4 Children | 250 (97.7%) | 6 (2.3%) |
| 5 or more Children | 0 (0.0%) | 0 (0.0%) |
| Total | 1,784 (93.8%) | 119 (6.2%) |
Income Below Poverty Among Single-Parent Households in Half Moon
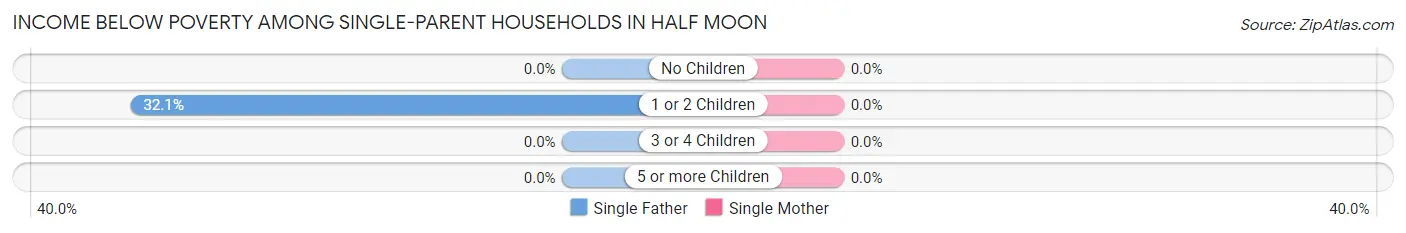
| Children | Single Father | Single Mother |
| No Children | 0 (0.0%) | 0 (0.0%) |
| 1 or 2 Children | 61 (32.1%) | 0 (0.0%) |
| 3 or 4 Children | 0 (0.0%) | 0 (0.0%) |
| 5 or more Children | 0 (0.0%) | 0 (0.0%) |
| Total | 61 (24.6%) | 0 (0.0%) |
Income Below Poverty Among Married-Couple vs Single-Parent Households in Half Moon
The poverty data for Half Moon shows that 119 of the married-couple family households (6.2%) and 61 of the single-parent households (14.7%) are living below the poverty level. Within the married-couple family households, those with 1 or 2 children have the highest poverty rate, with 72 households (11.0%) falling below the poverty line. Among the single-parent households, those with 1 or 2 children have the highest poverty rate, with 61 household (22.0%) living below poverty.
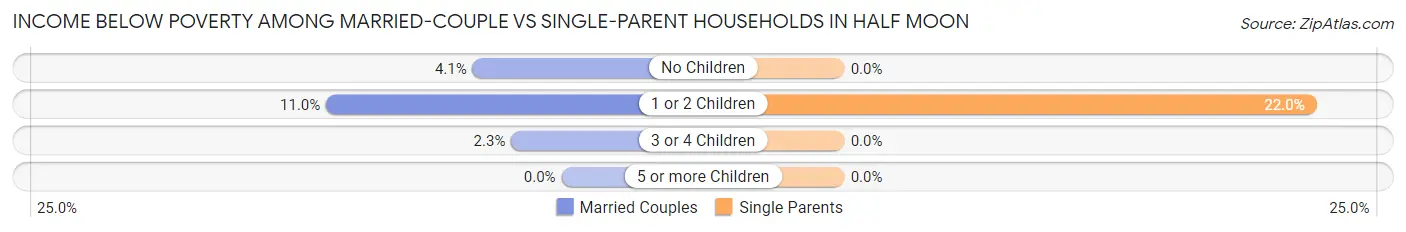
| Children | Married-Couple Families | Single-Parent Households |
| No Children | 41 (4.1%) | 0 (0.0%) |
| 1 or 2 Children | 72 (11.0%) | 61 (22.0%) |
| 3 or 4 Children | 6 (2.3%) | 0 (0.0%) |
| 5 or more Children | 0 (0.0%) | 0 (0.0%) |
| Total | 119 (6.2%) | 61 (14.7%) |
Race in Half Moon
The most populous races in Half Moon are White / Caucasian (5,791 | 69.1%), Black / African American (1,501 | 17.9%), and Hispanic or Latino (882 | 10.5%).
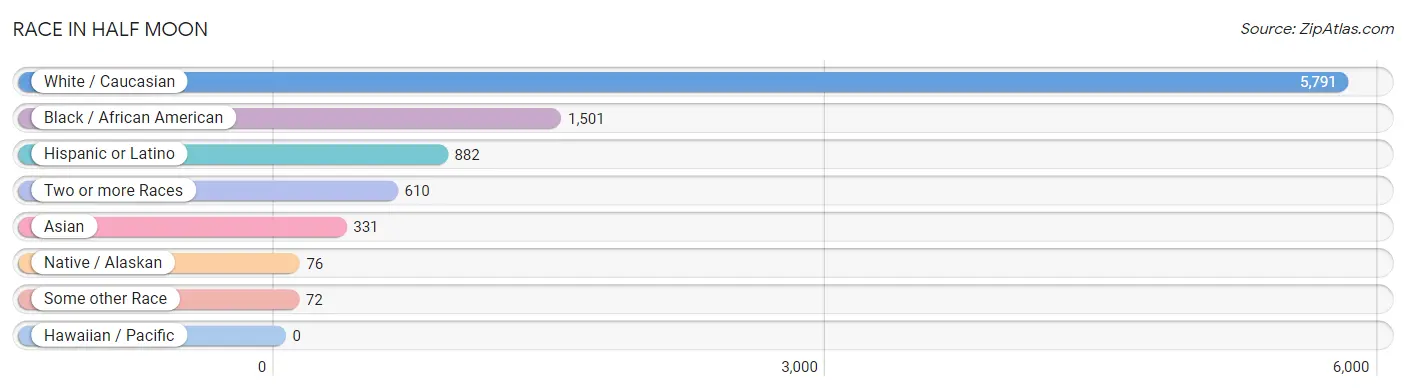
| Race | # Population | % Population |
| Asian | 331 | 4.0% |
| Black / African American | 1,501 | 17.9% |
| Hawaiian / Pacific | 0 | 0.0% |
| Hispanic or Latino | 882 | 10.5% |
| Native / Alaskan | 76 | 0.9% |
| White / Caucasian | 5,791 | 69.1% |
| Two or more Races | 610 | 7.3% |
| Some other Race | 72 | 0.9% |
| Total | 8,381 | 100.0% |
Ancestry in Half Moon
The most populous ancestries reported in Half Moon are Irish (1,104 | 13.2%), American (960 | 11.5%), Puerto Rican (696 | 8.3%), German (650 | 7.8%), and Italian (614 | 7.3%), together accounting for 48.0% of all Half Moon residents.
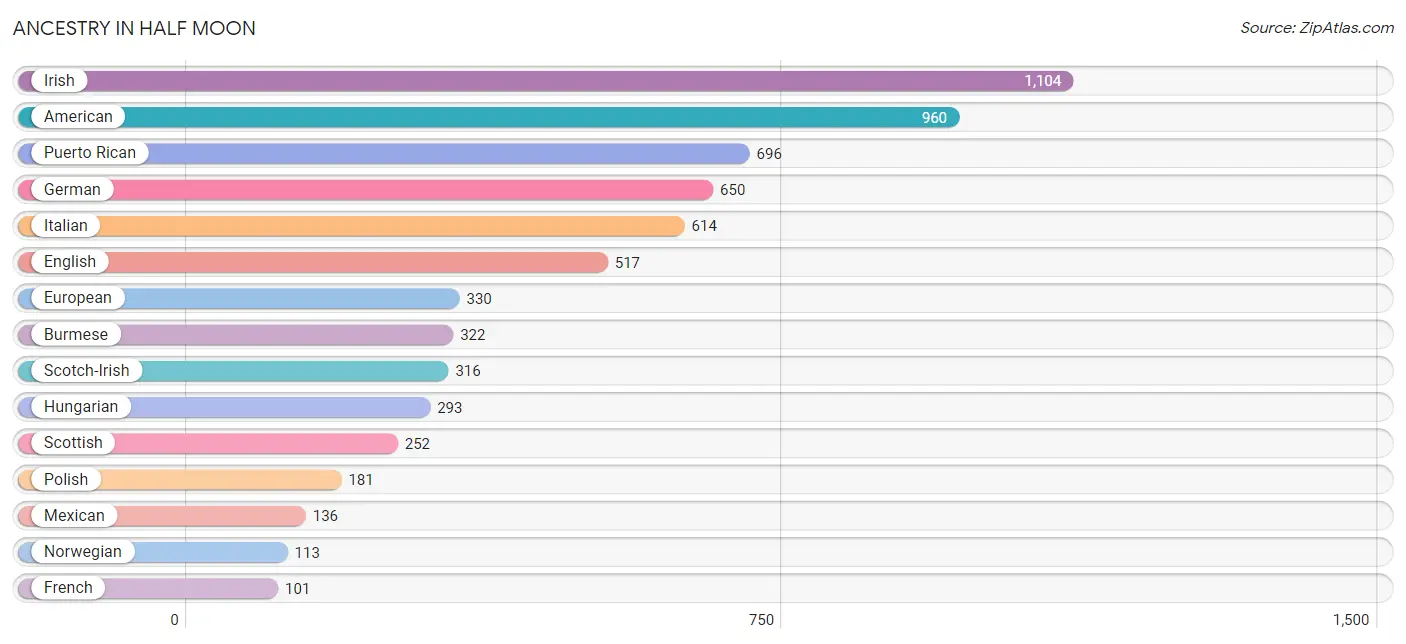
| Ancestry | # Population | % Population |
| American | 960 | 11.5% |
| Bangladeshi | 53 | 0.6% |
| Bhutanese | 81 | 1.0% |
| British | 73 | 0.9% |
| Burmese | 322 | 3.8% |
| Cape Verdean | 22 | 0.3% |
| Croatian | 23 | 0.3% |
| Czech | 45 | 0.5% |
| English | 517 | 6.2% |
| European | 330 | 3.9% |
| French | 101 | 1.2% |
| French Canadian | 26 | 0.3% |
| German | 650 | 7.8% |
| Greek | 12 | 0.1% |
| Hungarian | 293 | 3.5% |
| Irish | 1,104 | 13.2% |
| Italian | 614 | 7.3% |
| Korean | 84 | 1.0% |
| Mexican | 136 | 1.6% |
| Norwegian | 113 | 1.3% |
| Polish | 181 | 2.2% |
| Portuguese | 31 | 0.4% |
| Puerto Rican | 696 | 8.3% |
| Russian | 37 | 0.4% |
| Scotch-Irish | 316 | 3.8% |
| Scottish | 252 | 3.0% |
| Slovak | 40 | 0.5% |
| South American | 27 | 0.3% |
| Sri Lankan | 1 | 0.0% |
| Subsaharan African | 22 | 0.3% |
| Swedish | 33 | 0.4% |
| Turkish | 8 | 0.1% |
| Ukrainian | 14 | 0.2% |
| Venezuelan | 27 | 0.3% | View All 34 Rows |
Immigrants in Half Moon
The most numerous immigrant groups reported in Half Moon came from Asia (267 | 3.2%), Eastern Asia (193 | 2.3%), Korea (146 | 1.7%), South Eastern Asia (74 | 0.9%), and Philippines (73 | 0.9%), together accounting for 9.0% of all Half Moon residents.
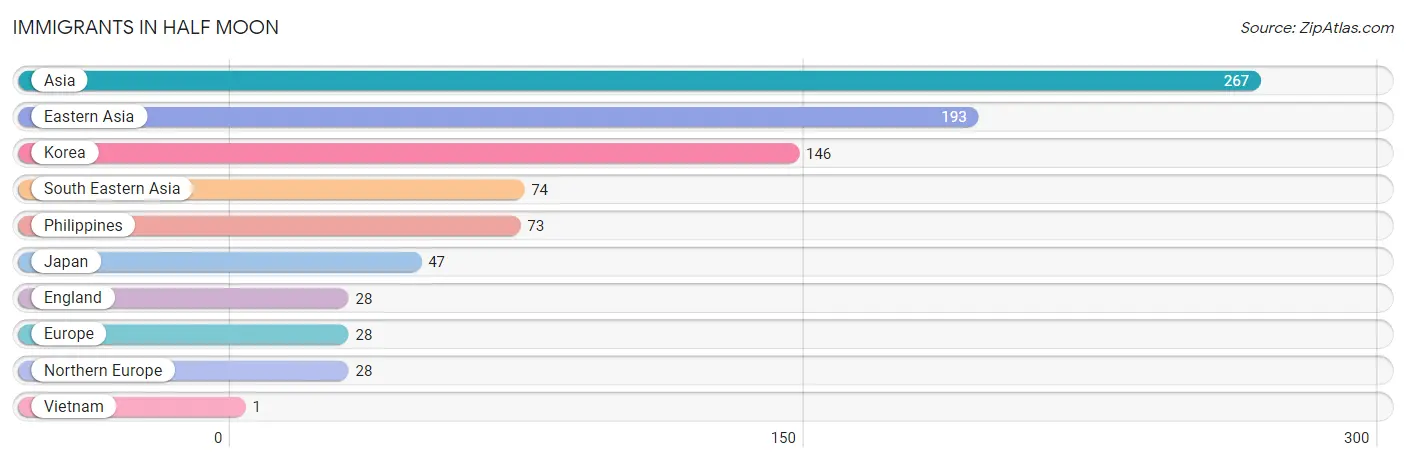
| Immigration Origin | # Population | % Population |
| Asia | 267 | 3.2% |
| Eastern Asia | 193 | 2.3% |
| England | 28 | 0.3% |
| Europe | 28 | 0.3% |
| Japan | 47 | 0.6% |
| Korea | 146 | 1.7% |
| Northern Europe | 28 | 0.3% |
| Philippines | 73 | 0.9% |
| South Eastern Asia | 74 | 0.9% |
| Vietnam | 1 | 0.0% | View All 10 Rows |
Sex and Age in Half Moon
Sex and Age in Half Moon
The most populous age groups in Half Moon are 20 to 24 Years (810 | 18.5%) for men and Under 5 Years (794 | 19.8%) for women.
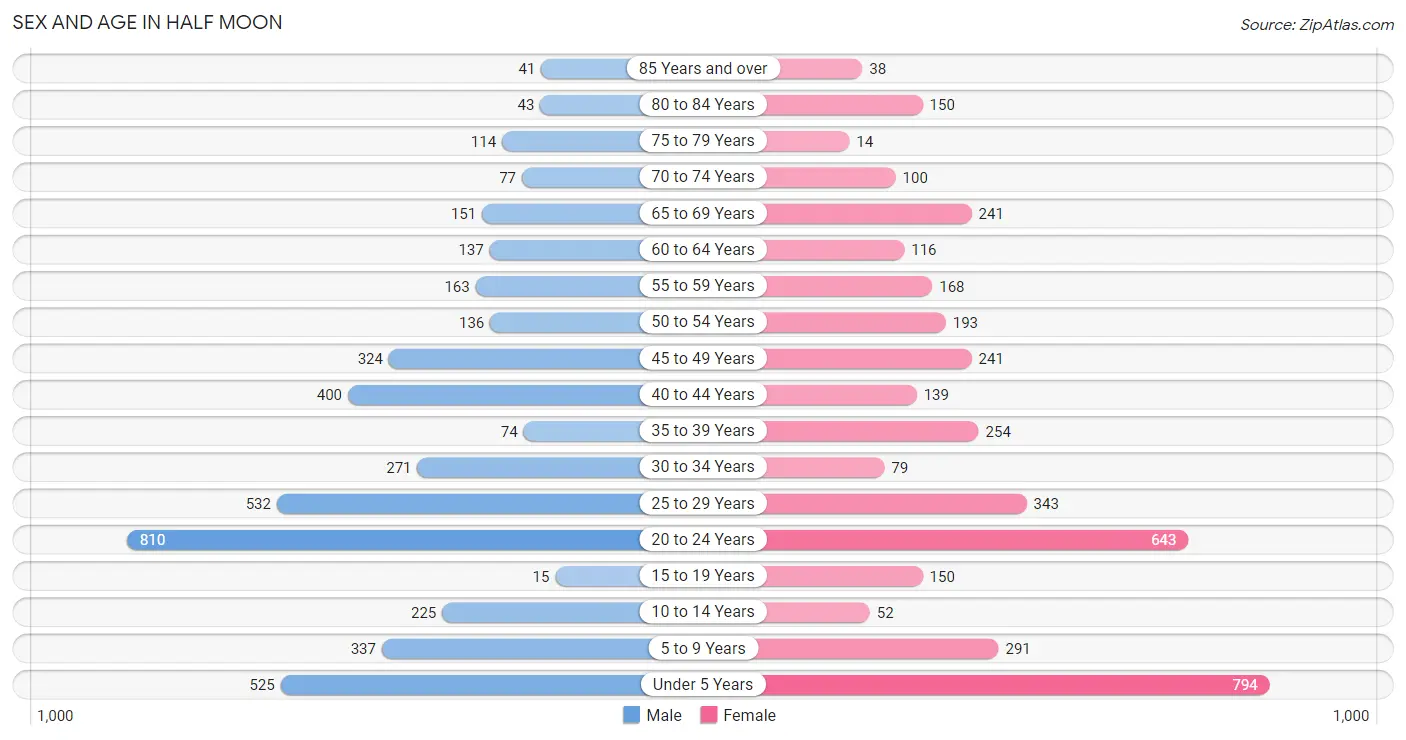
| Age Bracket | Male | Female |
| Under 5 Years | 525 (12.0%) | 794 (19.8%) |
| 5 to 9 Years | 337 (7.7%) | 291 (7.3%) |
| 10 to 14 Years | 225 (5.1%) | 52 (1.3%) |
| 15 to 19 Years | 15 (0.3%) | 150 (3.7%) |
| 20 to 24 Years | 810 (18.5%) | 643 (16.1%) |
| 25 to 29 Years | 532 (12.2%) | 343 (8.6%) |
| 30 to 34 Years | 271 (6.2%) | 79 (2.0%) |
| 35 to 39 Years | 74 (1.7%) | 254 (6.3%) |
| 40 to 44 Years | 400 (9.1%) | 139 (3.5%) |
| 45 to 49 Years | 324 (7.4%) | 241 (6.0%) |
| 50 to 54 Years | 136 (3.1%) | 193 (4.8%) |
| 55 to 59 Years | 163 (3.7%) | 168 (4.2%) |
| 60 to 64 Years | 137 (3.1%) | 116 (2.9%) |
| 65 to 69 Years | 151 (3.5%) | 241 (6.0%) |
| 70 to 74 Years | 77 (1.8%) | 100 (2.5%) |
| 75 to 79 Years | 114 (2.6%) | 14 (0.4%) |
| 80 to 84 Years | 43 (1.0%) | 150 (3.7%) |
| 85 Years and over | 41 (0.9%) | 38 (0.9%) |
| Total | 4,375 (100.0%) | 4,006 (100.0%) |
Families and Households in Half Moon
Median Family Size in Half Moon
The median family size in Half Moon is 3.16 persons per family, with single female/mother families (166 | 7.2%) accounting for the largest median family size of 3.8 persons per family. On the other hand, single male/father families (248 | 10.7%) represent the smallest median family size with 2.36 persons per family.
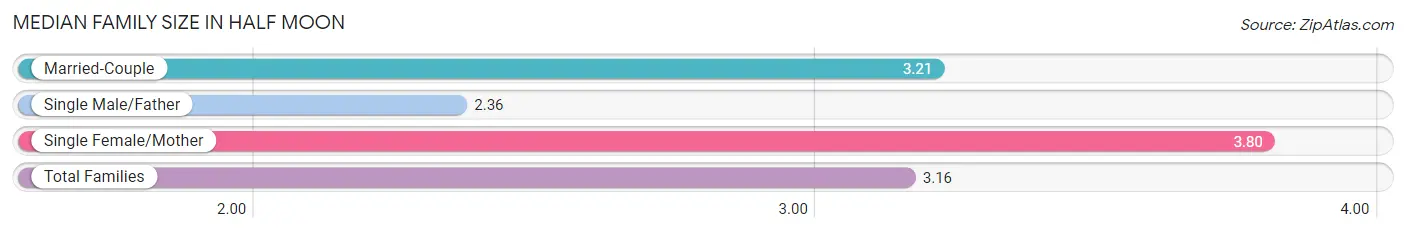
| Family Type | # Families | Family Size |
| Married-Couple | 1,903 (82.1%) | 3.21 |
| Single Male/Father | 248 (10.7%) | 2.36 |
| Single Female/Mother | 166 (7.2%) | 3.80 |
| Total Families | 2,317 (100.0%) | 3.16 |
Median Household Size in Half Moon
The median household size in Half Moon is 2.82 persons per household, with single female/mother households (166 | 5.6%) accounting for the largest median household size of 4.45 persons per household. non-family households (648 | 21.8%) represent the smallest median household size with 1.45 persons per household.
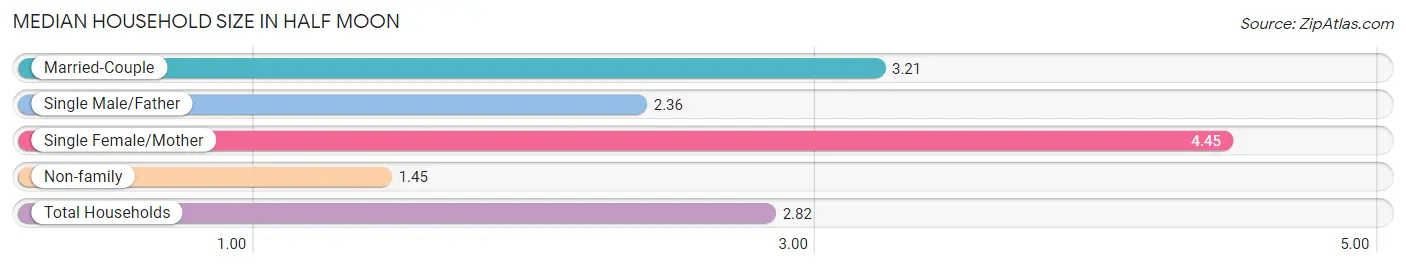
| Household Type | # Households | Household Size |
| Married-Couple | 1,903 (64.2%) | 3.21 |
| Single Male/Father | 248 (8.4%) | 2.36 |
| Single Female/Mother | 166 (5.6%) | 4.45 |
| Non-family | 648 (21.8%) | 1.45 |
| Total Households | 2,965 (100.0%) | 2.82 |
Household Size by Marriage Status in Half Moon
Out of a total of 2,965 households in Half Moon, 2,317 (78.1%) are family households, while 648 (21.8%) are nonfamily households. The most numerous type of family households are 3-person households, comprising 890, and the most common type of nonfamily households are 1-person households, comprising 569.
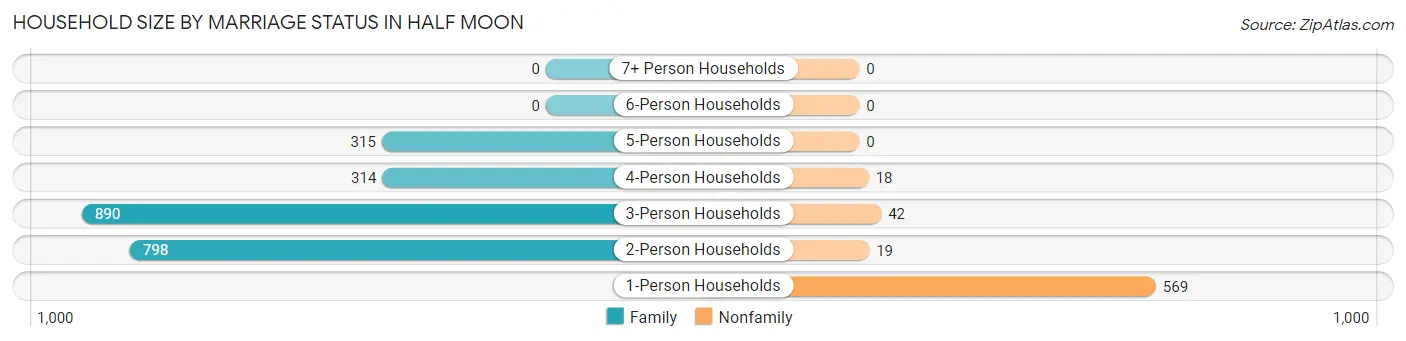
| Household Size | Family Households | Nonfamily Households |
| 1-Person Households | - | 569 (19.2%) |
| 2-Person Households | 798 (26.9%) | 19 (0.6%) |
| 3-Person Households | 890 (30.0%) | 42 (1.4%) |
| 4-Person Households | 314 (10.6%) | 18 (0.6%) |
| 5-Person Households | 315 (10.6%) | 0 (0.0%) |
| 6-Person Households | 0 (0.0%) | 0 (0.0%) |
| 7+ Person Households | 0 (0.0%) | 0 (0.0%) |
| Total | 2,317 (78.1%) | 648 (21.8%) |
Female Fertility in Half Moon
Fertility by Age in Half Moon
Average fertility rate in Half Moon is 183.0 births per 1,000 women. Women in the age bracket of 20 to 34 years have the highest fertility rate with 323.0 births per 1,000 women. Women in the age bracket of 20 to 34 years acount for 100.0% of all women with births.
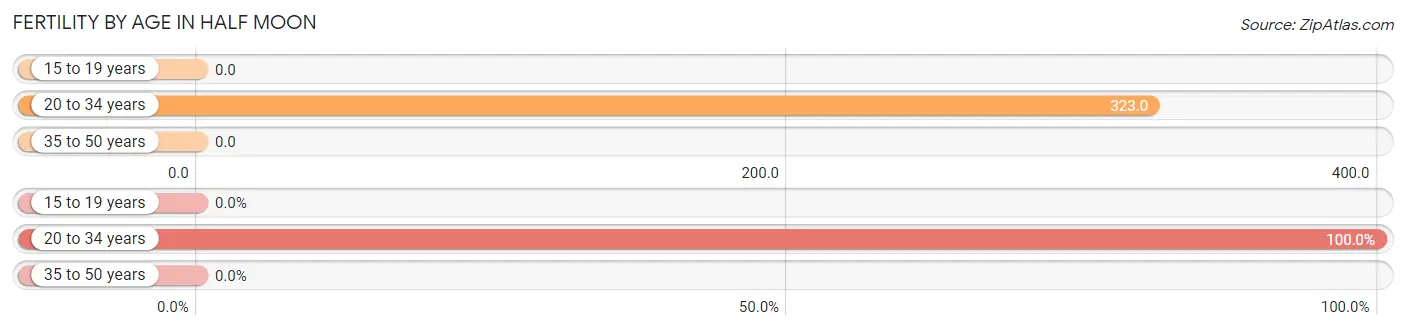
| Age Bracket | Women with Births | Births / 1,000 Women |
| 15 to 19 years | 0 (0.0%) | 0.0 |
| 20 to 34 years | 344 (100.0%) | 323.0 |
| 35 to 50 years | 0 (0.0%) | 0.0 |
| Total | 344 (100.0%) | 183.0 |
Fertility by Age by Marriage Status in Half Moon
90.7% of women with births (344) in Half Moon are married. The highest percentage of unmarried women with births falls into 20 to 34 years age bracket with 9.3% of them unmarried at the time of birth, while the lowest percentage of unmarried women with births belong to 20 to 34 years age bracket with 9.3% of them unmarried.
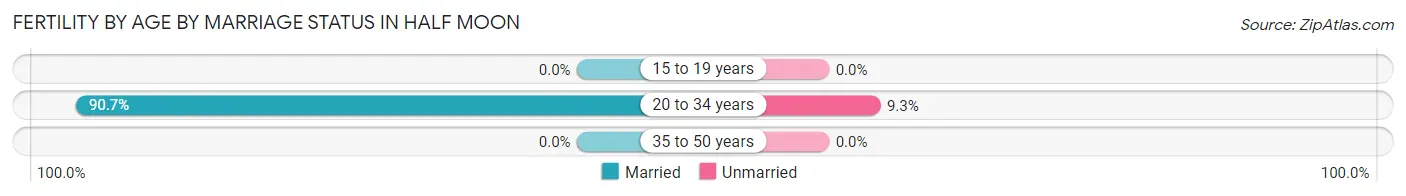
| Age Bracket | Married | Unmarried |
| 15 to 19 years | 0 (0.0%) | 0 (0.0%) |
| 20 to 34 years | 312 (90.7%) | 32 (9.3%) |
| 35 to 50 years | 0 (0.0%) | 0 (0.0%) |
| Total | 312 (90.7%) | 32 (9.3%) |
Fertility by Education in Half Moon
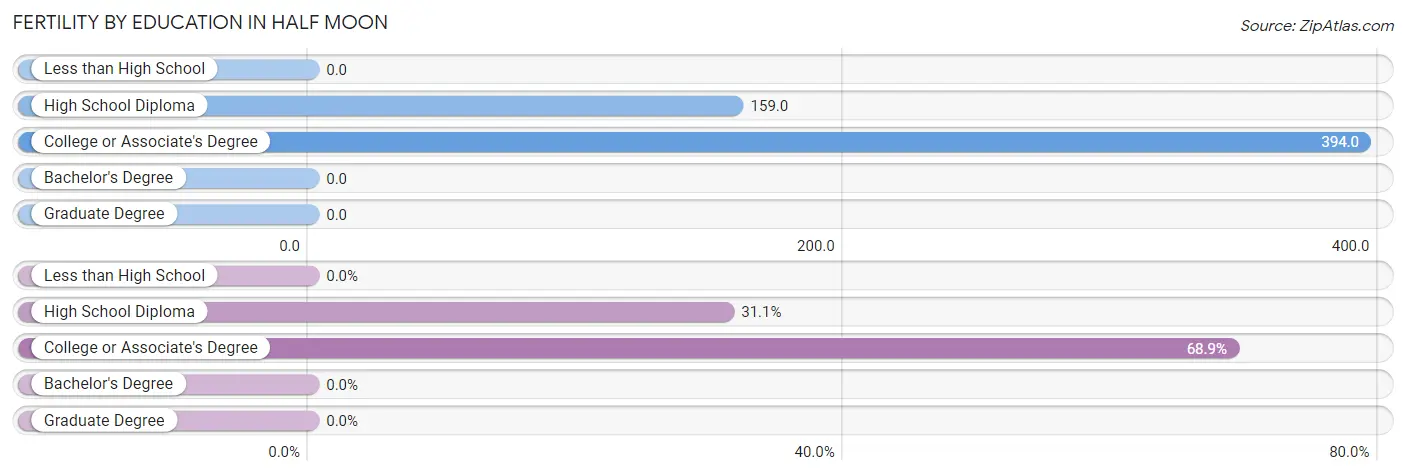
| Educational Attainment | Women with Births | Births / 1,000 Women |
| Less than High School | 0 (0.0%) | 0.0 |
| High School Diploma | 107 (31.1%) | 159.0 |
| College or Associate's Degree | 237 (68.9%) | 394.0 |
| Bachelor's Degree | 0 (0.0%) | 0.0 |
| Graduate Degree | 0 (0.0%) | 0.0 |
| Total | 344 (100.0%) | 183.0 |
Fertility by Education by Marriage Status in Half Moon
9.3% of women with births in Half Moon are unmarried. Women with the educational attainment of high school diploma are most likely to be married with 100.0% of them married at childbirth, while women with the educational attainment of college or associate's degree are least likely to be married with 13.5% of them unmarried at childbirth.
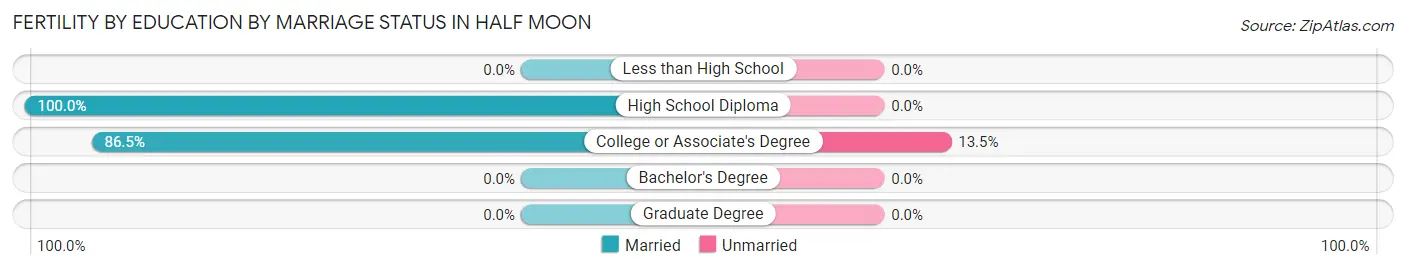
| Educational Attainment | Married | Unmarried |
| Less than High School | 0 (0.0%) | 0 (0.0%) |
| High School Diploma | 107 (100.0%) | 0 (0.0%) |
| College or Associate's Degree | 205 (86.5%) | 32 (13.5%) |
| Bachelor's Degree | 0 (0.0%) | 0 (0.0%) |
| Graduate Degree | 0 (0.0%) | 0 (0.0%) |
| Total | 312 (90.7%) | 32 (9.3%) |
Employment Characteristics in Half Moon
Employment by Class of Employer in Half Moon
Among the 3,802 employed individuals in Half Moon, private company employees (1,797 | 47.3%), federal government employees (1,184 | 31.1%), and local government employees (347 | 9.1%) make up the most common classes of employment.
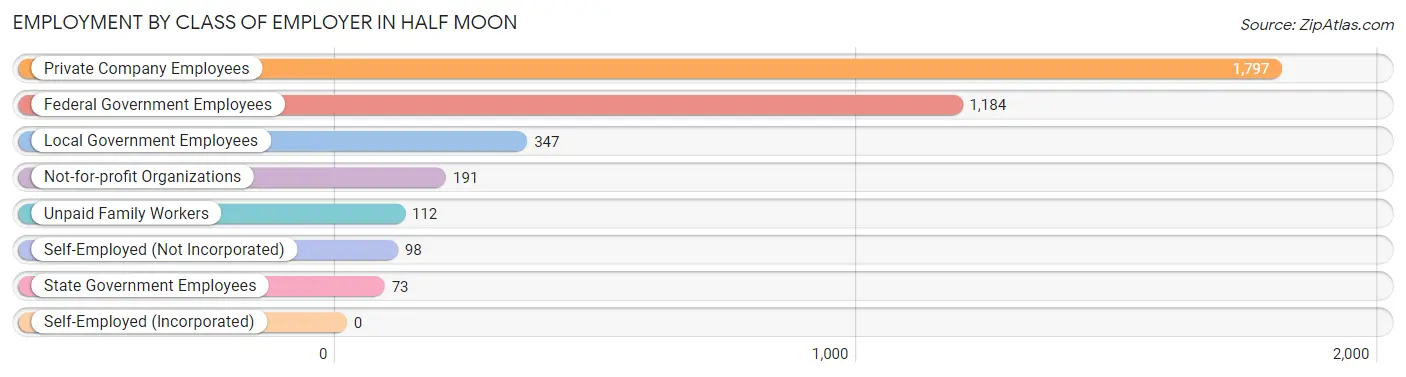
| Employer Class | # Employees | % Employees |
| Private Company Employees | 1,797 | 47.3% |
| Self-Employed (Incorporated) | 0 | 0.0% |
| Self-Employed (Not Incorporated) | 98 | 2.6% |
| Not-for-profit Organizations | 191 | 5.0% |
| Local Government Employees | 347 | 9.1% |
| State Government Employees | 73 | 1.9% |
| Federal Government Employees | 1,184 | 31.1% |
| Unpaid Family Workers | 112 | 2.9% |
| Total | 3,802 | 100.0% |
Employment Status by Age in Half Moon
According to the labor force statistics for Half Moon, out of the total population over 16 years of age (6,148), 67.6% or 4,156 individuals are in the labor force, with 5.7% or 237 of them unemployed. The age group with the highest labor force participation rate is 30 to 34 years, with 88.0% or 308 individuals in the labor force. Within the labor force, the 75 years and over age range has the highest percentage of unemployed individuals, with 43.8% or 14 of them being unemployed.
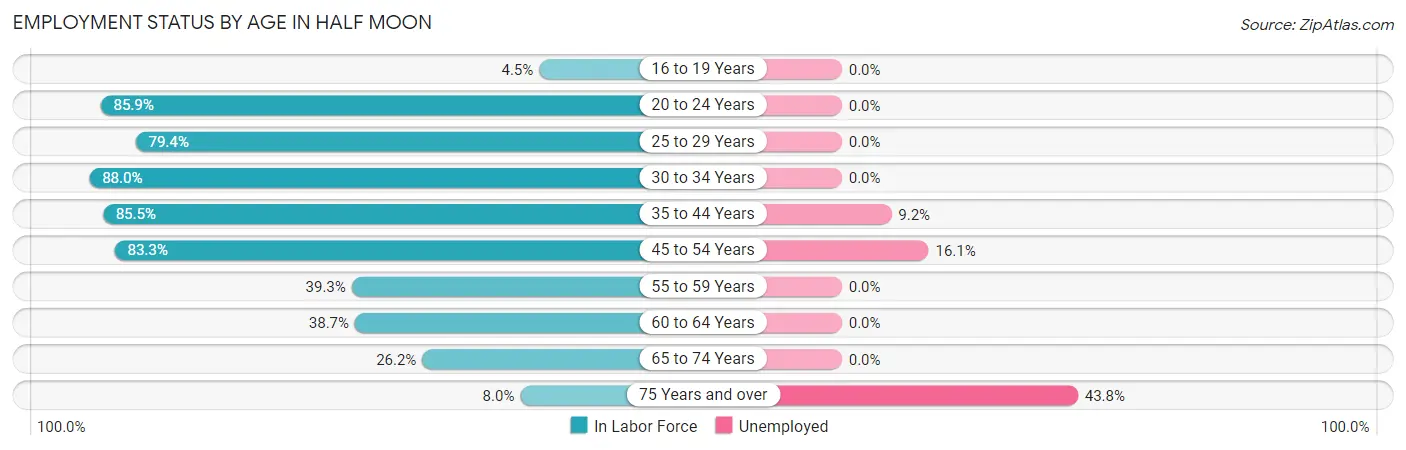
| Age Bracket | In Labor Force | Unemployed |
| 16 to 19 Years | 7 (4.5%) | 0 (0.0%) |
| 20 to 24 Years | 1,248 (85.9%) | 0 (0.0%) |
| 25 to 29 Years | 695 (79.4%) | 0 (0.0%) |
| 30 to 34 Years | 308 (88.0%) | 0 (0.0%) |
| 35 to 44 Years | 741 (85.5%) | 68 (9.2%) |
| 45 to 54 Years | 745 (83.3%) | 120 (16.1%) |
| 55 to 59 Years | 130 (39.3%) | 0 (0.0%) |
| 60 to 64 Years | 98 (38.7%) | 0 (0.0%) |
| 65 to 74 Years | 149 (26.2%) | 0 (0.0%) |
| 75 Years and over | 32 (8.0%) | 14 (43.8%) |
| Total | 4,156 (67.6%) | 237 (5.7%) |
Employment Status by Educational Attainment in Half Moon
According to labor force statistics for Half Moon, 76.1% of individuals (2,717) out of the total population between 25 and 64 years of age (3,570) are in the labor force, with 7.3% or 198 of them being unemployed. The group with the highest labor force participation rate are those with the educational attainment of college / associate degree, with 84.9% or 1,217 individuals in the labor force. Within the labor force, individuals with high school diploma education have the highest percentage of unemployment, with 23.2% or 141 of them being unemployed.
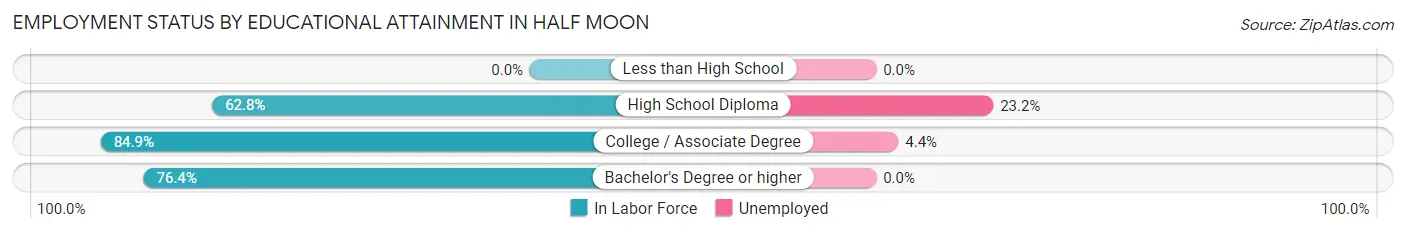
| Educational Attainment | In Labor Force | Unemployed |
| Less than High School | 0 (0.0%) | 0 (0.0%) |
| High School Diploma | 606 (62.8%) | 224 (23.2%) |
| College / Associate Degree | 1,217 (84.9%) | 63 (4.4%) |
| Bachelor's Degree or higher | 895 (76.4%) | 0 (0.0%) |
| Total | 2,717 (76.1%) | 261 (7.3%) |
Employment Occupations by Sex in Half Moon
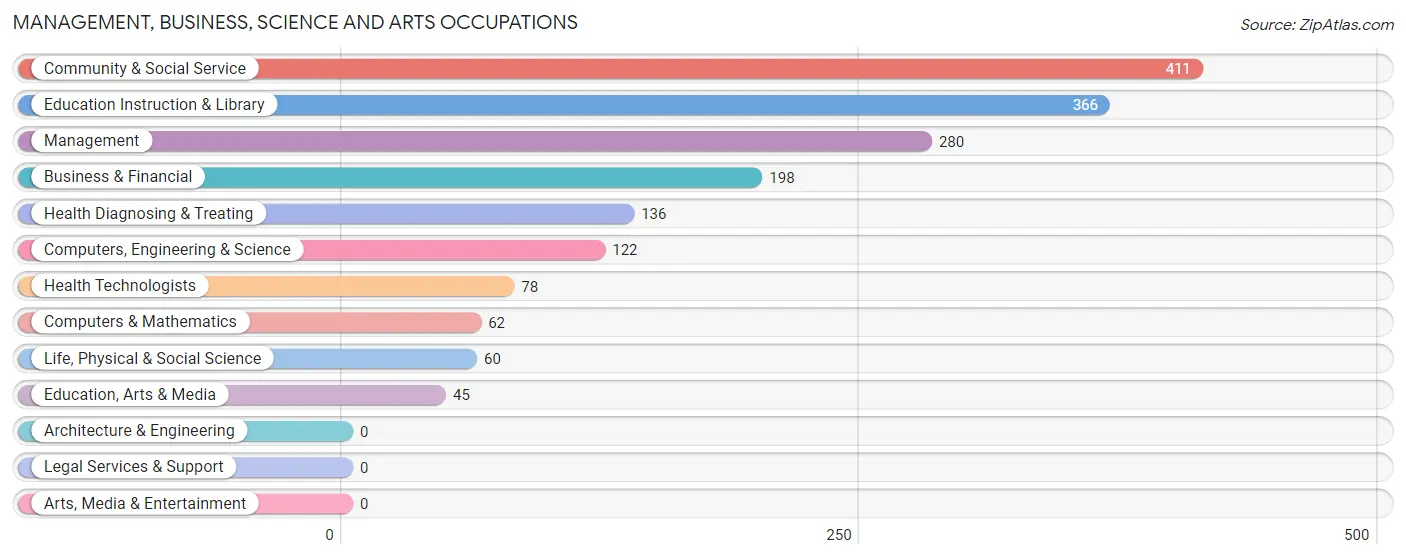
Management, Business, Science and Arts Occupations
The most common Management, Business, Science and Arts occupations in Half Moon are Community & Social Service (411 | 12.2%), Education Instruction & Library (366 | 10.9%), Management (280 | 8.3%), Business & Financial (198 | 5.9%), and Health Diagnosing & Treating (136 | 4.0%).
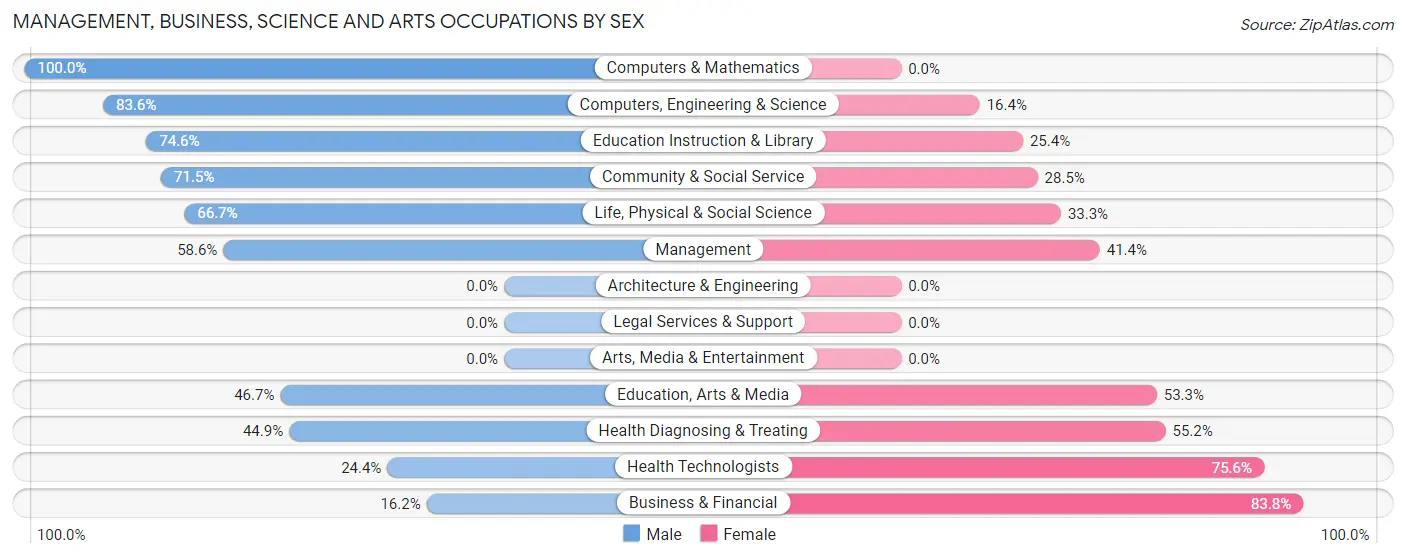
Management, Business, Science and Arts Occupations by Sex
Within the Management, Business, Science and Arts occupations in Half Moon, the most male-oriented occupations are Computers & Mathematics (100.0%), Computers, Engineering & Science (83.6%), and Education Instruction & Library (74.6%), while the most female-oriented occupations are Business & Financial (83.8%), Health Technologists (75.6%), and Health Diagnosing & Treating (55.1%).
| Occupation | Male | Female |
| Management | 164 (58.6%) | 116 (41.4%) |
| Business & Financial | 32 (16.2%) | 166 (83.8%) |
| Computers, Engineering & Science | 102 (83.6%) | 20 (16.4%) |
| Computers & Mathematics | 62 (100.0%) | 0 (0.0%) |
| Architecture & Engineering | 0 (0.0%) | 0 (0.0%) |
| Life, Physical & Social Science | 40 (66.7%) | 20 (33.3%) |
| Community & Social Service | 294 (71.5%) | 117 (28.5%) |
| Education, Arts & Media | 21 (46.7%) | 24 (53.3%) |
| Legal Services & Support | 0 (0.0%) | 0 (0.0%) |
| Education Instruction & Library | 273 (74.6%) | 93 (25.4%) |
| Arts, Media & Entertainment | 0 (0.0%) | 0 (0.0%) |
| Health Diagnosing & Treating | 61 (44.9%) | 75 (55.1%) |
| Health Technologists | 19 (24.4%) | 59 (75.6%) |
| Total (Category) | 653 (56.9%) | 494 (43.1%) |
| Total (Overall) | 1,926 (57.2%) | 1,440 (42.8%) |
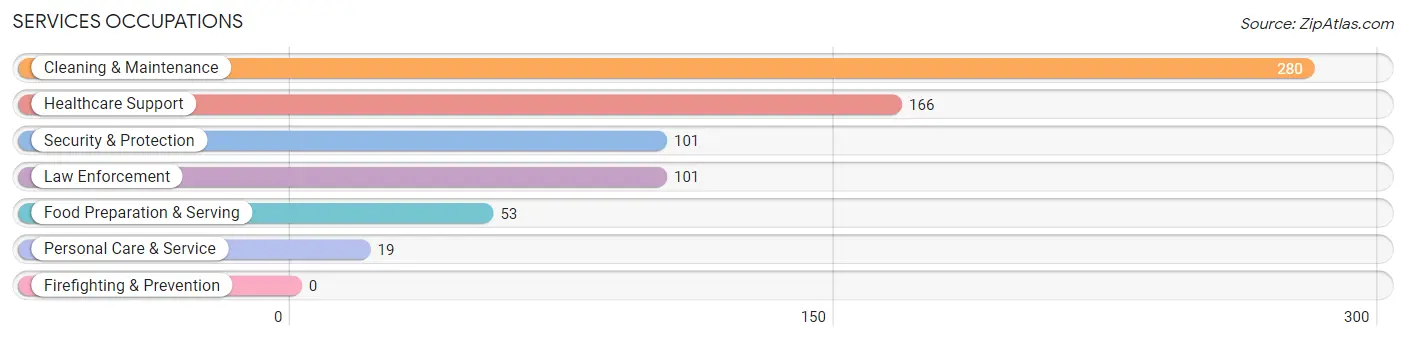
Services Occupations
The most common Services occupations in Half Moon are Cleaning & Maintenance (280 | 8.3%), Healthcare Support (166 | 4.9%), Security & Protection (101 | 3.0%), Law Enforcement (101 | 3.0%), and Food Preparation & Serving (53 | 1.6%).
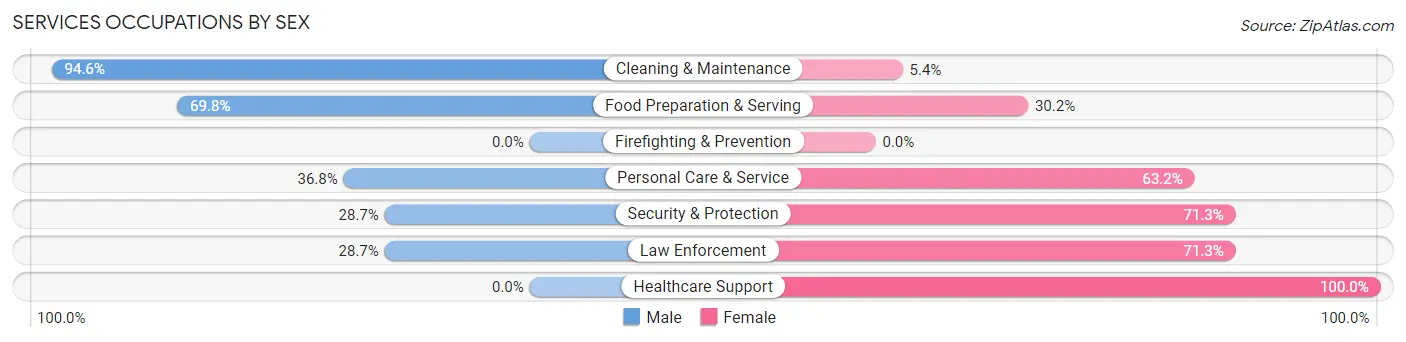
Services Occupations by Sex
Within the Services occupations in Half Moon, the most male-oriented occupations are Cleaning & Maintenance (94.6%), Food Preparation & Serving (69.8%), and Personal Care & Service (36.8%), while the most female-oriented occupations are Healthcare Support (100.0%), Security & Protection (71.3%), and Law Enforcement (71.3%).
| Occupation | Male | Female |
| Healthcare Support | 0 (0.0%) | 166 (100.0%) |
| Security & Protection | 29 (28.7%) | 72 (71.3%) |
| Firefighting & Prevention | 0 (0.0%) | 0 (0.0%) |
| Law Enforcement | 29 (28.7%) | 72 (71.3%) |
| Food Preparation & Serving | 37 (69.8%) | 16 (30.2%) |
| Cleaning & Maintenance | 265 (94.6%) | 15 (5.4%) |
| Personal Care & Service | 7 (36.8%) | 12 (63.2%) |
| Total (Category) | 338 (54.6%) | 281 (45.4%) |
| Total (Overall) | 1,926 (57.2%) | 1,440 (42.8%) |
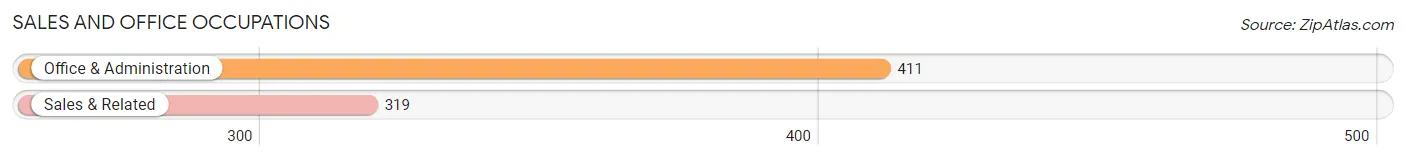
Sales and Office Occupations
The most common Sales and Office occupations in Half Moon are Office & Administration (411 | 12.2%), and Sales & Related (319 | 9.5%).
Sales and Office Occupations by Sex
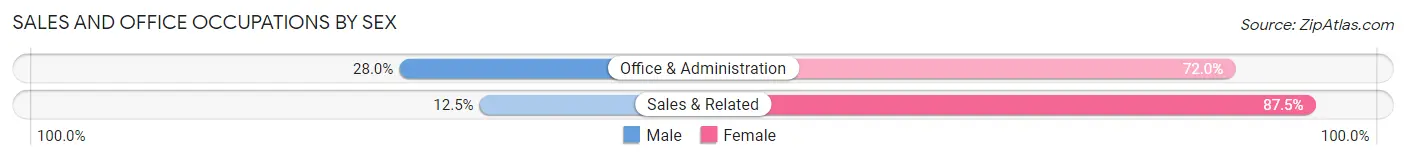
| Occupation | Male | Female |
| Sales & Related | 40 (12.5%) | 279 (87.5%) |
| Office & Administration | 115 (28.0%) | 296 (72.0%) |
| Total (Category) | 155 (21.2%) | 575 (78.8%) |
| Total (Overall) | 1,926 (57.2%) | 1,440 (42.8%) |
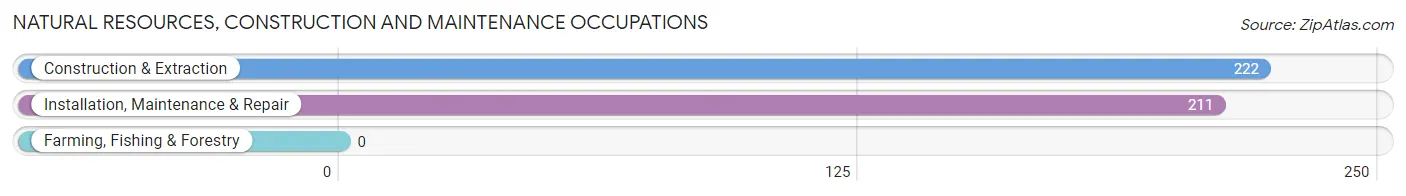
Natural Resources, Construction and Maintenance Occupations
The most common Natural Resources, Construction and Maintenance occupations in Half Moon are Construction & Extraction (222 | 6.6%), and Installation, Maintenance & Repair (211 | 6.3%).
Natural Resources, Construction and Maintenance Occupations by Sex
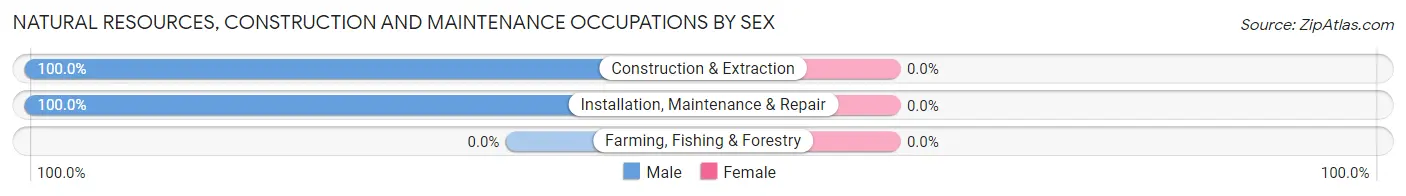
| Occupation | Male | Female |
| Farming, Fishing & Forestry | 0 (0.0%) | 0 (0.0%) |
| Construction & Extraction | 222 (100.0%) | 0 (0.0%) |
| Installation, Maintenance & Repair | 211 (100.0%) | 0 (0.0%) |
| Total (Category) | 433 (100.0%) | 0 (0.0%) |
| Total (Overall) | 1,926 (57.2%) | 1,440 (42.8%) |
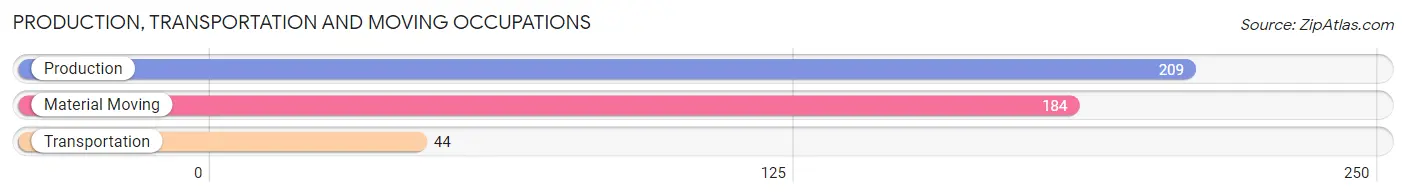
Production, Transportation and Moving Occupations
The most common Production, Transportation and Moving occupations in Half Moon are Production (209 | 6.2%), Material Moving (184 | 5.5%), and Transportation (44 | 1.3%).
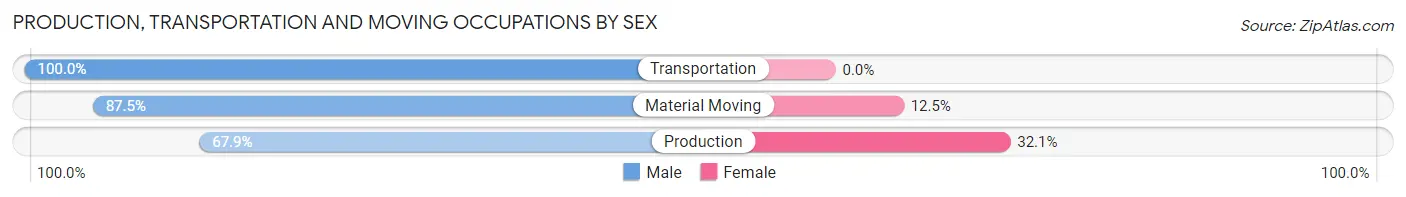
Production, Transportation and Moving Occupations by Sex
| Occupation | Male | Female |
| Production | 142 (67.9%) | 67 (32.1%) |
| Transportation | 44 (100.0%) | 0 (0.0%) |
| Material Moving | 161 (87.5%) | 23 (12.5%) |
| Total (Category) | 347 (79.4%) | 90 (20.6%) |
| Total (Overall) | 1,926 (57.2%) | 1,440 (42.8%) |
Employment Industries by Sex in Half Moon
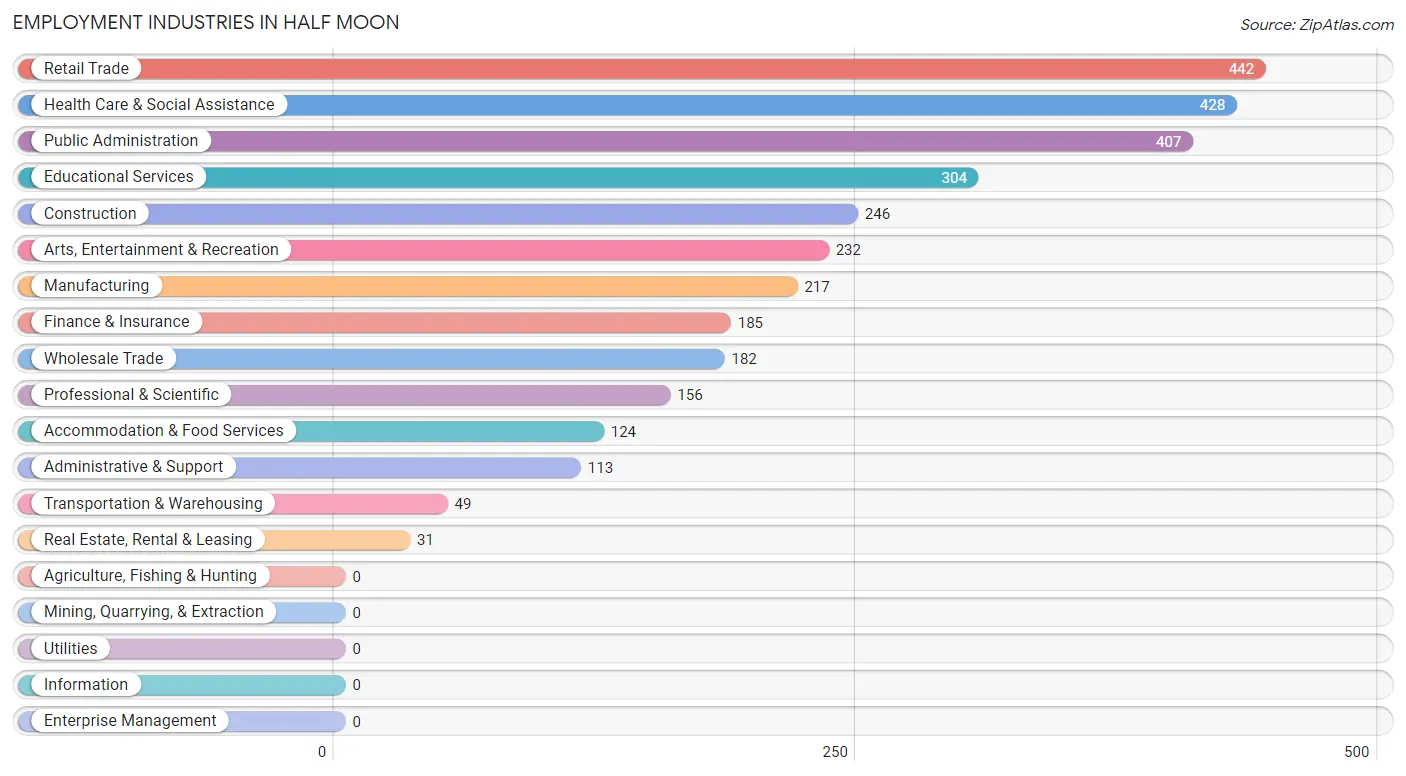
Employment Industries in Half Moon
The major employment industries in Half Moon include Retail Trade (442 | 13.1%), Health Care & Social Assistance (428 | 12.7%), Public Administration (407 | 12.1%), Educational Services (304 | 9.0%), and Construction (246 | 7.3%).
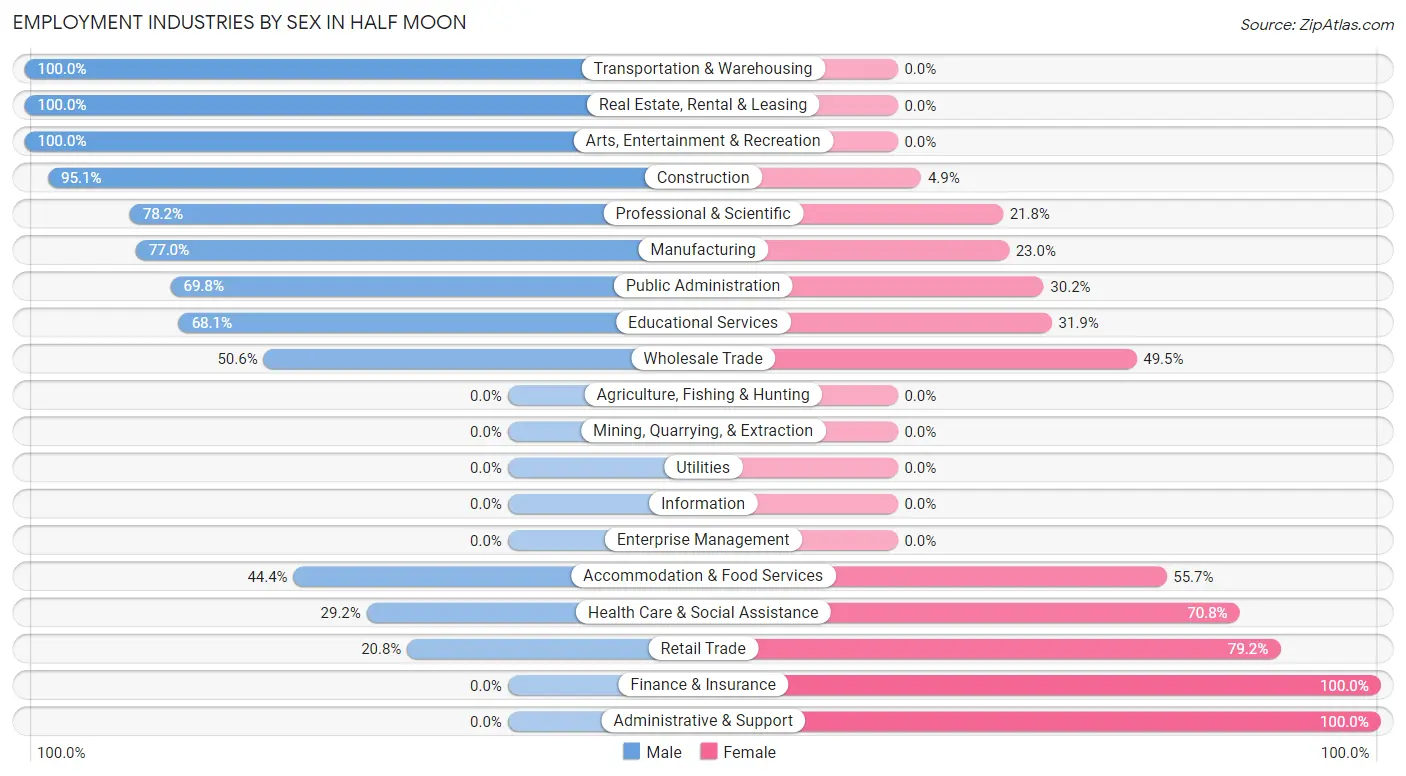
Employment Industries by Sex in Half Moon
The Half Moon industries that see more men than women are Transportation & Warehousing (100.0%), Real Estate, Rental & Leasing (100.0%), and Arts, Entertainment & Recreation (100.0%), whereas the industries that tend to have a higher number of women are Finance & Insurance (100.0%), Administrative & Support (100.0%), and Retail Trade (79.2%).
| Industry | Male | Female |
| Agriculture, Fishing & Hunting | 0 (0.0%) | 0 (0.0%) |
| Mining, Quarrying, & Extraction | 0 (0.0%) | 0 (0.0%) |
| Construction | 234 (95.1%) | 12 (4.9%) |
| Manufacturing | 167 (77.0%) | 50 (23.0%) |
| Wholesale Trade | 92 (50.5%) | 90 (49.4%) |
| Retail Trade | 92 (20.8%) | 350 (79.2%) |
| Transportation & Warehousing | 49 (100.0%) | 0 (0.0%) |
| Utilities | 0 (0.0%) | 0 (0.0%) |
| Information | 0 (0.0%) | 0 (0.0%) |
| Finance & Insurance | 0 (0.0%) | 185 (100.0%) |
| Real Estate, Rental & Leasing | 31 (100.0%) | 0 (0.0%) |
| Professional & Scientific | 122 (78.2%) | 34 (21.8%) |
| Enterprise Management | 0 (0.0%) | 0 (0.0%) |
| Administrative & Support | 0 (0.0%) | 113 (100.0%) |
| Educational Services | 207 (68.1%) | 97 (31.9%) |
| Health Care & Social Assistance | 125 (29.2%) | 303 (70.8%) |
| Arts, Entertainment & Recreation | 232 (100.0%) | 0 (0.0%) |
| Accommodation & Food Services | 55 (44.4%) | 69 (55.6%) |
| Public Administration | 284 (69.8%) | 123 (30.2%) |
| Total | 1,926 (57.2%) | 1,440 (42.8%) |
Education in Half Moon
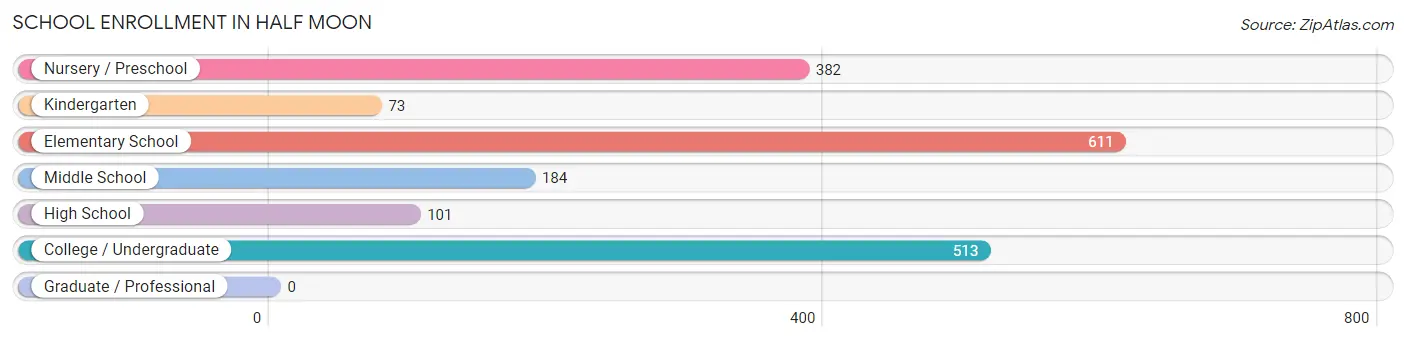
School Enrollment in Half Moon
The most common levels of schooling among the 1,864 students in Half Moon are elementary school (611 | 32.8%), college / undergraduate (513 | 27.5%), and nursery / preschool (382 | 20.5%).
| School Level | # Students | % Students |
| Nursery / Preschool | 382 | 20.5% |
| Kindergarten | 73 | 3.9% |
| Elementary School | 611 | 32.8% |
| Middle School | 184 | 9.9% |
| High School | 101 | 5.4% |
| College / Undergraduate | 513 | 27.5% |
| Graduate / Professional | 0 | 0.0% |
| Total | 1,864 | 100.0% |
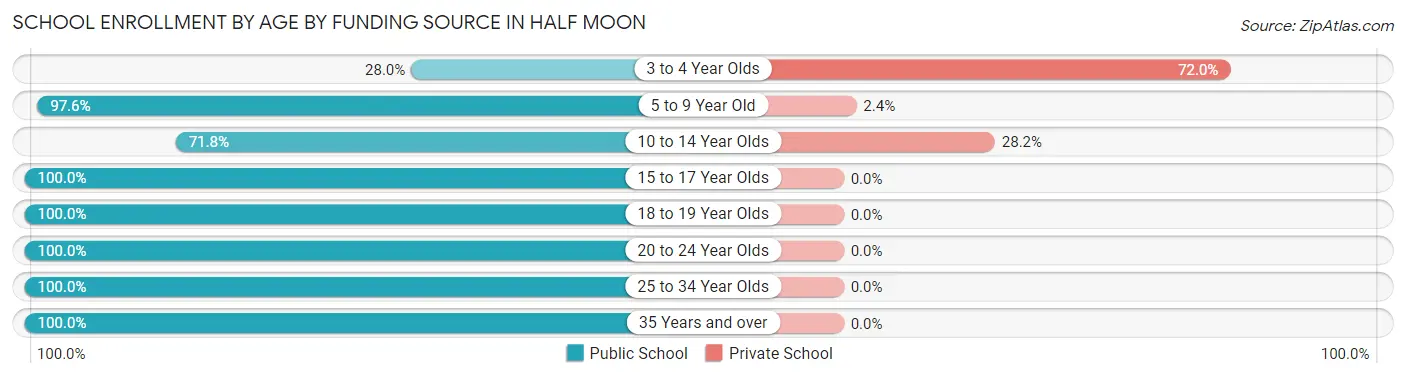
School Enrollment by Age by Funding Source in Half Moon
Out of a total of 1,864 students who are enrolled in schools in Half Moon, 367 (19.7%) attend a private institution, while the remaining 1,497 (80.3%) are enrolled in public schools. The age group of 3 to 4 year olds has the highest likelihood of being enrolled in private schools, with 275 (72.0% in the age bracket) enrolled. Conversely, the age group of 15 to 17 year olds has the lowest likelihood of being enrolled in a private school, with 83 (100.0% in the age bracket) attending a public institution.
| Age Bracket | Public School | Private School |
| 3 to 4 Year Olds | 107 (28.0%) | 275 (72.0%) |
| 5 to 9 Year Old | 577 (97.6%) | 14 (2.4%) |
| 10 to 14 Year Olds | 199 (71.8%) | 78 (28.2%) |
| 15 to 17 Year Olds | 83 (100.0%) | 0 (0.0%) |
| 18 to 19 Year Olds | 11 (100.0%) | 0 (0.0%) |
| 20 to 24 Year Olds | 322 (100.0%) | 0 (0.0%) |
| 25 to 34 Year Olds | 76 (100.0%) | 0 (0.0%) |
| 35 Years and over | 122 (100.0%) | 0 (0.0%) |
| Total | 1,497 (80.3%) | 367 (19.7%) |
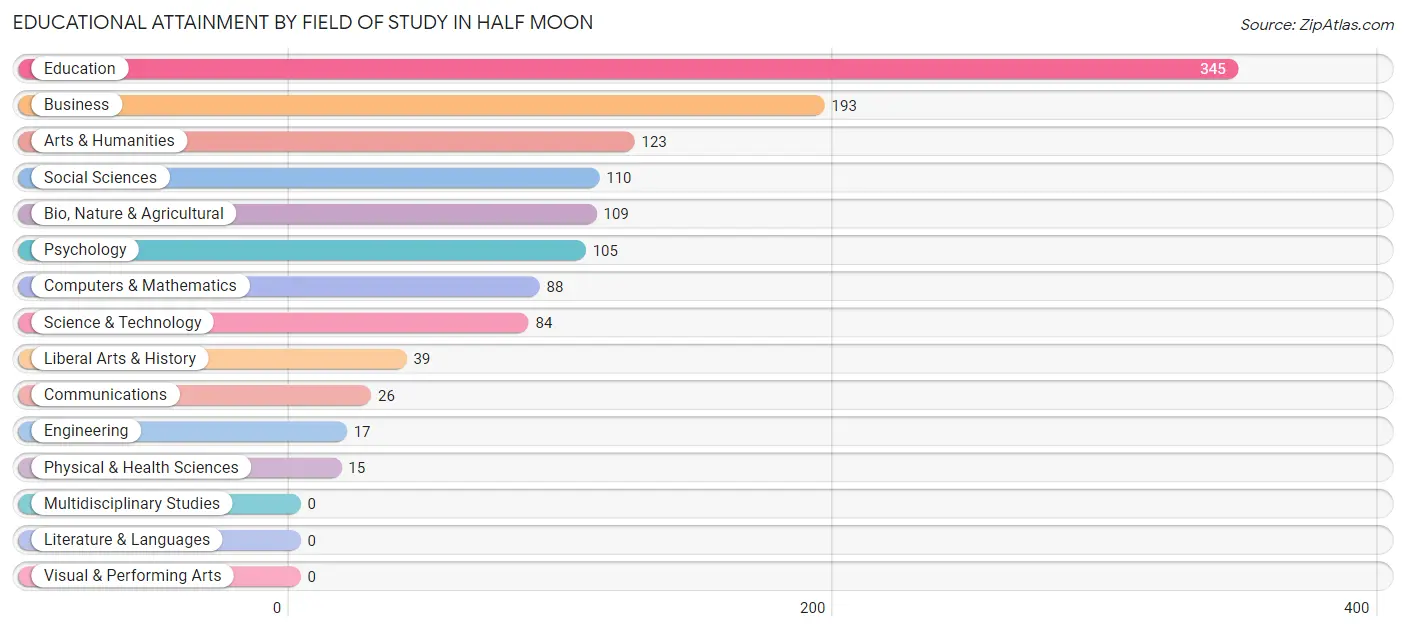
Educational Attainment by Field of Study in Half Moon
Education (345 | 27.5%), business (193 | 15.4%), arts & humanities (123 | 9.8%), social sciences (110 | 8.8%), and bio, nature & agricultural (109 | 8.7%) are the most common fields of study among 1,254 individuals in Half Moon who have obtained a bachelor's degree or higher.
| Field of Study | # Graduates | % Graduates |
| Computers & Mathematics | 88 | 7.0% |
| Bio, Nature & Agricultural | 109 | 8.7% |
| Physical & Health Sciences | 15 | 1.2% |
| Psychology | 105 | 8.4% |
| Social Sciences | 110 | 8.8% |
| Engineering | 17 | 1.4% |
| Multidisciplinary Studies | 0 | 0.0% |
| Science & Technology | 84 | 6.7% |
| Business | 193 | 15.4% |
| Education | 345 | 27.5% |
| Literature & Languages | 0 | 0.0% |
| Liberal Arts & History | 39 | 3.1% |
| Visual & Performing Arts | 0 | 0.0% |
| Communications | 26 | 2.1% |
| Arts & Humanities | 123 | 9.8% |
| Total | 1,254 | 100.0% |
Transportation & Commute in Half Moon
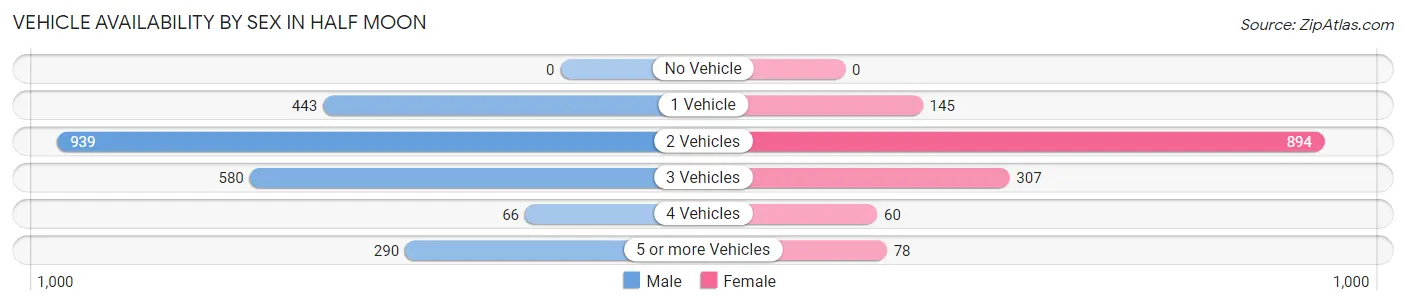
Vehicle Availability by Sex in Half Moon
The most prevalent vehicle ownership categories in Half Moon are males with 2 vehicles (939, accounting for 40.5%) and females with 2 vehicles (894, making up 63.3%).
| Vehicles Available | Male | Female |
| No Vehicle | 0 (0.0%) | 0 (0.0%) |
| 1 Vehicle | 443 (19.1%) | 145 (9.8%) |
| 2 Vehicles | 939 (40.5%) | 894 (60.2%) |
| 3 Vehicles | 580 (25.0%) | 307 (20.7%) |
| 4 Vehicles | 66 (2.9%) | 60 (4.0%) |
| 5 or more Vehicles | 290 (12.5%) | 78 (5.3%) |
| Total | 2,318 (100.0%) | 1,484 (100.0%) |
Commute Time in Half Moon
The most frequently occuring commute durations in Half Moon are 10 to 14 minutes (746 commuters, 20.7%), 30 to 34 minutes (721 commuters, 20.0%), and 45 to 59 minutes (430 commuters, 11.9%).
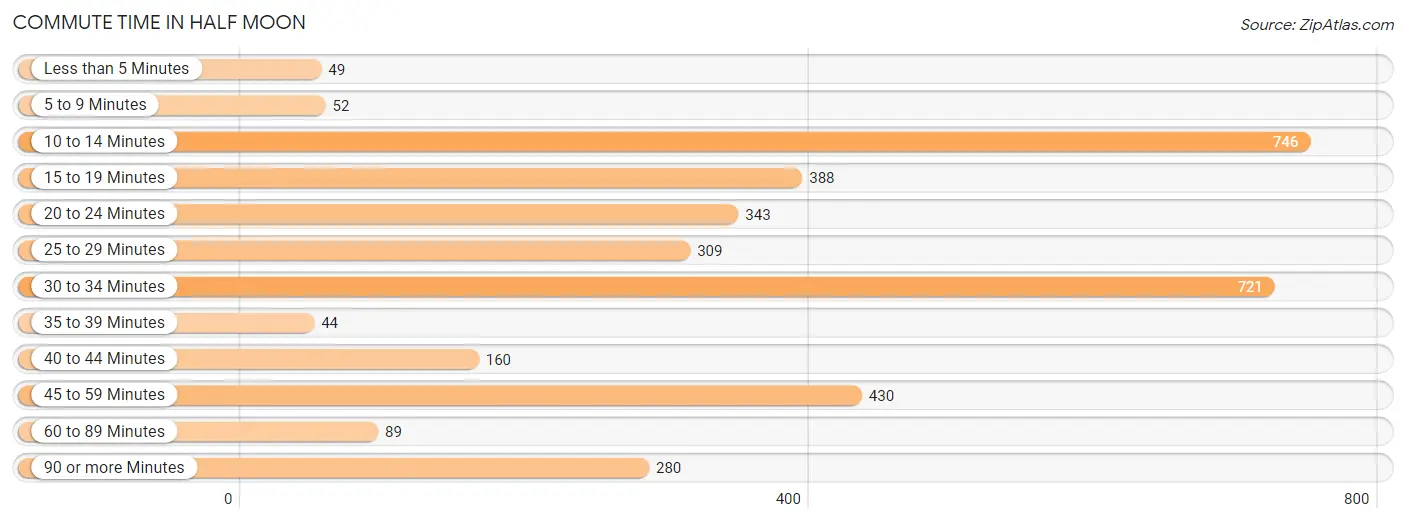
| Commute Time | # Commuters | % Commuters |
| Less than 5 Minutes | 49 | 1.4% |
| 5 to 9 Minutes | 52 | 1.4% |
| 10 to 14 Minutes | 746 | 20.7% |
| 15 to 19 Minutes | 388 | 10.7% |
| 20 to 24 Minutes | 343 | 9.5% |
| 25 to 29 Minutes | 309 | 8.6% |
| 30 to 34 Minutes | 721 | 20.0% |
| 35 to 39 Minutes | 44 | 1.2% |
| 40 to 44 Minutes | 160 | 4.4% |
| 45 to 59 Minutes | 430 | 11.9% |
| 60 to 89 Minutes | 89 | 2.5% |
| 90 or more Minutes | 280 | 7.7% |
Commute Time by Sex in Half Moon
The most common commute times in Half Moon are 30 to 34 minutes (592 commuters, 25.9%) for males and 10 to 14 minutes (467 commuters, 35.2%) for females.
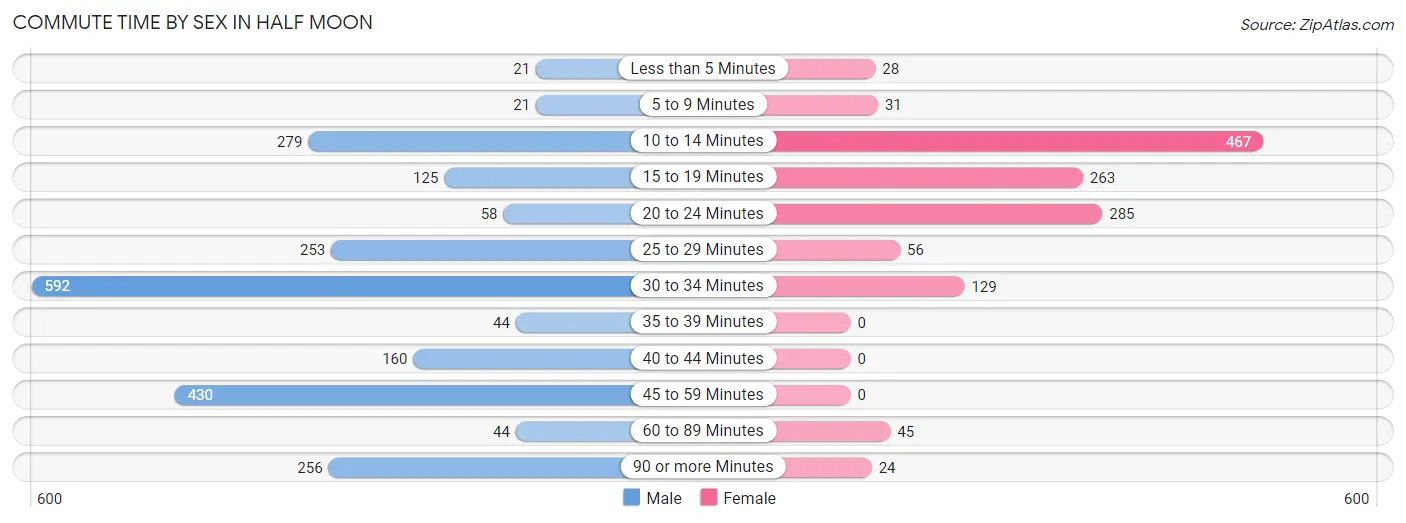
| Commute Time | Male | Female |
| Less than 5 Minutes | 21 (0.9%) | 28 (2.1%) |
| 5 to 9 Minutes | 21 (0.9%) | 31 (2.3%) |
| 10 to 14 Minutes | 279 (12.2%) | 467 (35.2%) |
| 15 to 19 Minutes | 125 (5.5%) | 263 (19.8%) |
| 20 to 24 Minutes | 58 (2.5%) | 285 (21.5%) |
| 25 to 29 Minutes | 253 (11.1%) | 56 (4.2%) |
| 30 to 34 Minutes | 592 (25.9%) | 129 (9.7%) |
| 35 to 39 Minutes | 44 (1.9%) | 0 (0.0%) |
| 40 to 44 Minutes | 160 (7.0%) | 0 (0.0%) |
| 45 to 59 Minutes | 430 (18.8%) | 0 (0.0%) |
| 60 to 89 Minutes | 44 (1.9%) | 45 (3.4%) |
| 90 or more Minutes | 256 (11.2%) | 24 (1.8%) |
Time of Departure to Work by Sex in Half Moon
The most frequent times of departure to work in Half Moon are 7:00 AM to 7:29 AM (758, 33.2%) for males and 7:00 AM to 7:29 AM (391, 29.4%) for females.
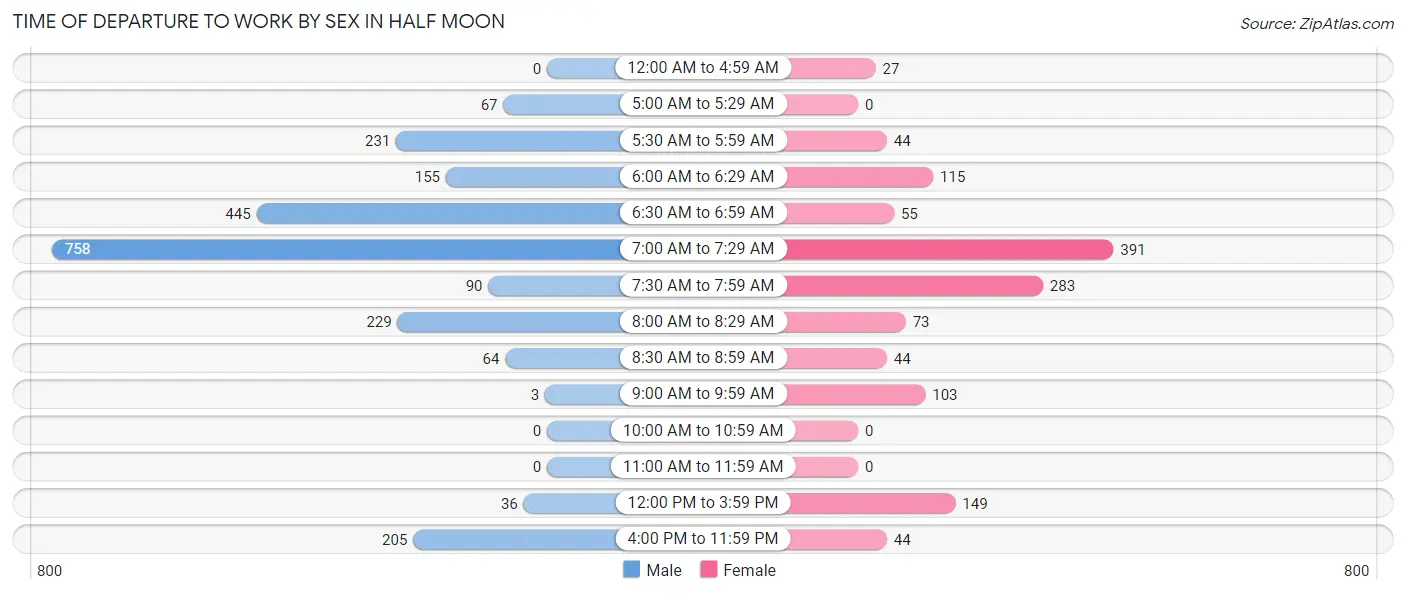
| Time of Departure | Male | Female |
| 12:00 AM to 4:59 AM | 0 (0.0%) | 27 (2.0%) |
| 5:00 AM to 5:29 AM | 67 (2.9%) | 0 (0.0%) |
| 5:30 AM to 5:59 AM | 231 (10.1%) | 44 (3.3%) |
| 6:00 AM to 6:29 AM | 155 (6.8%) | 115 (8.7%) |
| 6:30 AM to 6:59 AM | 445 (19.5%) | 55 (4.1%) |
| 7:00 AM to 7:29 AM | 758 (33.2%) | 391 (29.4%) |
| 7:30 AM to 7:59 AM | 90 (3.9%) | 283 (21.3%) |
| 8:00 AM to 8:29 AM | 229 (10.0%) | 73 (5.5%) |
| 8:30 AM to 8:59 AM | 64 (2.8%) | 44 (3.3%) |
| 9:00 AM to 9:59 AM | 3 (0.1%) | 103 (7.8%) |
| 10:00 AM to 10:59 AM | 0 (0.0%) | 0 (0.0%) |
| 11:00 AM to 11:59 AM | 0 (0.0%) | 0 (0.0%) |
| 12:00 PM to 3:59 PM | 36 (1.6%) | 149 (11.2%) |
| 4:00 PM to 11:59 PM | 205 (9.0%) | 44 (3.3%) |
| Total | 2,283 (100.0%) | 1,328 (100.0%) |
Housing Occupancy in Half Moon
Occupancy by Ownership in Half Moon
Of the total 2,965 dwellings in Half Moon, owner-occupied units account for 2,014 (67.9%), while renter-occupied units make up 951 (32.1%).
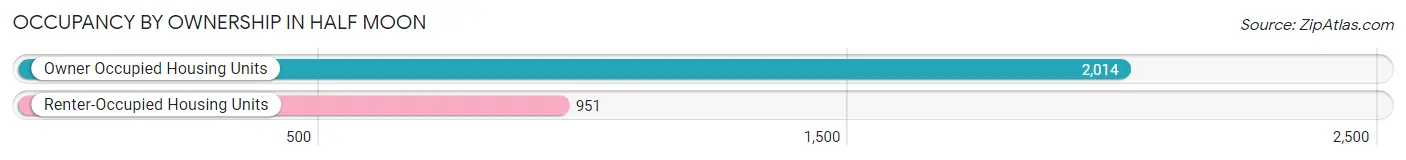
| Occupancy | # Housing Units | % Housing Units |
| Owner Occupied Housing Units | 2,014 | 67.9% |
| Renter-Occupied Housing Units | 951 | 32.1% |
| Total Occupied Housing Units | 2,965 | 100.0% |
Occupancy by Household Size in Half Moon
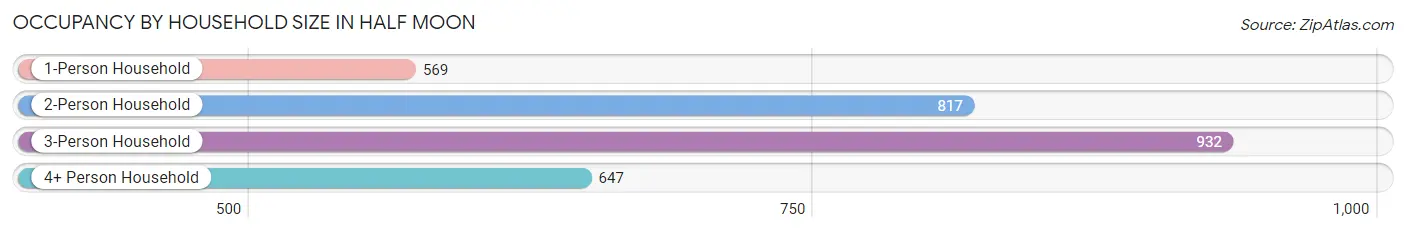
| Household Size | # Housing Units | % Housing Units |
| 1-Person Household | 569 | 19.2% |
| 2-Person Household | 817 | 27.6% |
| 3-Person Household | 932 | 31.4% |
| 4+ Person Household | 647 | 21.8% |
| Total Housing Units | 2,965 | 100.0% |
Occupancy by Ownership by Household Size in Half Moon
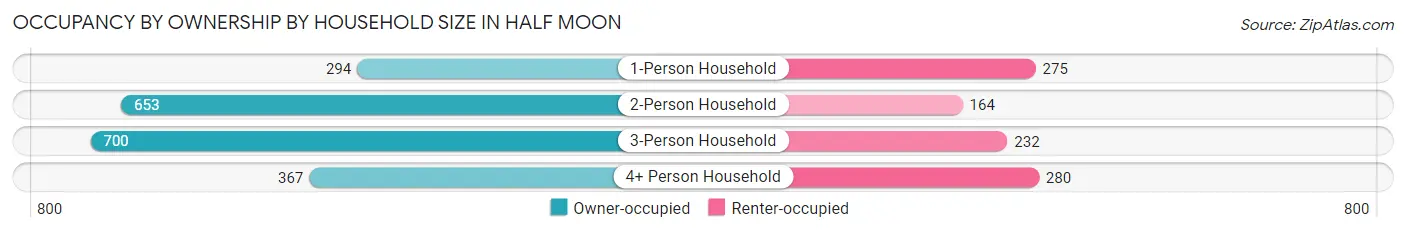
| Household Size | Owner-occupied | Renter-occupied |
| 1-Person Household | 294 (51.7%) | 275 (48.3%) |
| 2-Person Household | 653 (79.9%) | 164 (20.1%) |
| 3-Person Household | 700 (75.1%) | 232 (24.9%) |
| 4+ Person Household | 367 (56.7%) | 280 (43.3%) |
| Total Housing Units | 2,014 (67.9%) | 951 (32.1%) |
Occupancy by Educational Attainment in Half Moon
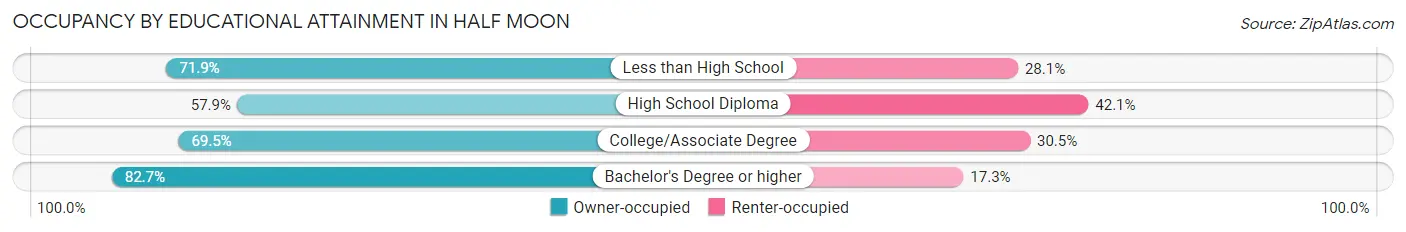
| Household Size | Owner-occupied | Renter-occupied |
| Less than High School | 69 (71.9%) | 27 (28.1%) |
| High School Diploma | 592 (57.9%) | 430 (42.1%) |
| College/Associate Degree | 918 (69.5%) | 403 (30.5%) |
| Bachelor's Degree or higher | 435 (82.7%) | 91 (17.3%) |
Occupancy by Age of Householder in Half Moon
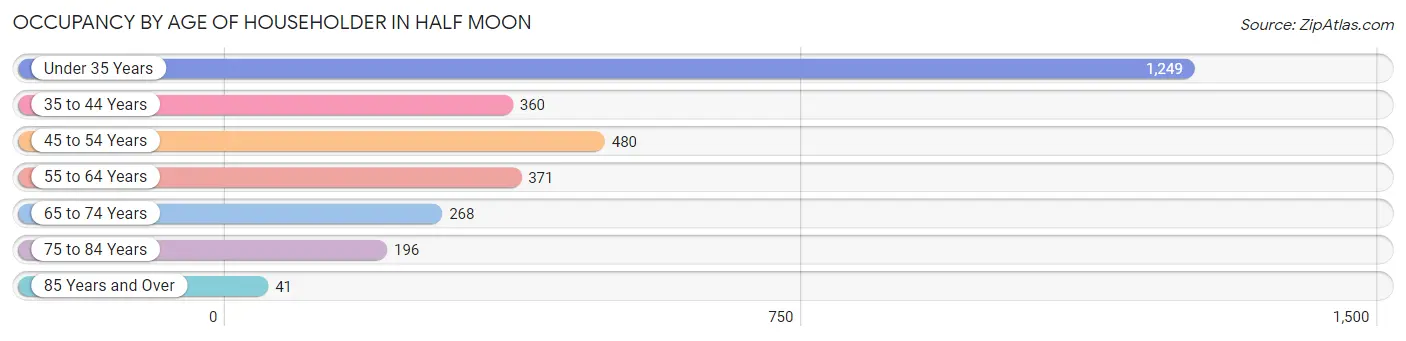
| Age Bracket | # Households | % Households |
| Under 35 Years | 1,249 | 42.1% |
| 35 to 44 Years | 360 | 12.1% |
| 45 to 54 Years | 480 | 16.2% |
| 55 to 64 Years | 371 | 12.5% |
| 65 to 74 Years | 268 | 9.0% |
| 75 to 84 Years | 196 | 6.6% |
| 85 Years and Over | 41 | 1.4% |
| Total | 2,965 | 100.0% |
Housing Finances in Half Moon
Median Income by Occupancy in Half Moon
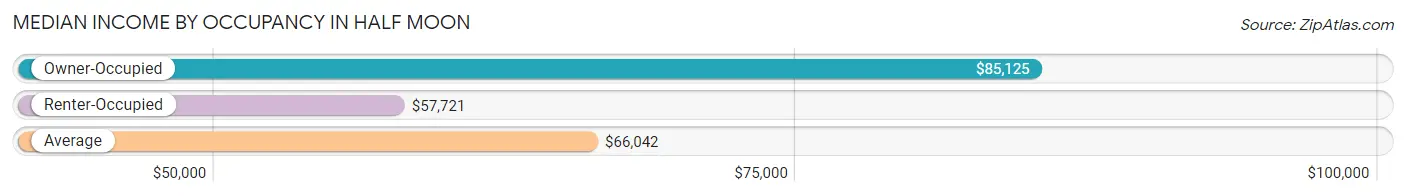
| Occupancy Type | # Households | Median Income |
| Owner-Occupied | 2,014 (67.9%) | $85,125 |
| Renter-Occupied | 951 (32.1%) | $57,721 |
| Average | 2,965 (100.0%) | $66,042 |
Occupancy by Householder Income Bracket in Half Moon
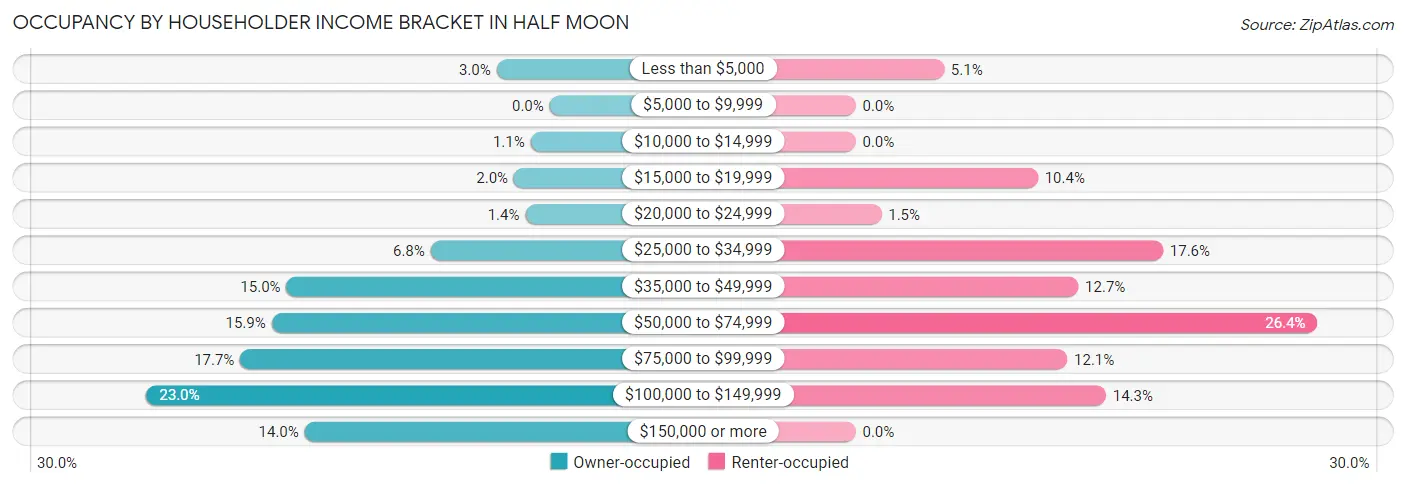
| Income Bracket | Owner-occupied | Renter-occupied |
| Less than $5,000 | 61 (3.0%) | 48 (5.1%) |
| $5,000 to $9,999 | 0 (0.0%) | 0 (0.0%) |
| $10,000 to $14,999 | 22 (1.1%) | 0 (0.0%) |
| $15,000 to $19,999 | 41 (2.0%) | 99 (10.4%) |
| $20,000 to $24,999 | 28 (1.4%) | 14 (1.5%) |
| $25,000 to $34,999 | 137 (6.8%) | 167 (17.6%) |
| $35,000 to $49,999 | 303 (15.0%) | 121 (12.7%) |
| $50,000 to $74,999 | 320 (15.9%) | 251 (26.4%) |
| $75,000 to $99,999 | 356 (17.7%) | 115 (12.1%) |
| $100,000 to $149,999 | 464 (23.0%) | 136 (14.3%) |
| $150,000 or more | 282 (14.0%) | 0 (0.0%) |
| Total | 2,014 (100.0%) | 951 (100.0%) |
Monthly Housing Cost Tiers in Half Moon
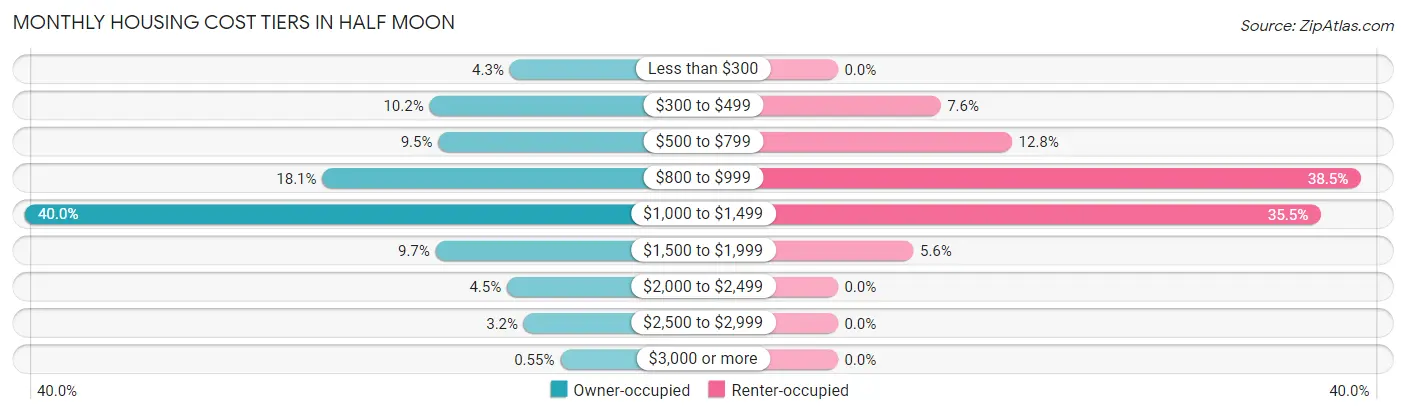
| Monthly Cost | Owner-occupied | Renter-occupied |
| Less than $300 | 86 (4.3%) | 0 (0.0%) |
| $300 to $499 | 205 (10.2%) | 72 (7.6%) |
| $500 to $799 | 192 (9.5%) | 122 (12.8%) |
| $800 to $999 | 364 (18.1%) | 366 (38.5%) |
| $1,000 to $1,499 | 805 (40.0%) | 338 (35.5%) |
| $1,500 to $1,999 | 196 (9.7%) | 53 (5.6%) |
| $2,000 to $2,499 | 90 (4.5%) | 0 (0.0%) |
| $2,500 to $2,999 | 65 (3.2%) | 0 (0.0%) |
| $3,000 or more | 11 (0.5%) | 0 (0.0%) |
| Total | 2,014 (100.0%) | 951 (100.0%) |
Physical Housing Characteristics in Half Moon
Housing Structures in Half Moon
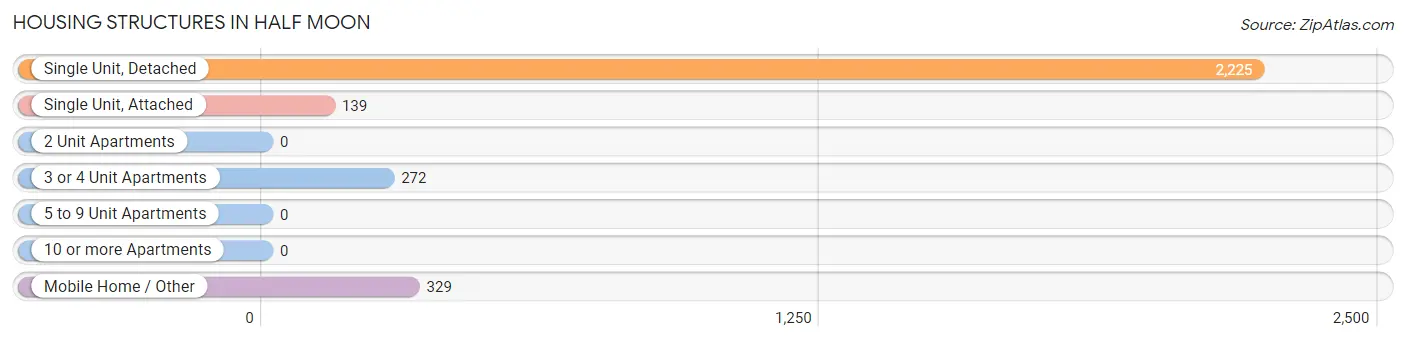
| Structure Type | # Housing Units | % Housing Units |
| Single Unit, Detached | 2,225 | 75.0% |
| Single Unit, Attached | 139 | 4.7% |
| 2 Unit Apartments | 0 | 0.0% |
| 3 or 4 Unit Apartments | 272 | 9.2% |
| 5 to 9 Unit Apartments | 0 | 0.0% |
| 10 or more Apartments | 0 | 0.0% |
| Mobile Home / Other | 329 | 11.1% |
| Total | 2,965 | 100.0% |
Housing Structures by Occupancy in Half Moon
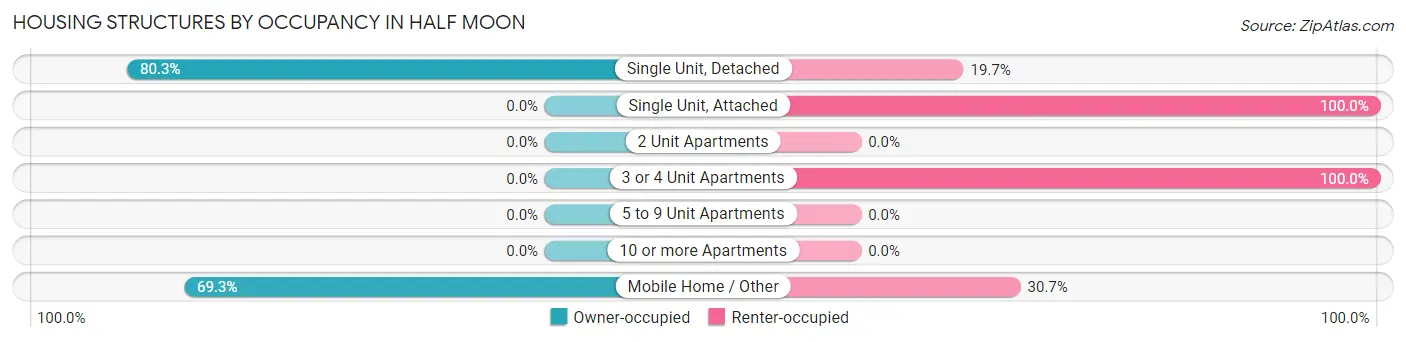
| Structure Type | Owner-occupied | Renter-occupied |
| Single Unit, Detached | 1,786 (80.3%) | 439 (19.7%) |
| Single Unit, Attached | 0 (0.0%) | 139 (100.0%) |
| 2 Unit Apartments | 0 (0.0%) | 0 (0.0%) |
| 3 or 4 Unit Apartments | 0 (0.0%) | 272 (100.0%) |
| 5 to 9 Unit Apartments | 0 (0.0%) | 0 (0.0%) |
| 10 or more Apartments | 0 (0.0%) | 0 (0.0%) |
| Mobile Home / Other | 228 (69.3%) | 101 (30.7%) |
| Total | 2,014 (67.9%) | 951 (32.1%) |
Housing Structures by Number of Rooms in Half Moon
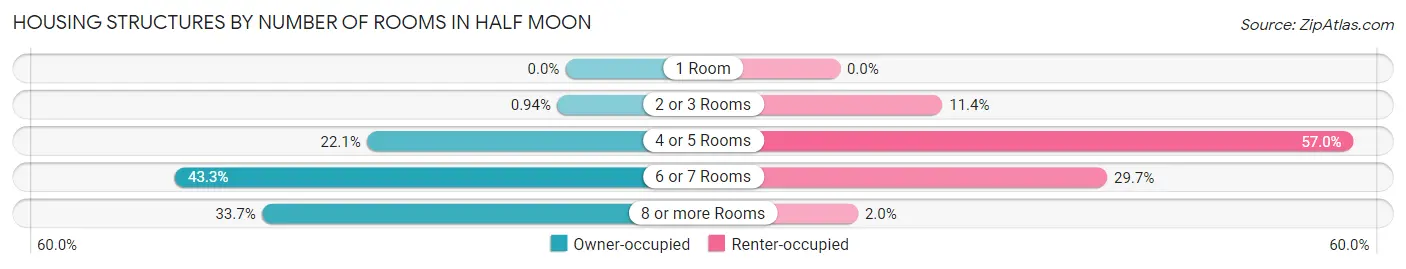
| Number of Rooms | Owner-occupied | Renter-occupied |
| 1 Room | 0 (0.0%) | 0 (0.0%) |
| 2 or 3 Rooms | 19 (0.9%) | 108 (11.4%) |
| 4 or 5 Rooms | 444 (22.1%) | 542 (57.0%) |
| 6 or 7 Rooms | 872 (43.3%) | 282 (29.6%) |
| 8 or more Rooms | 679 (33.7%) | 19 (2.0%) |
| Total | 2,014 (100.0%) | 951 (100.0%) |
Housing Structure by Heating Type in Half Moon
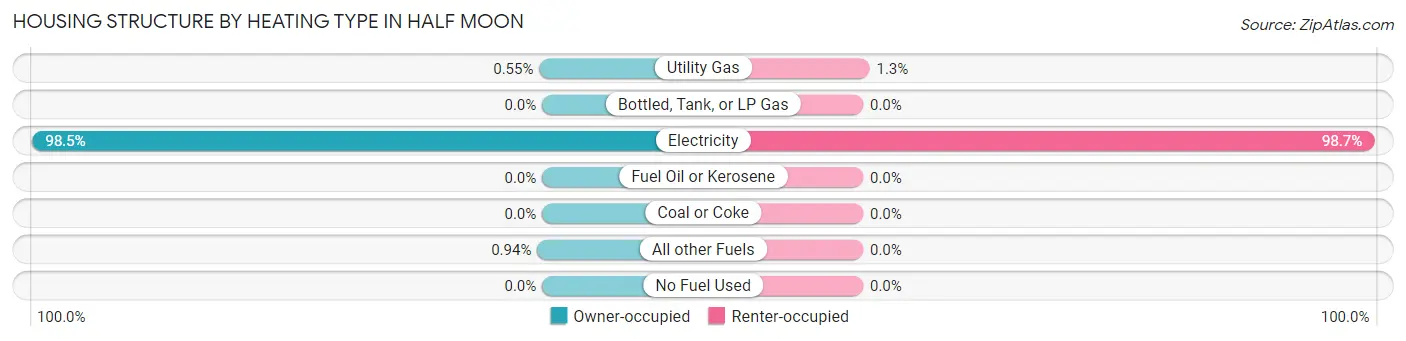
| Heating Type | Owner-occupied | Renter-occupied |
| Utility Gas | 11 (0.5%) | 12 (1.3%) |
| Bottled, Tank, or LP Gas | 0 (0.0%) | 0 (0.0%) |
| Electricity | 1,984 (98.5%) | 939 (98.7%) |
| Fuel Oil or Kerosene | 0 (0.0%) | 0 (0.0%) |
| Coal or Coke | 0 (0.0%) | 0 (0.0%) |
| All other Fuels | 19 (0.9%) | 0 (0.0%) |
| No Fuel Used | 0 (0.0%) | 0 (0.0%) |
| Total | 2,014 (100.0%) | 951 (100.0%) |
Household Vehicle Usage in Half Moon
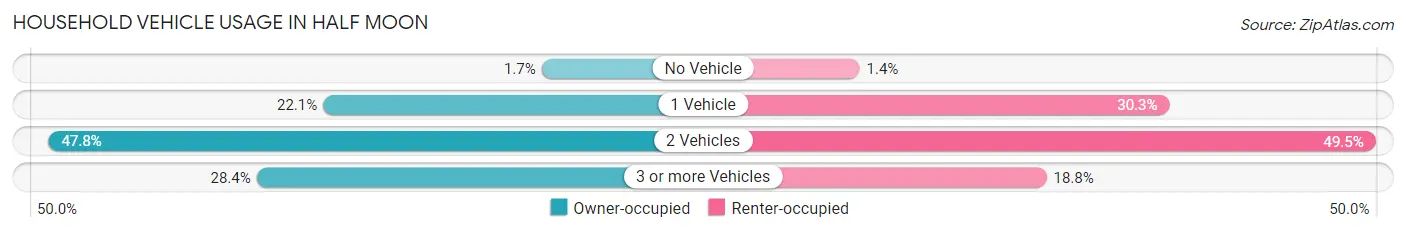
| Vehicles per Household | Owner-occupied | Renter-occupied |
| No Vehicle | 35 (1.7%) | 13 (1.4%) |
| 1 Vehicle | 446 (22.1%) | 288 (30.3%) |
| 2 Vehicles | 962 (47.8%) | 471 (49.5%) |
| 3 or more Vehicles | 571 (28.3%) | 179 (18.8%) |
| Total | 2,014 (100.0%) | 951 (100.0%) |
Real Estate & Mortgages in Half Moon
Real Estate and Mortgage Overview in Half Moon
| Characteristic | Without Mortgage | With Mortgage |
| Housing Units | 408 | 1,606 |
| Median Property Value | $163,100 | $167,400 |
| Median Household Income | $75,192 | $246 |
| Monthly Housing Costs | $430 | $11 |
| Real Estate Taxes | $906 | $88 |
Property Value by Mortgage Status in Half Moon
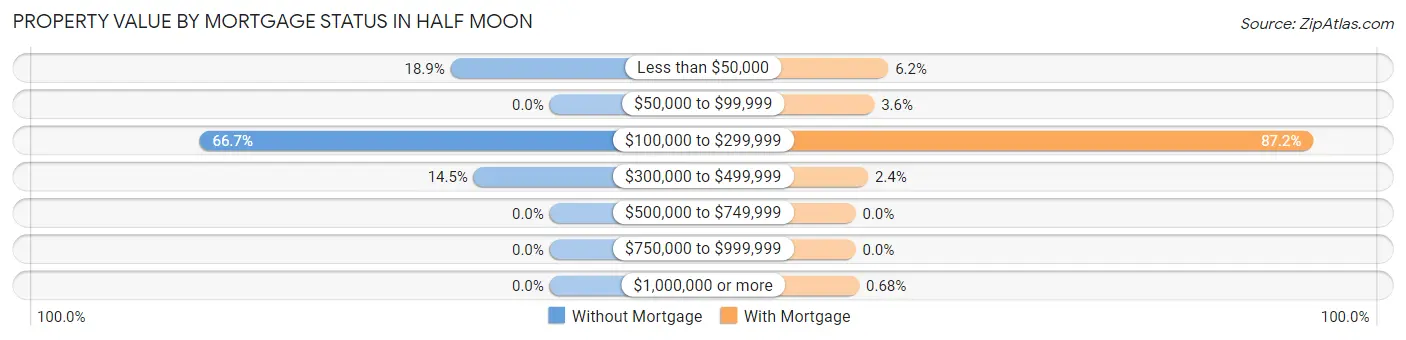
| Property Value | Without Mortgage | With Mortgage |
| Less than $50,000 | 77 (18.9%) | 100 (6.2%) |
| $50,000 to $99,999 | 0 (0.0%) | 57 (3.5%) |
| $100,000 to $299,999 | 272 (66.7%) | 1,400 (87.2%) |
| $300,000 to $499,999 | 59 (14.5%) | 38 (2.4%) |
| $500,000 to $749,999 | 0 (0.0%) | 0 (0.0%) |
| $750,000 to $999,999 | 0 (0.0%) | 0 (0.0%) |
| $1,000,000 or more | 0 (0.0%) | 11 (0.7%) |
| Total | 408 (100.0%) | 1,606 (100.0%) |
Household Income by Mortgage Status in Half Moon
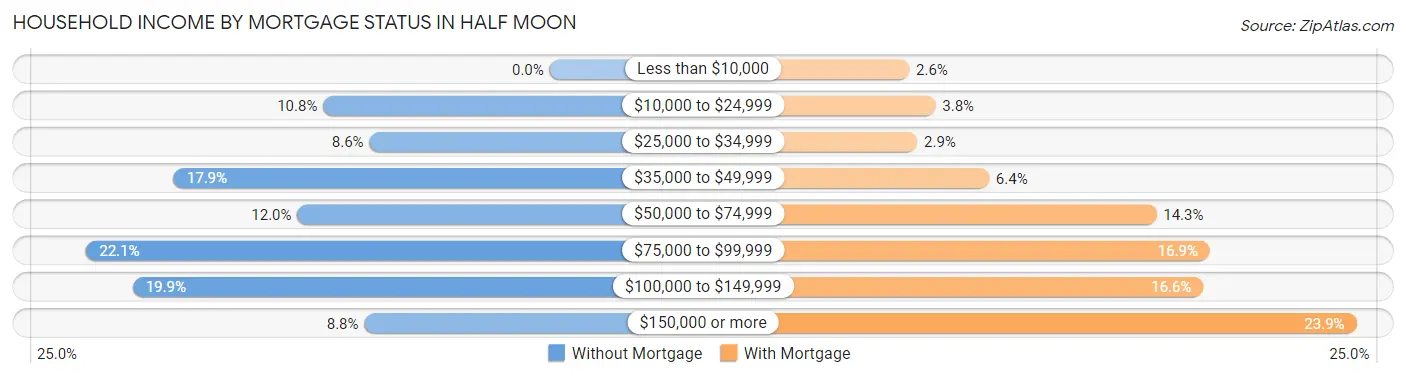
| Household Income | Without Mortgage | With Mortgage |
| Less than $10,000 | 0 (0.0%) | 41 (2.5%) |
| $10,000 to $24,999 | 44 (10.8%) | 61 (3.8%) |
| $25,000 to $34,999 | 35 (8.6%) | 47 (2.9%) |
| $35,000 to $49,999 | 73 (17.9%) | 102 (6.4%) |
| $50,000 to $74,999 | 49 (12.0%) | 230 (14.3%) |
| $75,000 to $99,999 | 90 (22.1%) | 271 (16.9%) |
| $100,000 to $149,999 | 81 (19.9%) | 266 (16.6%) |
| $150,000 or more | 36 (8.8%) | 383 (23.8%) |
| Total | 408 (100.0%) | 1,606 (100.0%) |
Property Value to Household Income Ratio in Half Moon
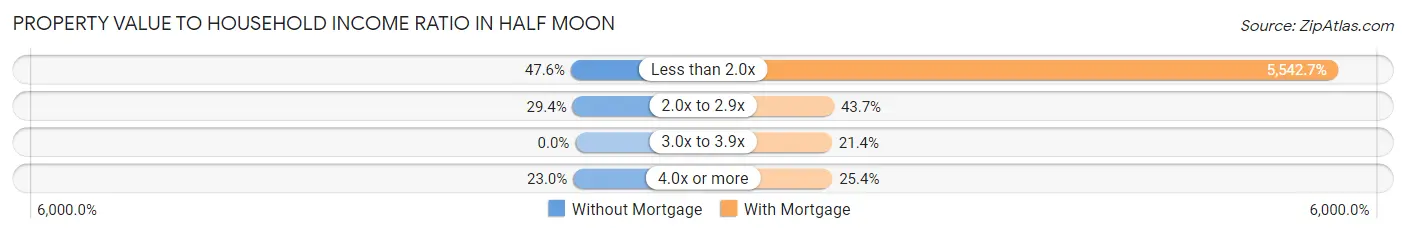
| Value-to-Income Ratio | Without Mortgage | With Mortgage |
| Less than 2.0x | 194 (47.5%) | 89,016 (5,542.7%) |
| 2.0x to 2.9x | 120 (29.4%) | 701 (43.6%) |
| 3.0x to 3.9x | 0 (0.0%) | 343 (21.4%) |
| 4.0x or more | 94 (23.0%) | 408 (25.4%) |
| Total | 408 (100.0%) | 1,606 (100.0%) |
Real Estate Taxes by Mortgage Status in Half Moon
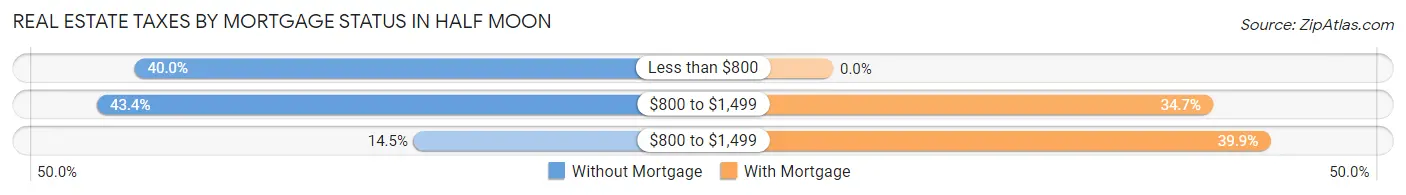
| Property Taxes | Without Mortgage | With Mortgage |
| Less than $800 | 163 (40.0%) | 0 (0.0%) |
| $800 to $1,499 | 177 (43.4%) | 557 (34.7%) |
| $800 to $1,499 | 59 (14.5%) | 641 (39.9%) |
| Total | 408 (100.0%) | 1,606 (100.0%) |
Health & Disability in Half Moon
Health Insurance Coverage by Age in Half Moon
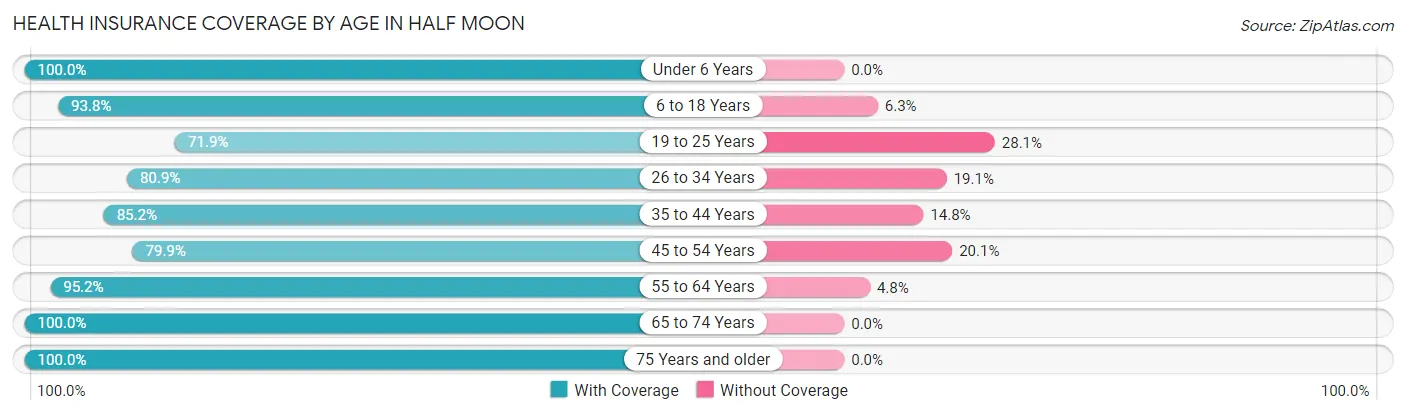
| Age Bracket | With Coverage | Without Coverage |
| Under 6 Years | 1,397 (100.0%) | 0 (0.0%) |
| 6 to 18 Years | 930 (93.8%) | 62 (6.2%) |
| 19 to 25 Years | 835 (71.9%) | 326 (28.1%) |
| 26 to 34 Years | 754 (80.9%) | 178 (19.1%) |
| 35 to 44 Years | 739 (85.2%) | 128 (14.8%) |
| 45 to 54 Years | 714 (79.9%) | 180 (20.1%) |
| 55 to 64 Years | 556 (95.2%) | 28 (4.8%) |
| 65 to 74 Years | 569 (100.0%) | 0 (0.0%) |
| 75 Years and older | 400 (100.0%) | 0 (0.0%) |
| Total | 6,894 (88.4%) | 902 (11.6%) |
Health Insurance Coverage by Citizenship Status in Half Moon
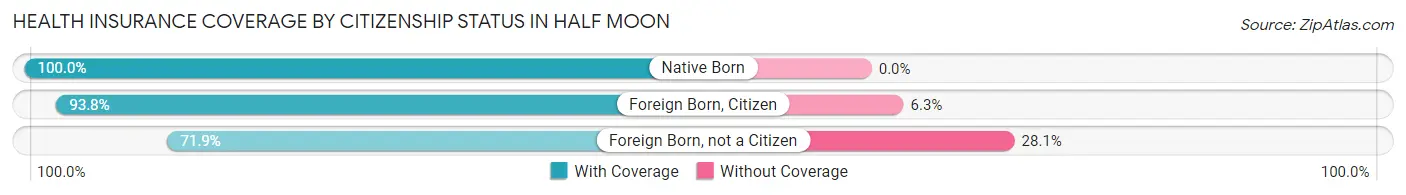
| Citizenship Status | With Coverage | Without Coverage |
| Native Born | 1,397 (100.0%) | 0 (0.0%) |
| Foreign Born, Citizen | 930 (93.8%) | 62 (6.2%) |
| Foreign Born, not a Citizen | 835 (71.9%) | 326 (28.1%) |
Health Insurance Coverage by Household Income in Half Moon
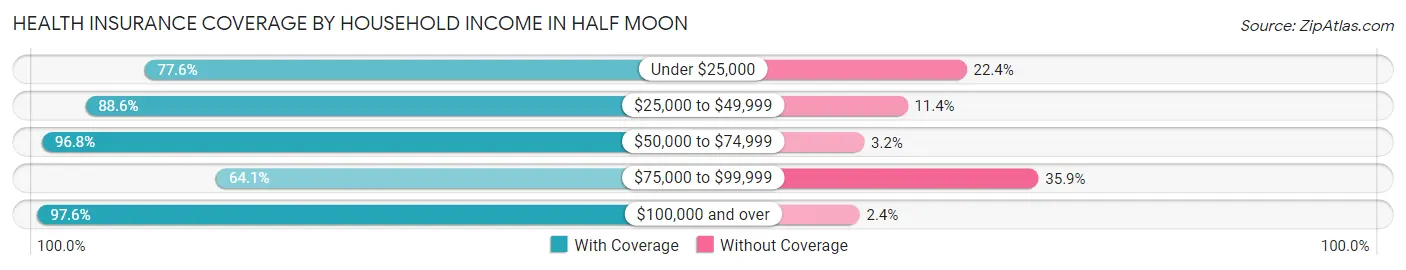
| Household Income | With Coverage | Without Coverage |
| Under $25,000 | 550 (77.6%) | 159 (22.4%) |
| $25,000 to $49,999 | 944 (88.6%) | 121 (11.4%) |
| $50,000 to $74,999 | 1,313 (96.8%) | 44 (3.2%) |
| $75,000 to $99,999 | 893 (64.1%) | 500 (35.9%) |
| $100,000 and over | 3,186 (97.6%) | 78 (2.4%) |
Public vs Private Health Insurance Coverage by Age in Half Moon
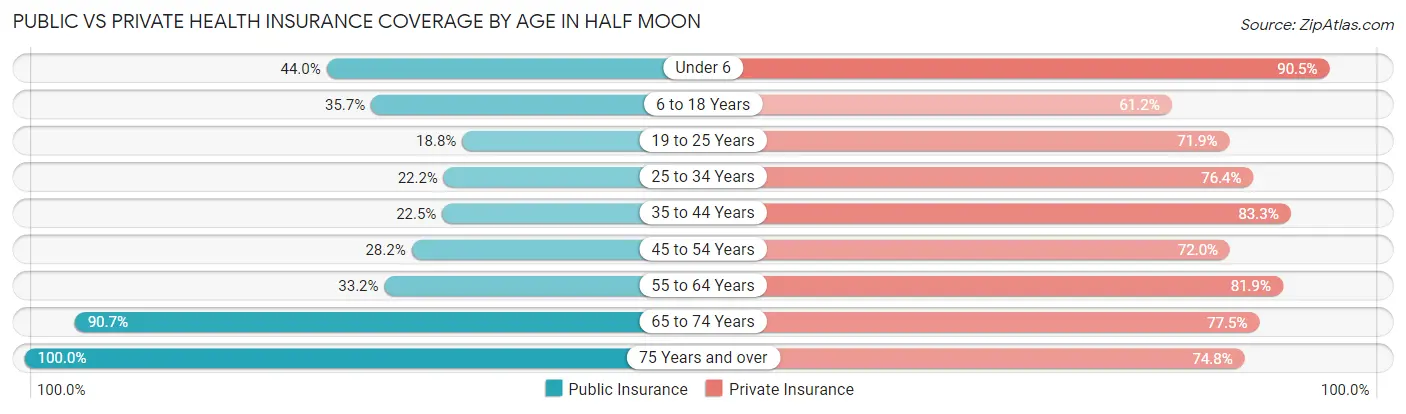
| Age Bracket | Public Insurance | Private Insurance |
| Under 6 | 614 (44.0%) | 1,264 (90.5%) |
| 6 to 18 Years | 354 (35.7%) | 607 (61.2%) |
| 19 to 25 Years | 218 (18.8%) | 835 (71.9%) |
| 25 to 34 Years | 207 (22.2%) | 712 (76.4%) |
| 35 to 44 Years | 195 (22.5%) | 722 (83.3%) |
| 45 to 54 Years | 252 (28.2%) | 644 (72.0%) |
| 55 to 64 Years | 194 (33.2%) | 478 (81.9%) |
| 65 to 74 Years | 516 (90.7%) | 441 (77.5%) |
| 75 Years and over | 400 (100.0%) | 299 (74.8%) |
| Total | 2,950 (37.8%) | 6,002 (77.0%) |
Disability Status by Sex by Age in Half Moon
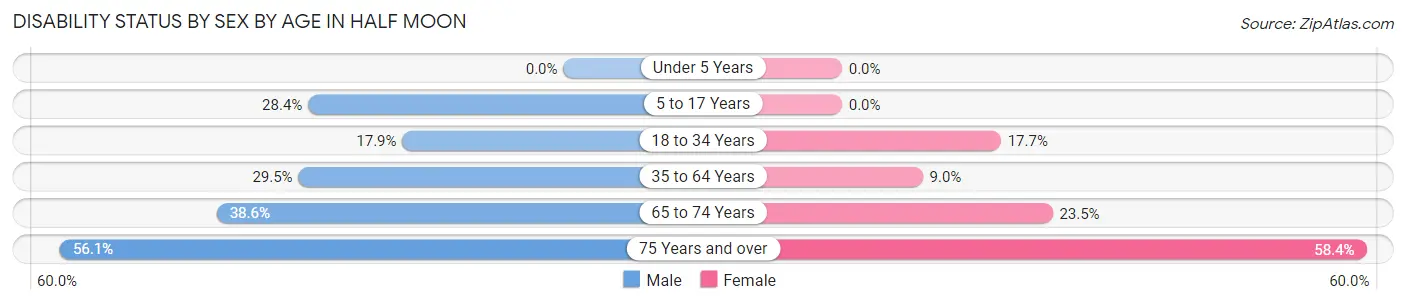
| Age Bracket | Male | Female |
| Under 5 Years | 0 (0.0%) | 0 (0.0%) |
| 5 to 17 Years | 164 (28.4%) | 0 (0.0%) |
| 18 to 34 Years | 198 (17.9%) | 188 (17.7%) |
| 35 to 64 Years | 364 (29.5%) | 100 (9.0%) |
| 65 to 74 Years | 88 (38.6%) | 80 (23.5%) |
| 75 Years and over | 111 (56.1%) | 118 (58.4%) |
Disability Class by Sex by Age in Half Moon
Disability Class: Hearing Difficulty
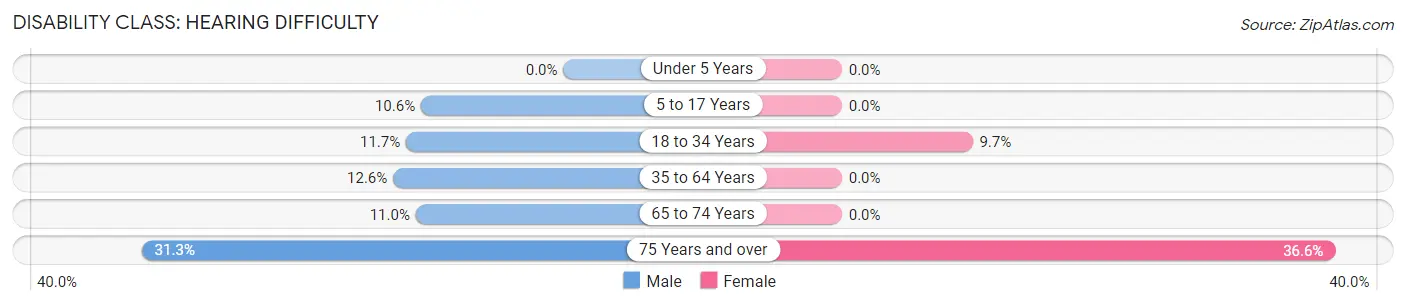
| Age Bracket | Male | Female |
| Under 5 Years | 0 (0.0%) | 0 (0.0%) |
| 5 to 17 Years | 61 (10.6%) | 0 (0.0%) |
| 18 to 34 Years | 129 (11.7%) | 103 (9.7%) |
| 35 to 64 Years | 156 (12.6%) | 0 (0.0%) |
| 65 to 74 Years | 25 (11.0%) | 0 (0.0%) |
| 75 Years and over | 62 (31.3%) | 74 (36.6%) |
Disability Class: Vision Difficulty
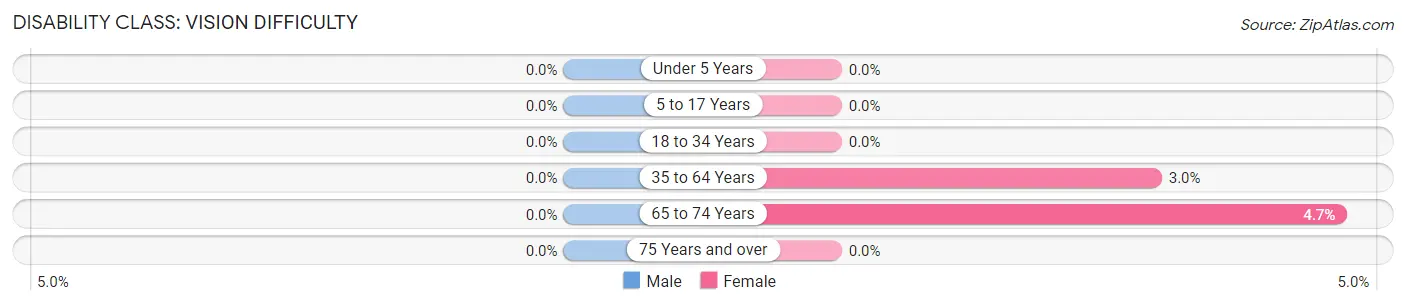
| Age Bracket | Male | Female |
| Under 5 Years | 0 (0.0%) | 0 (0.0%) |
| 5 to 17 Years | 0 (0.0%) | 0 (0.0%) |
| 18 to 34 Years | 0 (0.0%) | 0 (0.0%) |
| 35 to 64 Years | 0 (0.0%) | 33 (3.0%) |
| 65 to 74 Years | 0 (0.0%) | 16 (4.7%) |
| 75 Years and over | 0 (0.0%) | 0 (0.0%) |
Disability Class: Cognitive Difficulty
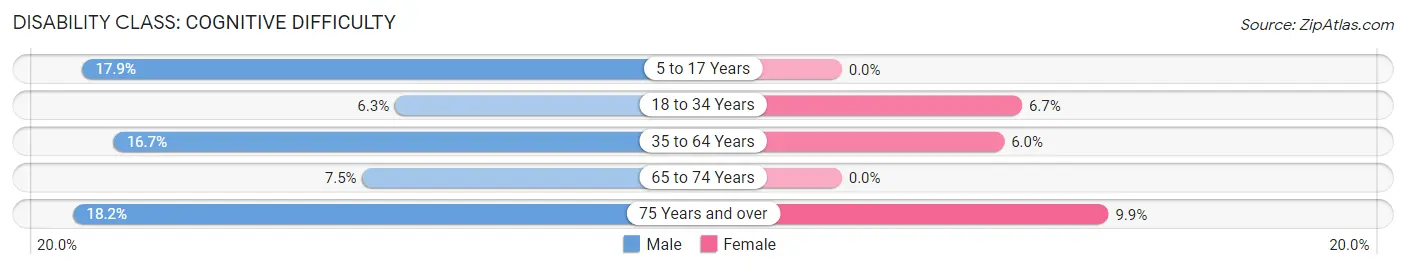
| Age Bracket | Male | Female |
| 5 to 17 Years | 103 (17.8%) | 0 (0.0%) |
| 18 to 34 Years | 69 (6.2%) | 71 (6.7%) |
| 35 to 64 Years | 206 (16.7%) | 67 (6.0%) |
| 65 to 74 Years | 17 (7.5%) | 0 (0.0%) |
| 75 Years and over | 36 (18.2%) | 20 (9.9%) |
Disability Class: Ambulatory Difficulty
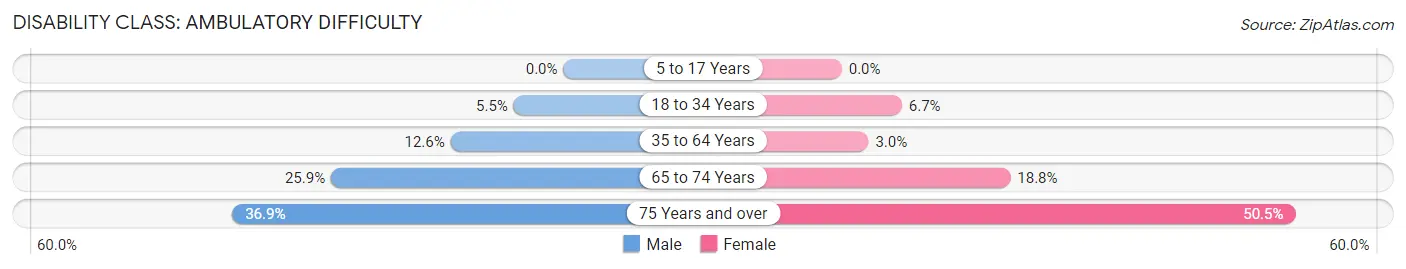
| Age Bracket | Male | Female |
| 5 to 17 Years | 0 (0.0%) | 0 (0.0%) |
| 18 to 34 Years | 61 (5.5%) | 71 (6.7%) |
| 35 to 64 Years | 155 (12.6%) | 33 (3.0%) |
| 65 to 74 Years | 59 (25.9%) | 64 (18.8%) |
| 75 Years and over | 73 (36.9%) | 102 (50.5%) |
Disability Class: Self-Care Difficulty
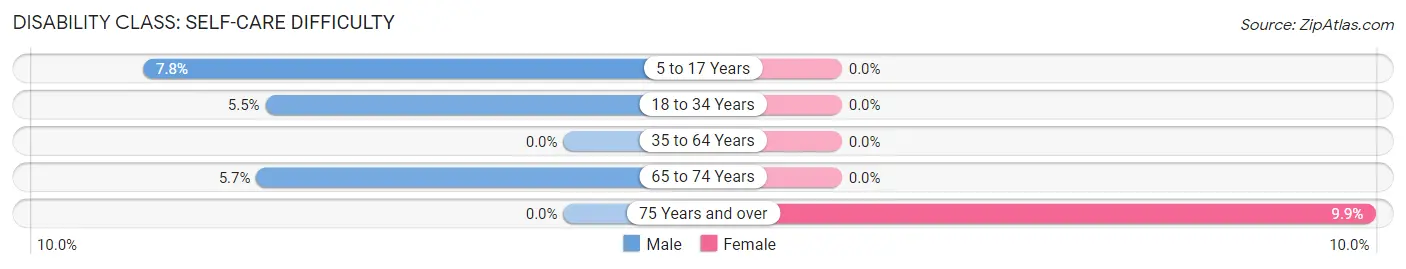
| Age Bracket | Male | Female |
| 5 to 17 Years | 45 (7.8%) | 0 (0.0%) |
| 18 to 34 Years | 61 (5.5%) | 0 (0.0%) |
| 35 to 64 Years | 0 (0.0%) | 0 (0.0%) |
| 65 to 74 Years | 13 (5.7%) | 0 (0.0%) |
| 75 Years and over | 0 (0.0%) | 20 (9.9%) |
Technology Access in Half Moon
Computing Device Access in Half Moon
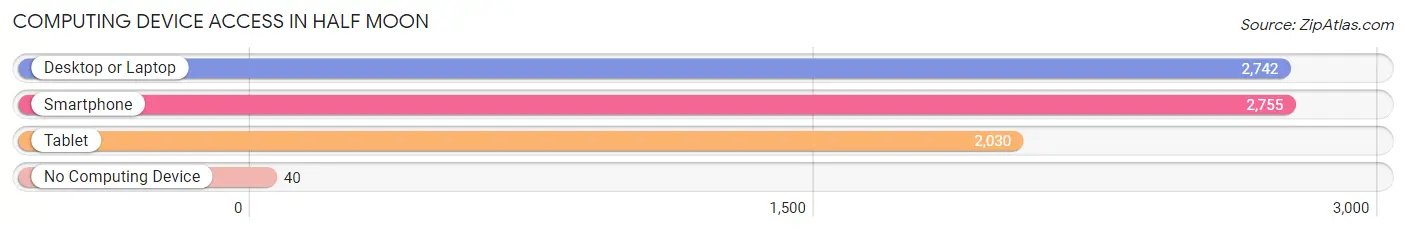
| Device Type | # Households | % Households |
| Desktop or Laptop | 2,742 | 92.5% |
| Smartphone | 2,755 | 92.9% |
| Tablet | 2,030 | 68.5% |
| No Computing Device | 40 | 1.3% |
| Total | 2,965 | 100.0% |
Internet Access in Half Moon
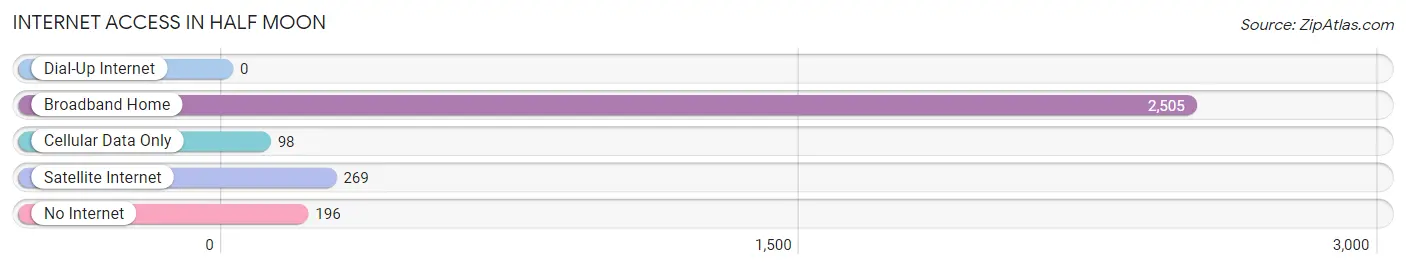
| Internet Type | # Households | % Households |
| Dial-Up Internet | 0 | 0.0% |
| Broadband Home | 2,505 | 84.5% |
| Cellular Data Only | 98 | 3.3% |
| Satellite Internet | 269 | 9.1% |
| No Internet | 196 | 6.6% |
| Total | 2,965 | 100.0% |
Half Moon Summary
Moon, NC is a small town located in the eastern part of North Carolina. It is situated in the Croatan National Forest, and is part of the Outer Banks region. The town has a population of approximately 1,000 people, and is known for its rural charm and natural beauty.
History
Half Moon, NC was first settled in the late 1700s by a group of settlers from the nearby town of New Bern. The settlers were attracted to the area due to its abundance of natural resources, including timber, fish, and game. The town was originally known as “Half Moon Landing”, and was named after the nearby Half Moon Bay. The town was officially incorporated in 1887, and was named after the nearby Half Moon Island.
Geography
Half Moon, NC is located in the eastern part of North Carolina, in the Croatan National Forest. The town is situated on the banks of the Neuse River, and is surrounded by a variety of natural features, including forests, wetlands, and estuaries. The town is located approximately 30 miles from the Atlantic Ocean, and is part of the Outer Banks region.
Economy
Half Moon, NC is a small, rural town, and its economy is largely based on agriculture and tourism. The town is home to several small farms, which produce a variety of crops, including corn, soybeans, and tobacco. The town is also home to several small businesses, including restaurants, shops, and lodging. Tourism is an important part of the local economy, and the town is home to several popular attractions, including the Half Moon Island Wildlife Refuge and the Half Moon Bay Marina.
Demographics
As of the 2010 census, Half Moon, NC had a population of 1,000 people. The population is predominantly white (90.2%), with a small minority population (9.8%). The median household income is $37,500, and the median age is 44. The town is home to a variety of religious denominations, including Baptist, Methodist, and Catholic.
Conclusion
Half Moon, NC is a small, rural town located in the eastern part of North Carolina. The town is known for its rural charm and natural beauty, and is home to a variety of attractions, including the Half Moon Island Wildlife Refuge and the Half Moon Bay Marina. The town’s economy is largely based on agriculture and tourism, and the population is predominantly white. Half Moon, NC is a great place to visit, and is a great example of small-town life in North Carolina.
Common Questions
What is Per Capita Income in Half Moon?
Per Capita income in Half Moon is $31,244.
What is the Median Family Income in Half Moon?
Median Family Income in Half Moon is $77,230.
What is the Median Household income in Half Moon?
Median Household Income in Half Moon is $66,042.
What is Income or Wage Gap in Half Moon?
Income or Wage Gap in Half Moon is 20.8%.
Women in Half Moon earn 79.2 cents for every dollar earned by a man.
What is Inequality or Gini Index in Half Moon?
Inequality or Gini Index in Half Moon is 0.41.
What is the Total Population of Half Moon?
Total Population of Half Moon is 8,381.
What is the Total Male Population of Half Moon?
Total Male Population of Half Moon is 4,375.
What is the Total Female Population of Half Moon?
Total Female Population of Half Moon is 4,006.
What is the Ratio of Males per 100 Females in Half Moon?
There are 109.21 Males per 100 Females in Half Moon.
What is the Ratio of Females per 100 Males in Half Moon?
There are 91.57 Females per 100 Males in Half Moon.
What is the Median Population Age in Half Moon?
Median Population Age in Half Moon is 27.3 Years.
What is the Average Family Size in Half Moon
Average Family Size in Half Moon is 3.2 People.
What is the Average Household Size in Half Moon
Average Household Size in Half Moon is 2.8 People.
How Large is the Labor Force in Half Moon?
There are 4,156 People in the Labor Forcein in Half Moon.
What is the Percentage of People in the Labor Force in Half Moon?
67.6% of People are in the Labor Force in Half Moon.
What is the Unemployment Rate in Half Moon?
Unemployment Rate in Half Moon is 5.7%.