Mount Pleasant, NC Map & Demographics
Mount Pleasant Map
Mount Pleasant Overview
$30,963
PER CAPITA INCOME
$85,714
AVG FAMILY INCOME
$70,313
AVG HOUSEHOLD INCOME
29.6%
WAGE / INCOME GAP [ % ]
70.4¢/ $1
WAGE / INCOME GAP [ $ ]
0.38
INEQUALITY / GINI INDEX
1,776
TOTAL POPULATION
766
MALE POPULATION
1,010
FEMALE POPULATION
75.84
MALES / 100 FEMALES
131.85
FEMALES / 100 MALES
39.1
MEDIAN AGE
3.3
AVG FAMILY SIZE
2.7
AVG HOUSEHOLD SIZE
854
LABOR FORCE [ PEOPLE ]
60.0%
PERCENT IN LABOR FORCE
4.9%
UNEMPLOYMENT RATE
Mount Pleasant Zip Codes
Income in Mount Pleasant
Income Overview in Mount Pleasant
Per Capita Income in Mount Pleasant is $30,963, while median incomes of families and households are $85,714 and $70,313 respectively.
| Characteristic | Number | Measure |
| Per Capita Income | 1,776 | $30,963 |
| Median Family Income | 452 | $85,714 |
| Mean Family Income | 452 | $88,153 |
| Median Household Income | 633 | $70,313 |
| Mean Household Income | 633 | $80,707 |
| Income Deficit | 452 | $0 |
| Wage / Income Gap (%) | 1,776 | 29.62% |
| Wage / Income Gap ($) | 1,776 | 70.38¢ per $1 |
| Gini / Inequality Index | 1,776 | 0.38 |
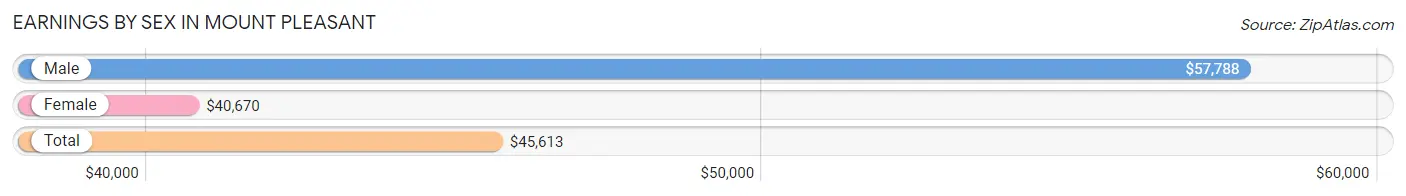
Earnings by Sex in Mount Pleasant
Average Earnings in Mount Pleasant are $45,613, $57,788 for men and $40,670 for women, a difference of 29.6%.
| Sex | Number | Average Earnings |
| Male | 411 (47.7%) | $57,788 |
| Female | 451 (52.3%) | $40,670 |
| Total | 862 (100.0%) | $45,613 |
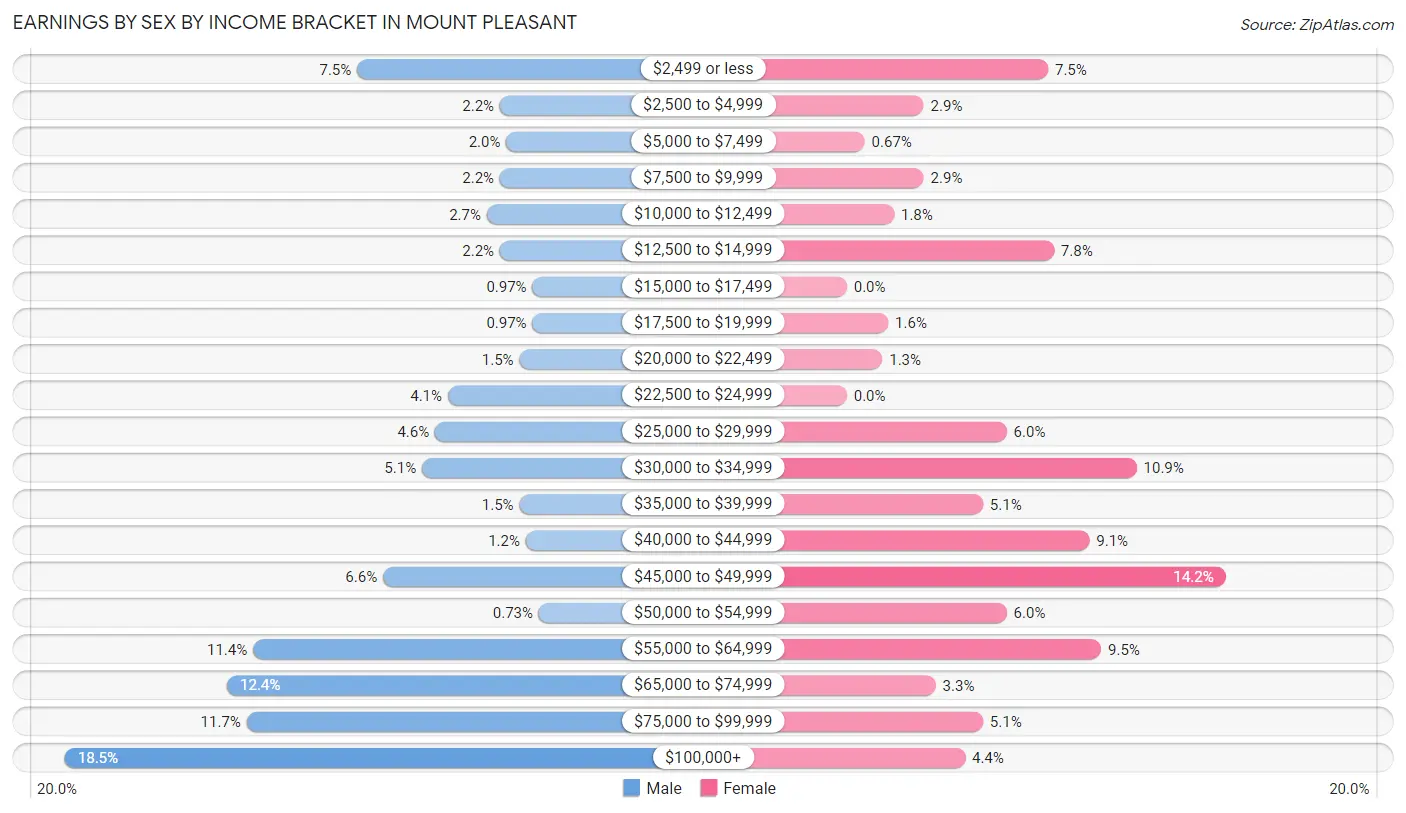
Earnings by Sex by Income Bracket in Mount Pleasant
The most common earnings brackets in Mount Pleasant are $100,000+ for men (76 | 18.5%) and $45,000 to $49,999 for women (64 | 14.2%).
| Income | Male | Female |
| $2,499 or less | 31 (7.5%) | 34 (7.5%) |
| $2,500 to $4,999 | 9 (2.2%) | 13 (2.9%) |
| $5,000 to $7,499 | 8 (1.9%) | 3 (0.7%) |
| $7,500 to $9,999 | 9 (2.2%) | 13 (2.9%) |
| $10,000 to $12,499 | 11 (2.7%) | 8 (1.8%) |
| $12,500 to $14,999 | 9 (2.2%) | 35 (7.8%) |
| $15,000 to $17,499 | 4 (1.0%) | 0 (0.0%) |
| $17,500 to $19,999 | 4 (1.0%) | 7 (1.5%) |
| $20,000 to $22,499 | 6 (1.5%) | 6 (1.3%) |
| $22,500 to $24,999 | 17 (4.1%) | 0 (0.0%) |
| $25,000 to $29,999 | 19 (4.6%) | 27 (6.0%) |
| $30,000 to $34,999 | 21 (5.1%) | 49 (10.9%) |
| $35,000 to $39,999 | 6 (1.5%) | 23 (5.1%) |
| $40,000 to $44,999 | 5 (1.2%) | 41 (9.1%) |
| $45,000 to $49,999 | 27 (6.6%) | 64 (14.2%) |
| $50,000 to $54,999 | 3 (0.7%) | 27 (6.0%) |
| $55,000 to $64,999 | 47 (11.4%) | 43 (9.5%) |
| $65,000 to $74,999 | 51 (12.4%) | 15 (3.3%) |
| $75,000 to $99,999 | 48 (11.7%) | 23 (5.1%) |
| $100,000+ | 76 (18.5%) | 20 (4.4%) |
| Total | 411 (100.0%) | 451 (100.0%) |
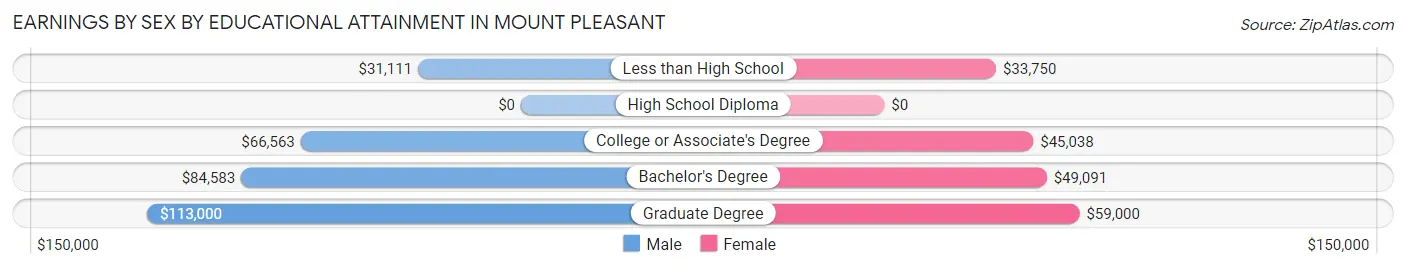
Earnings by Sex by Educational Attainment in Mount Pleasant
Average earnings in Mount Pleasant are $65,391 for men and $42,350 for women, a difference of 35.2%. Men with an educational attainment of graduate degree enjoy the highest average annual earnings of $113,000, while those with less than high school education earn the least with $31,111. Women with an educational attainment of graduate degree earn the most with the average annual earnings of $59,000, while those with less than high school education have the smallest earnings of $33,750.
| Educational Attainment | Male Income | Female Income |
| Less than High School | $31,111 | $33,750 |
| High School Diploma | - | - |
| College or Associate's Degree | $66,563 | $45,038 |
| Bachelor's Degree | $84,583 | $49,091 |
| Graduate Degree | $113,000 | $59,000 |
| Total | $65,391 | $42,350 |
Family Income in Mount Pleasant
Family Income Brackets in Mount Pleasant
According to the Mount Pleasant family income data, there are 149 families falling into the $100,000 to $149,999 income range, which is the most common income bracket and makes up 33.0% of all families. Conversely, the less than $10,000 income bracket is the least frequent group with only 3 families (0.7%) belonging to this category.
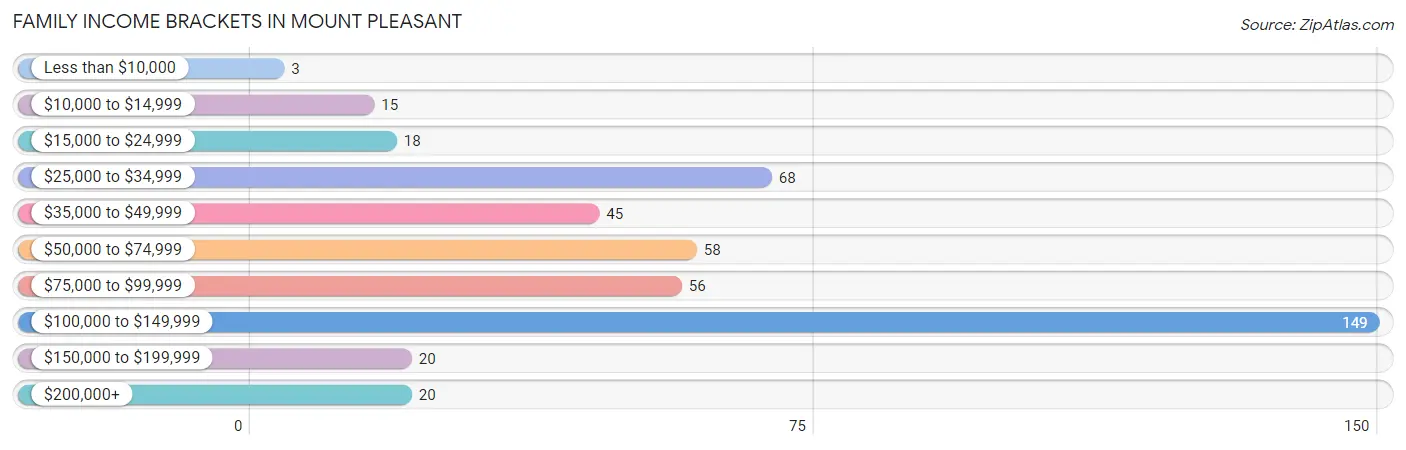
| Income Bracket | # Families | % Families |
| Less than $10,000 | 3 | 0.7% |
| $10,000 to $14,999 | 15 | 3.3% |
| $15,000 to $24,999 | 18 | 4.0% |
| $25,000 to $34,999 | 68 | 15.0% |
| $35,000 to $49,999 | 45 | 10.0% |
| $50,000 to $74,999 | 58 | 12.8% |
| $75,000 to $99,999 | 56 | 12.4% |
| $100,000 to $149,999 | 149 | 33.0% |
| $150,000 to $199,999 | 20 | 4.4% |
| $200,000+ | 20 | 4.4% |
Family Income by Famaliy Size in Mount Pleasant
4-person families (113 | 25.0%) account for the highest median family income in Mount Pleasant with $108,750 per family, while 3-person families (86 | 19.0%) have the highest median income of $34,444 per family member.
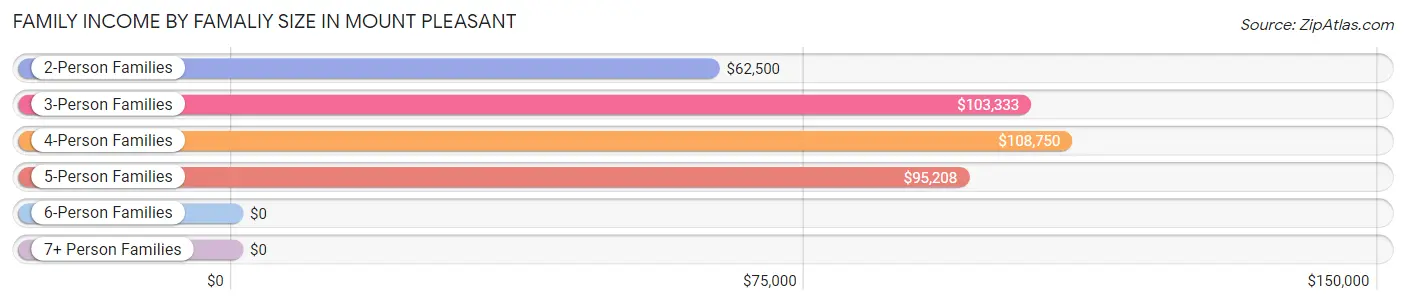
| Income Bracket | # Families | Median Income |
| 2-Person Families | 212 (46.9%) | $62,500 |
| 3-Person Families | 86 (19.0%) | $103,333 |
| 4-Person Families | 113 (25.0%) | $108,750 |
| 5-Person Families | 31 (6.9%) | $95,208 |
| 6-Person Families | 10 (2.2%) | $0 |
| 7+ Person Families | 0 (0.0%) | $0 |
| Total | 452 (100.0%) | $85,714 |
Family Income by Number of Earners in Mount Pleasant
The median family income in Mount Pleasant is $85,714, with families comprising 3+ earners (21) having the highest median family income of $113,438, while families with no earners (94) have the lowest median family income of $28,708, accounting for 4.6% and 20.8% of families, respectively.
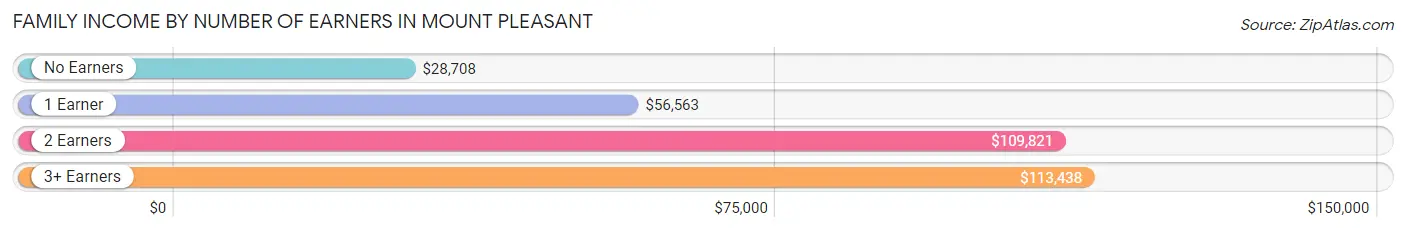
| Number of Earners | # Families | Median Income |
| No Earners | 94 (20.8%) | $28,708 |
| 1 Earner | 106 (23.4%) | $56,563 |
| 2 Earners | 231 (51.1%) | $109,821 |
| 3+ Earners | 21 (4.6%) | $113,438 |
| Total | 452 (100.0%) | $85,714 |
Household Income in Mount Pleasant
Household Income Brackets in Mount Pleasant
With 161 households falling in the category, the $100,000 to $149,999 income range is the most frequent in Mount Pleasant, accounting for 25.4% of all households. In contrast, only 18 households (2.8%) fall into the $150,000 to $199,999 income bracket, making it the least populous group.
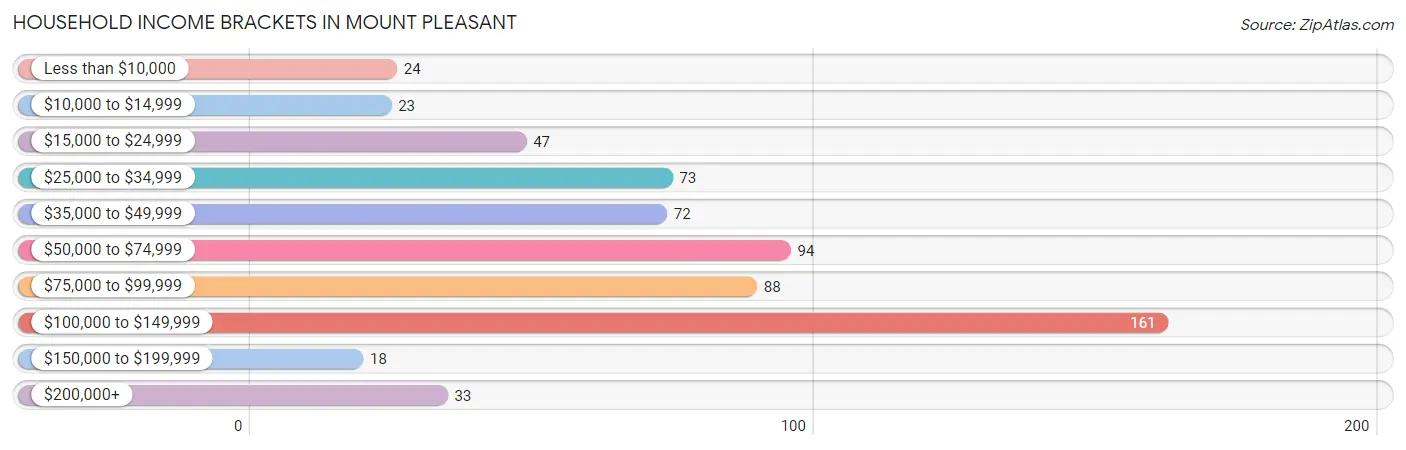
| Income Bracket | # Households | % Households |
| Less than $10,000 | 24 | 3.8% |
| $10,000 to $14,999 | 23 | 3.6% |
| $15,000 to $24,999 | 47 | 7.4% |
| $25,000 to $34,999 | 73 | 11.5% |
| $35,000 to $49,999 | 72 | 11.4% |
| $50,000 to $74,999 | 94 | 14.8% |
| $75,000 to $99,999 | 88 | 13.9% |
| $100,000 to $149,999 | 161 | 25.4% |
| $150,000 to $199,999 | 18 | 2.8% |
| $200,000+ | 33 | 5.2% |
Household Income by Householder Age in Mount Pleasant
The median household income in Mount Pleasant is $70,313, with the highest median household income of $101,146 found in the 25 to 44 years age bracket for the primary householder. A total of 225 households (35.5%) fall into this category. Meanwhile, the 65+ years age bracket for the primary householder has the lowest median household income of $29,500, with 182 households (28.7%) in this group.
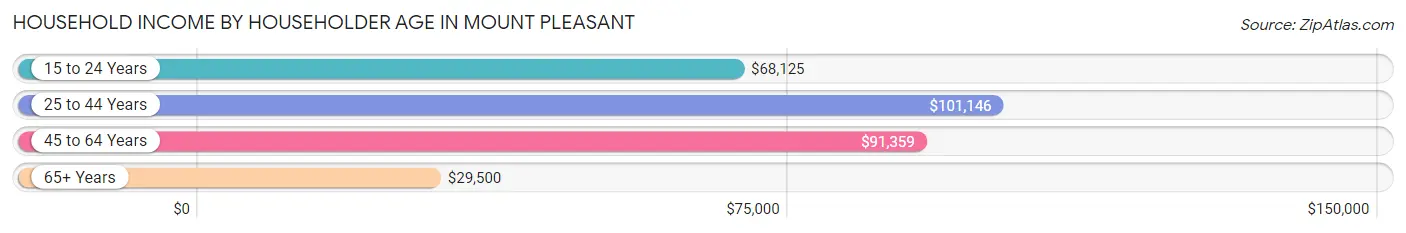
| Income Bracket | # Households | Median Income |
| 15 to 24 Years | 9 (1.4%) | $68,125 |
| 25 to 44 Years | 225 (35.5%) | $101,146 |
| 45 to 64 Years | 217 (34.3%) | $91,359 |
| 65+ Years | 182 (28.7%) | $29,500 |
| Total | 633 (100.0%) | $70,313 |
Poverty in Mount Pleasant
Income Below Poverty by Sex and Age in Mount Pleasant
With 5.9% poverty level for males and 9.7% for females among the residents of Mount Pleasant, 12 to 14 year old males and 18 to 24 year old females are the most vulnerable to poverty, with 15 males (34.1%) and 18 females (37.5%) in their respective age groups living below the poverty level.
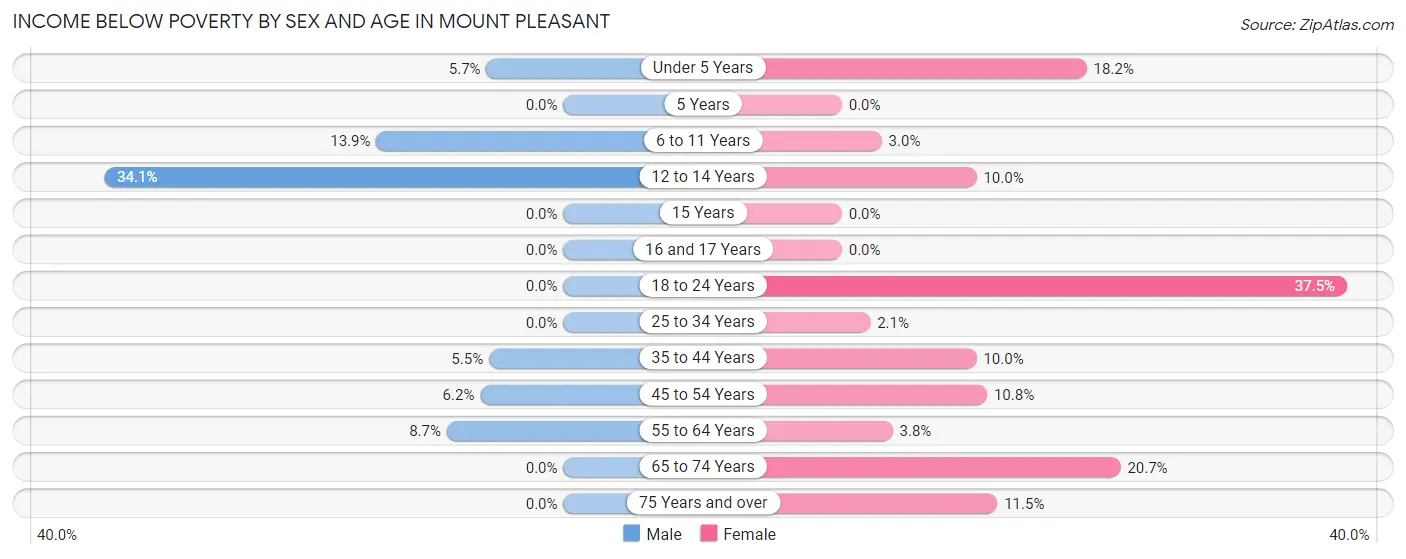
| Age Bracket | Male | Female |
| Under 5 Years | 2 (5.7%) | 4 (18.2%) |
| 5 Years | 0 (0.0%) | 0 (0.0%) |
| 6 to 11 Years | 5 (13.9%) | 4 (3.0%) |
| 12 to 14 Years | 15 (34.1%) | 5 (10.0%) |
| 15 Years | 0 (0.0%) | 0 (0.0%) |
| 16 and 17 Years | 0 (0.0%) | 0 (0.0%) |
| 18 to 24 Years | 0 (0.0%) | 18 (37.5%) |
| 25 to 34 Years | 0 (0.0%) | 3 (2.1%) |
| 35 to 44 Years | 8 (5.5%) | 17 (10.0%) |
| 45 to 54 Years | 5 (6.2%) | 11 (10.8%) |
| 55 to 64 Years | 9 (8.6%) | 2 (3.8%) |
| 65 to 74 Years | 0 (0.0%) | 18 (20.7%) |
| 75 Years and over | 0 (0.0%) | 12 (11.5%) |
| Total | 44 (5.9%) | 94 (9.7%) |
Income Above Poverty by Sex and Age in Mount Pleasant
According to the poverty statistics in Mount Pleasant, males aged 5 years and females aged 5 years are the age groups that are most secure financially, with 100.0% of males and 100.0% of females in these age groups living above the poverty line.
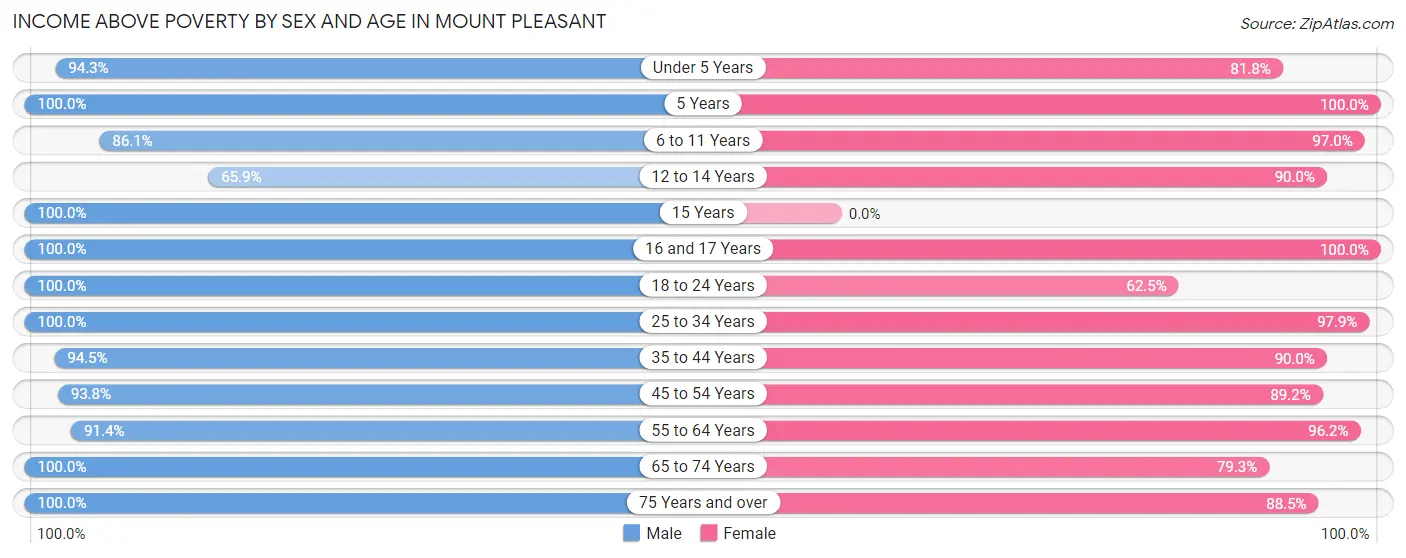
| Age Bracket | Male | Female |
| Under 5 Years | 33 (94.3%) | 18 (81.8%) |
| 5 Years | 5 (100.0%) | 8 (100.0%) |
| 6 to 11 Years | 31 (86.1%) | 131 (97.0%) |
| 12 to 14 Years | 29 (65.9%) | 45 (90.0%) |
| 15 Years | 15 (100.0%) | 0 (0.0%) |
| 16 and 17 Years | 32 (100.0%) | 50 (100.0%) |
| 18 to 24 Years | 62 (100.0%) | 30 (62.5%) |
| 25 to 34 Years | 71 (100.0%) | 139 (97.9%) |
| 35 to 44 Years | 137 (94.5%) | 153 (90.0%) |
| 45 to 54 Years | 76 (93.8%) | 91 (89.2%) |
| 55 to 64 Years | 95 (91.3%) | 51 (96.2%) |
| 65 to 74 Years | 40 (100.0%) | 69 (79.3%) |
| 75 Years and over | 79 (100.0%) | 92 (88.5%) |
| Total | 705 (94.1%) | 877 (90.3%) |
Income Below Poverty Among Married-Couple Families in Mount Pleasant
The poverty statistics for married-couple families in Mount Pleasant show that 1.4% or 5 of the total 355 families live below the poverty line. Families with 1 or 2 children have the highest poverty rate of 4.0%, comprising of 5 families. On the other hand, families with no children have the lowest poverty rate of 0.0%, which includes 0 families.
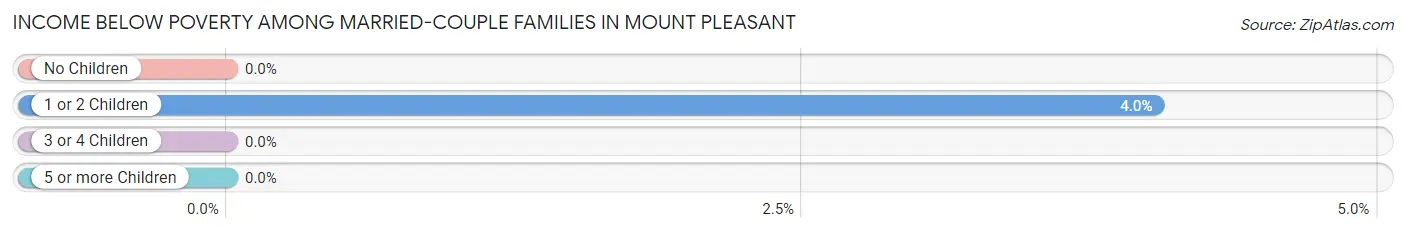
| Children | Above Poverty | Below Poverty |
| No Children | 204 (100.0%) | 0 (0.0%) |
| 1 or 2 Children | 119 (96.0%) | 5 (4.0%) |
| 3 or 4 Children | 27 (100.0%) | 0 (0.0%) |
| 5 or more Children | 0 (0.0%) | 0 (0.0%) |
| Total | 350 (98.6%) | 5 (1.4%) |
Income Below Poverty Among Single-Parent Households in Mount Pleasant
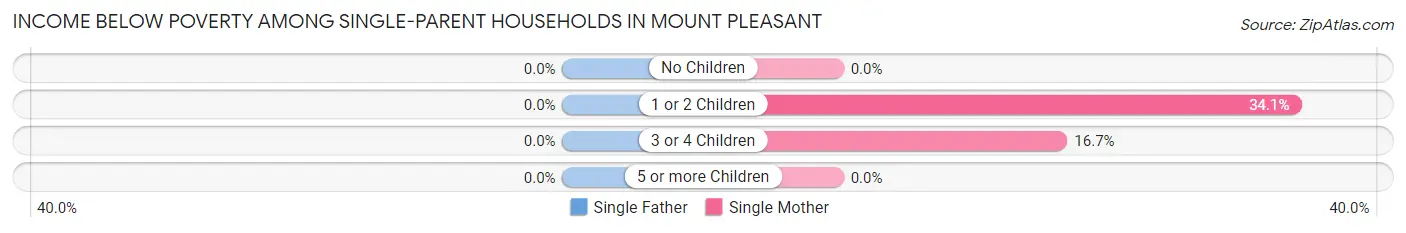
| Children | Single Father | Single Mother |
| No Children | 0 (0.0%) | 0 (0.0%) |
| 1 or 2 Children | 0 (0.0%) | 15 (34.1%) |
| 3 or 4 Children | 0 (0.0%) | 3 (16.7%) |
| 5 or more Children | 0 (0.0%) | 0 (0.0%) |
| Total | 0 (0.0%) | 18 (21.7%) |
Income Below Poverty Among Married-Couple vs Single-Parent Households in Mount Pleasant
The poverty data for Mount Pleasant shows that 5 of the married-couple family households (1.4%) and 18 of the single-parent households (18.6%) are living below the poverty level. Within the married-couple family households, those with 1 or 2 children have the highest poverty rate, with 5 households (4.0%) falling below the poverty line. Among the single-parent households, those with 1 or 2 children have the highest poverty rate, with 15 household (28.3%) living below poverty.
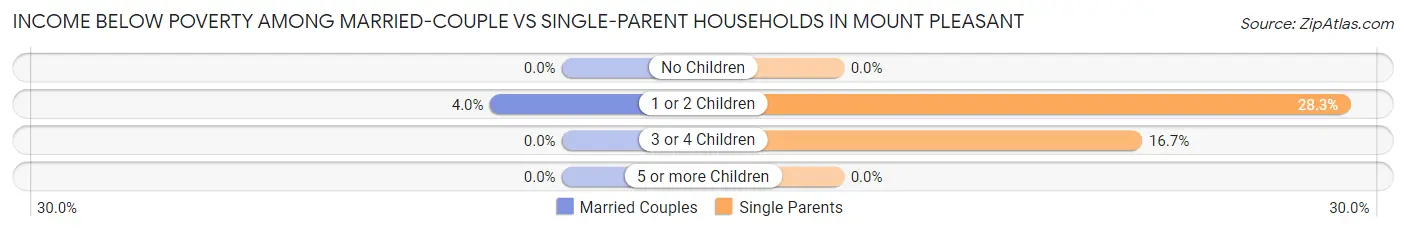
| Children | Married-Couple Families | Single-Parent Households |
| No Children | 0 (0.0%) | 0 (0.0%) |
| 1 or 2 Children | 5 (4.0%) | 15 (28.3%) |
| 3 or 4 Children | 0 (0.0%) | 3 (16.7%) |
| 5 or more Children | 0 (0.0%) | 0 (0.0%) |
| Total | 5 (1.4%) | 18 (18.6%) |
Race in Mount Pleasant
The most populous races in Mount Pleasant are White / Caucasian (1,532 | 86.3%), Black / African American (173 | 9.7%), and Hispanic or Latino (104 | 5.9%).
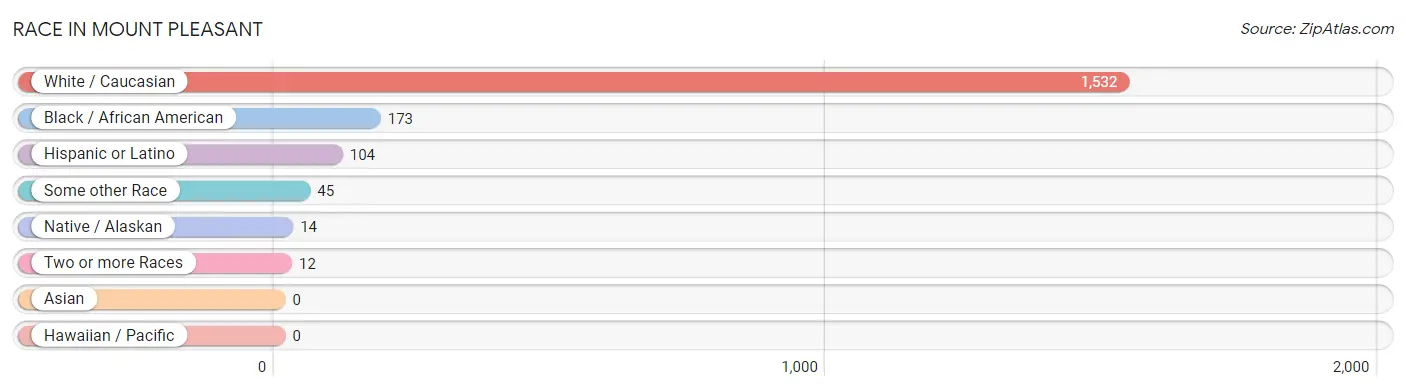
| Race | # Population | % Population |
| Asian | 0 | 0.0% |
| Black / African American | 173 | 9.7% |
| Hawaiian / Pacific | 0 | 0.0% |
| Hispanic or Latino | 104 | 5.9% |
| Native / Alaskan | 14 | 0.8% |
| White / Caucasian | 1,532 | 86.3% |
| Two or more Races | 12 | 0.7% |
| Some other Race | 45 | 2.5% |
| Total | 1,776 | 100.0% |
Ancestry in Mount Pleasant
The most populous ancestries reported in Mount Pleasant are American (423 | 23.8%), German (249 | 14.0%), English (177 | 10.0%), Irish (105 | 5.9%), and Scottish (72 | 4.1%), together accounting for 57.8% of all Mount Pleasant residents.
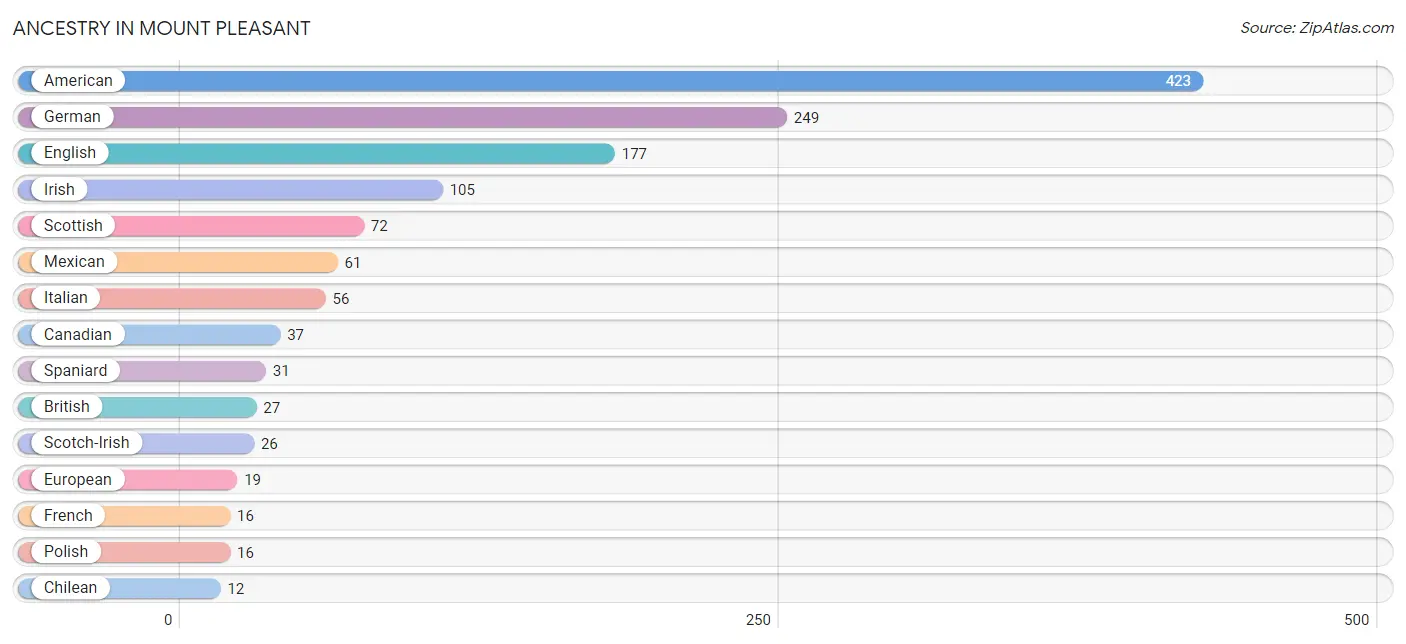
| Ancestry | # Population | % Population |
| American | 423 | 23.8% |
| Arab | 4 | 0.2% |
| Austrian | 4 | 0.2% |
| British | 27 | 1.5% |
| Canadian | 37 | 2.1% |
| Chilean | 12 | 0.7% |
| Czech | 5 | 0.3% |
| Dutch | 6 | 0.3% |
| English | 177 | 10.0% |
| European | 19 | 1.1% |
| French | 16 | 0.9% |
| German | 249 | 14.0% |
| Hungarian | 11 | 0.6% |
| Irish | 105 | 5.9% |
| Italian | 56 | 3.2% |
| Lebanese | 4 | 0.2% |
| Mexican | 61 | 3.4% |
| Norwegian | 9 | 0.5% |
| Polish | 16 | 0.9% |
| Russian | 4 | 0.2% |
| Scotch-Irish | 26 | 1.5% |
| Scottish | 72 | 4.1% |
| South American | 12 | 0.7% |
| Spaniard | 31 | 1.8% |
| Swedish | 8 | 0.4% |
| Swiss | 5 | 0.3% | View All 26 Rows |
Immigrants in Mount Pleasant
The most numerous immigrant groups reported in Mount Pleasant came from Central America (24 | 1.3%), Latin America (24 | 1.3%), Europe (13 | 0.7%), Guatemala (12 | 0.7%), and Mexico (12 | 0.7%), together accounting for 4.8% of all Mount Pleasant residents.
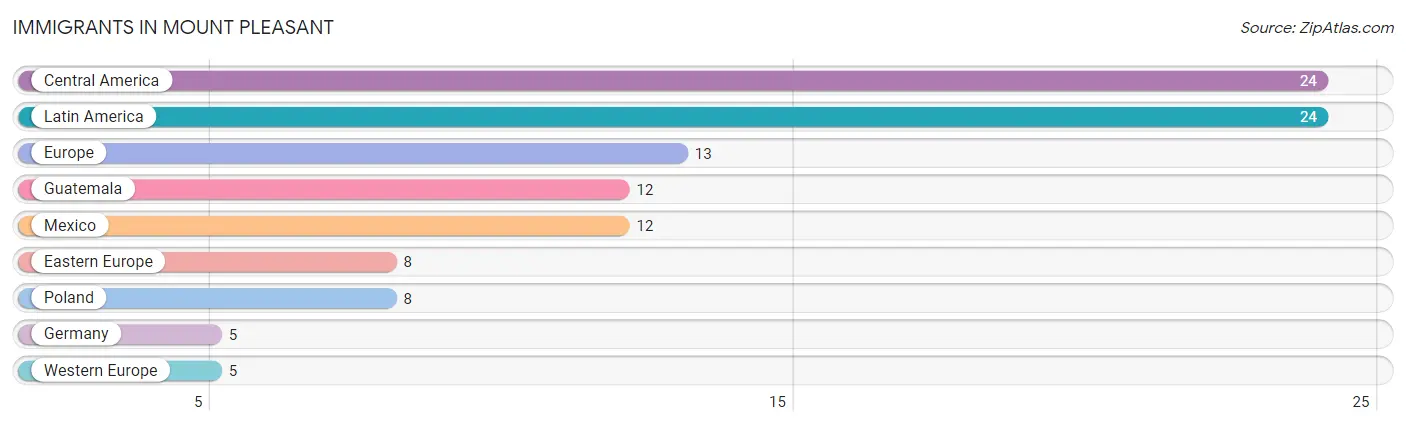
| Immigration Origin | # Population | % Population |
| Central America | 24 | 1.3% |
| Eastern Europe | 8 | 0.4% |
| Europe | 13 | 0.7% |
| Germany | 5 | 0.3% |
| Guatemala | 12 | 0.7% |
| Latin America | 24 | 1.3% |
| Mexico | 12 | 0.7% |
| Poland | 8 | 0.4% |
| Western Europe | 5 | 0.3% | View All 9 Rows |
Sex and Age in Mount Pleasant
Sex and Age in Mount Pleasant
The most populous age groups in Mount Pleasant are 35 to 39 Years (93 | 12.1%) for men and 40 to 44 Years (120 | 11.9%) for women.
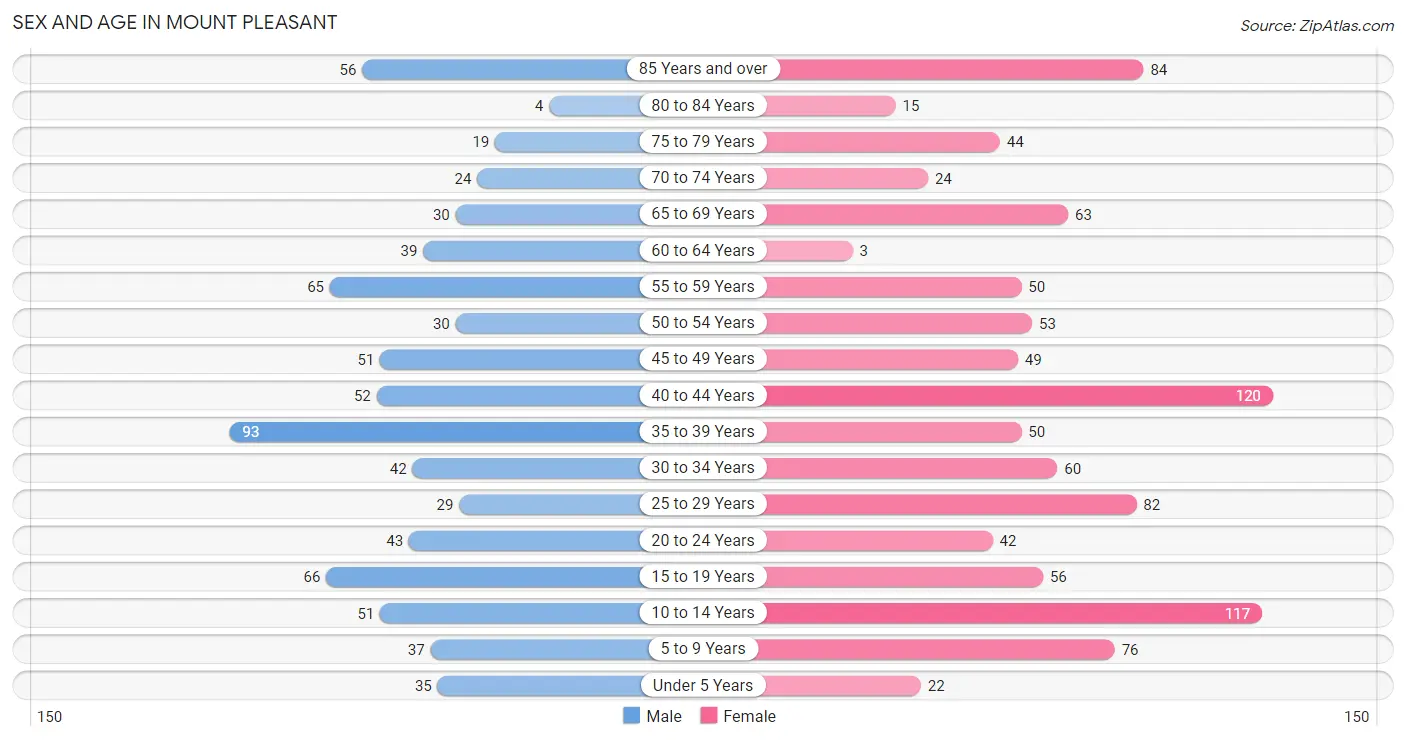
| Age Bracket | Male | Female |
| Under 5 Years | 35 (4.6%) | 22 (2.2%) |
| 5 to 9 Years | 37 (4.8%) | 76 (7.5%) |
| 10 to 14 Years | 51 (6.7%) | 117 (11.6%) |
| 15 to 19 Years | 66 (8.6%) | 56 (5.5%) |
| 20 to 24 Years | 43 (5.6%) | 42 (4.2%) |
| 25 to 29 Years | 29 (3.8%) | 82 (8.1%) |
| 30 to 34 Years | 42 (5.5%) | 60 (5.9%) |
| 35 to 39 Years | 93 (12.1%) | 50 (5.0%) |
| 40 to 44 Years | 52 (6.8%) | 120 (11.9%) |
| 45 to 49 Years | 51 (6.7%) | 49 (4.9%) |
| 50 to 54 Years | 30 (3.9%) | 53 (5.2%) |
| 55 to 59 Years | 65 (8.5%) | 50 (5.0%) |
| 60 to 64 Years | 39 (5.1%) | 3 (0.3%) |
| 65 to 69 Years | 30 (3.9%) | 63 (6.2%) |
| 70 to 74 Years | 24 (3.1%) | 24 (2.4%) |
| 75 to 79 Years | 19 (2.5%) | 44 (4.4%) |
| 80 to 84 Years | 4 (0.5%) | 15 (1.5%) |
| 85 Years and over | 56 (7.3%) | 84 (8.3%) |
| Total | 766 (100.0%) | 1,010 (100.0%) |
Families and Households in Mount Pleasant
Median Family Size in Mount Pleasant
The median family size in Mount Pleasant is 3.29 persons per family, with single female/mother families (83 | 18.4%) accounting for the largest median family size of 3.92 persons per family. On the other hand, married-couple families (355 | 78.5%) represent the smallest median family size with 3.14 persons per family.
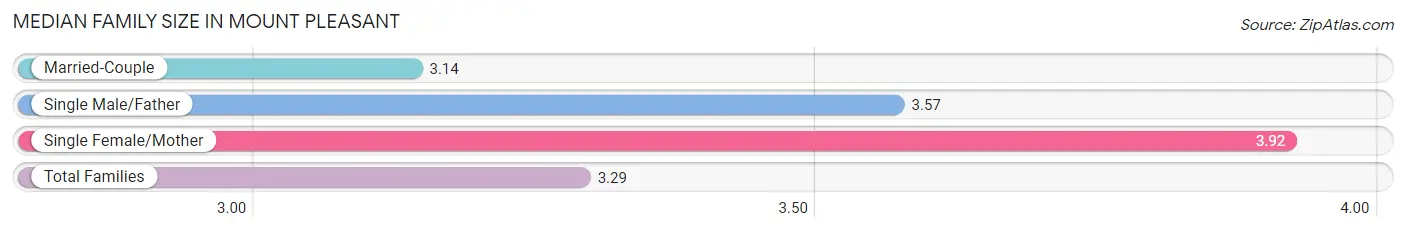
| Family Type | # Families | Family Size |
| Married-Couple | 355 (78.5%) | 3.14 |
| Single Male/Father | 14 (3.1%) | 3.57 |
| Single Female/Mother | 83 (18.4%) | 3.92 |
| Total Families | 452 (100.0%) | 3.29 |
Median Household Size in Mount Pleasant
The median household size in Mount Pleasant is 2.71 persons per household, with single female/mother households (83 | 13.1%) accounting for the largest median household size of 4.05 persons per household. non-family households (181 | 28.6%) represent the smallest median household size with 1.17 persons per household.
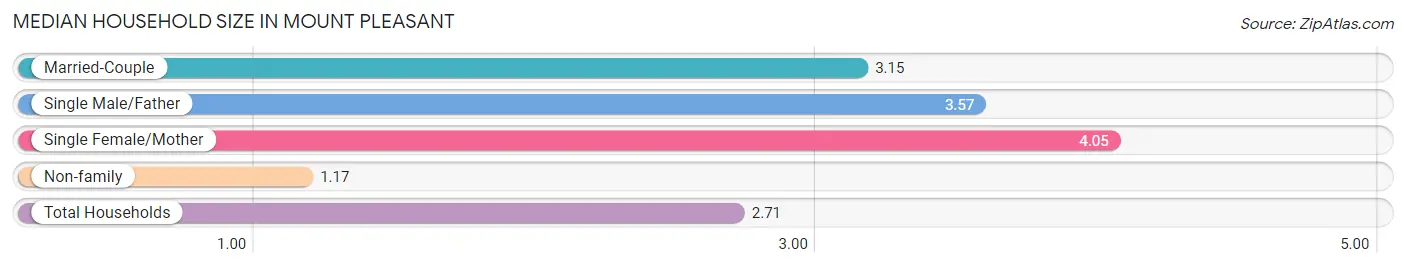
| Household Type | # Households | Household Size |
| Married-Couple | 355 (56.1%) | 3.15 |
| Single Male/Father | 14 (2.2%) | 3.57 |
| Single Female/Mother | 83 (13.1%) | 4.05 |
| Non-family | 181 (28.6%) | 1.17 |
| Total Households | 633 (100.0%) | 2.71 |
Household Size by Marriage Status in Mount Pleasant
Out of a total of 633 households in Mount Pleasant, 452 (71.4%) are family households, while 181 (28.6%) are nonfamily households. The most numerous type of family households are 2-person households, comprising 206, and the most common type of nonfamily households are 1-person households, comprising 152.
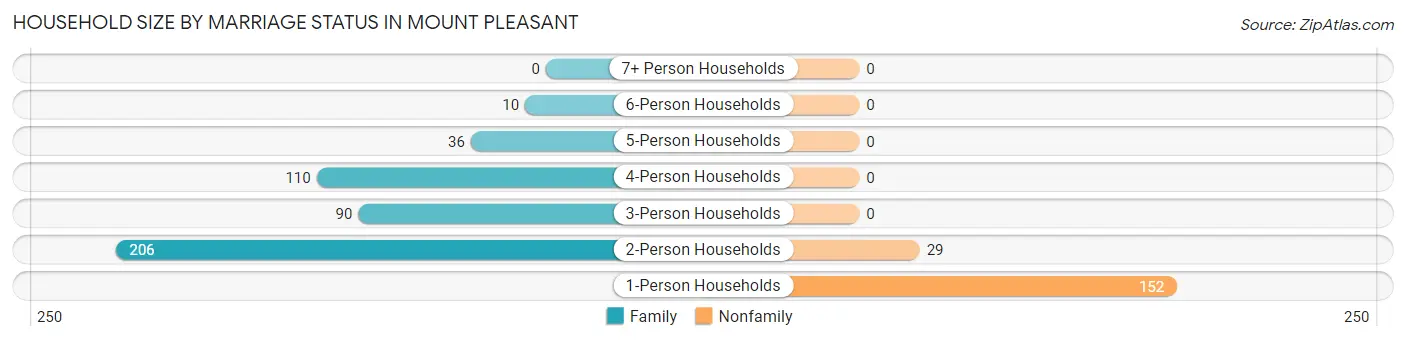
| Household Size | Family Households | Nonfamily Households |
| 1-Person Households | - | 152 (24.0%) |
| 2-Person Households | 206 (32.5%) | 29 (4.6%) |
| 3-Person Households | 90 (14.2%) | 0 (0.0%) |
| 4-Person Households | 110 (17.4%) | 0 (0.0%) |
| 5-Person Households | 36 (5.7%) | 0 (0.0%) |
| 6-Person Households | 10 (1.6%) | 0 (0.0%) |
| 7+ Person Households | 0 (0.0%) | 0 (0.0%) |
| Total | 452 (71.4%) | 181 (28.6%) |
Female Fertility in Mount Pleasant
Fertility by Age in Mount Pleasant
Average fertility rate in Mount Pleasant is 25.0 births per 1,000 women. Women in the age bracket of 20 to 34 years have the highest fertility rate with 65.0 births per 1,000 women. Women in the age bracket of 20 to 34 years acount for 100.0% of all women with births.
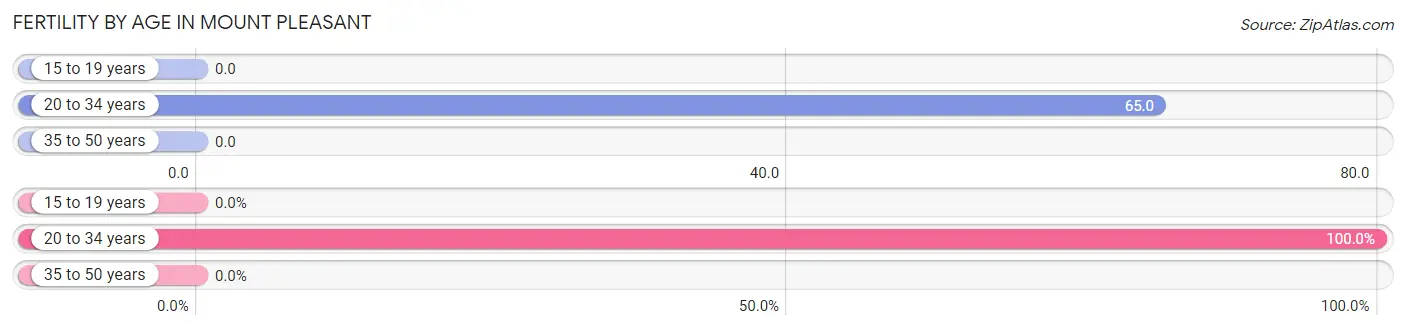
| Age Bracket | Women with Births | Births / 1,000 Women |
| 15 to 19 years | 0 (0.0%) | 0.0 |
| 20 to 34 years | 12 (100.0%) | 65.0 |
| 35 to 50 years | 0 (0.0%) | 0.0 |
| Total | 12 (100.0%) | 25.0 |
Fertility by Age by Marriage Status in Mount Pleasant
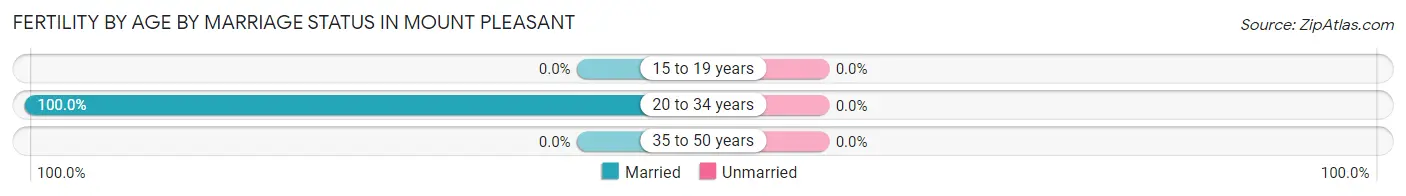
| Age Bracket | Married | Unmarried |
| 15 to 19 years | 0 (0.0%) | 0 (0.0%) |
| 20 to 34 years | 12 (100.0%) | 0 (0.0%) |
| 35 to 50 years | 0 (0.0%) | 0 (0.0%) |
| Total | 12 (100.0%) | 0 (0.0%) |
Fertility by Education in Mount Pleasant
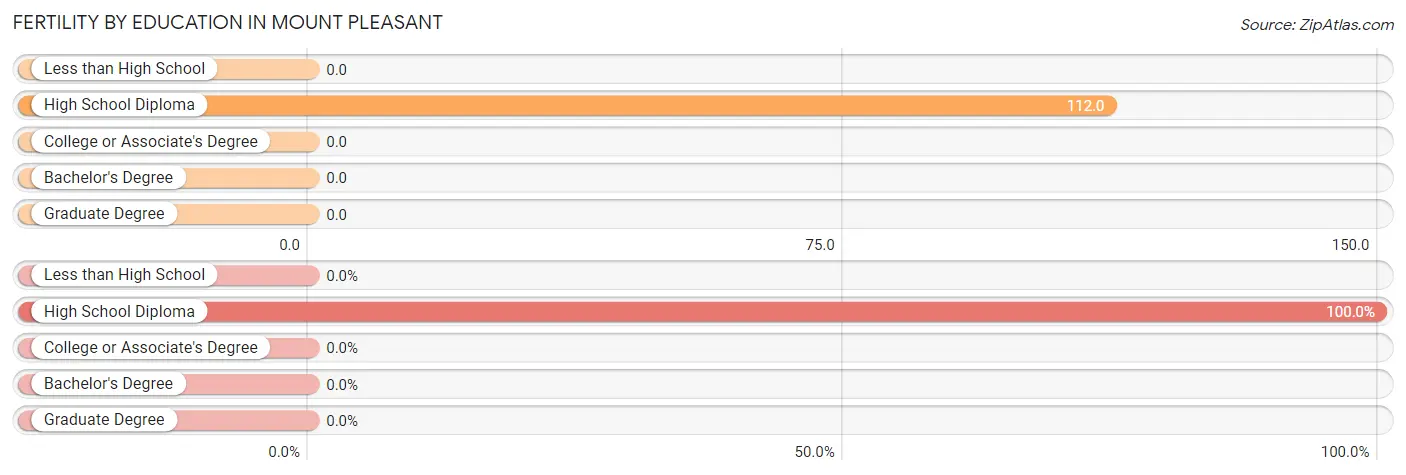
| Educational Attainment | Women with Births | Births / 1,000 Women |
| Less than High School | 0 (0.0%) | 0.0 |
| High School Diploma | 12 (100.0%) | 112.0 |
| College or Associate's Degree | 0 (0.0%) | 0.0 |
| Bachelor's Degree | 0 (0.0%) | 0.0 |
| Graduate Degree | 0 (0.0%) | 0.0 |
| Total | 12 (100.0%) | 25.0 |
Fertility by Education by Marriage Status in Mount Pleasant
| Educational Attainment | Married | Unmarried |
| Less than High School | 0 (0.0%) | 0 (0.0%) |
| High School Diploma | 12 (100.0%) | 0 (0.0%) |
| College or Associate's Degree | 0 (0.0%) | 0 (0.0%) |
| Bachelor's Degree | 0 (0.0%) | 0 (0.0%) |
| Graduate Degree | 0 (0.0%) | 0 (0.0%) |
| Total | 12 (100.0%) | 0 (0.0%) |
Employment Characteristics in Mount Pleasant
Employment by Class of Employer in Mount Pleasant
Among the 799 employed individuals in Mount Pleasant, private company employees (491 | 61.5%), local government employees (129 | 16.2%), and not-for-profit organizations (59 | 7.4%) make up the most common classes of employment.
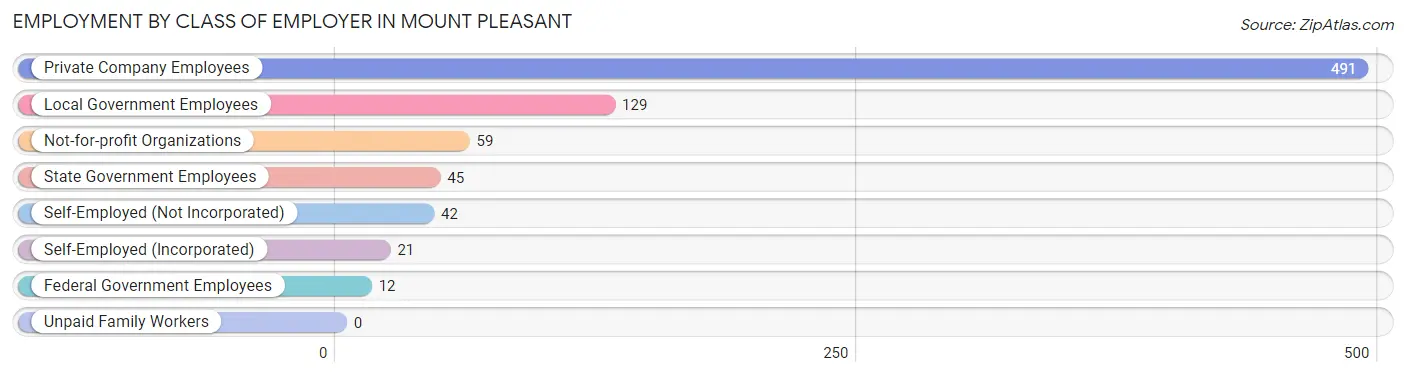
| Employer Class | # Employees | % Employees |
| Private Company Employees | 491 | 61.5% |
| Self-Employed (Incorporated) | 21 | 2.6% |
| Self-Employed (Not Incorporated) | 42 | 5.3% |
| Not-for-profit Organizations | 59 | 7.4% |
| Local Government Employees | 129 | 16.2% |
| State Government Employees | 45 | 5.6% |
| Federal Government Employees | 12 | 1.5% |
| Unpaid Family Workers | 0 | 0.0% |
| Total | 799 | 100.0% |
Employment Status by Age in Mount Pleasant
According to the labor force statistics for Mount Pleasant, out of the total population over 16 years of age (1,423), 60.0% or 854 individuals are in the labor force, with 4.9% or 42 of them unemployed. The age group with the highest labor force participation rate is 30 to 34 years, with 92.2% or 94 individuals in the labor force. Within the labor force, the 20 to 24 years age range has the highest percentage of unemployed individuals, with 15.5% or 9 of them being unemployed.
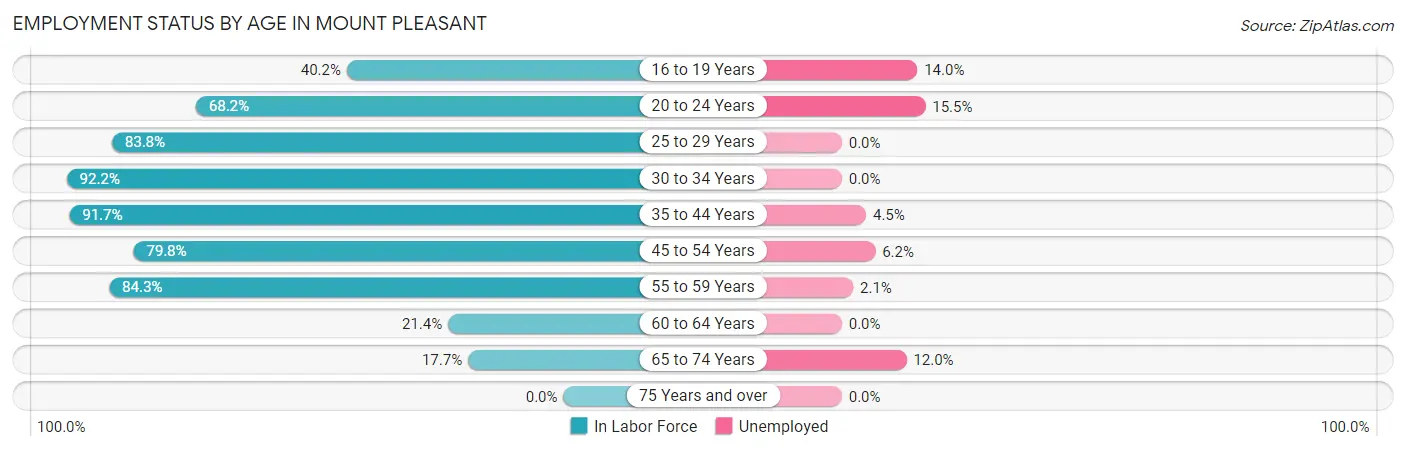
| Age Bracket | In Labor Force | Unemployed |
| 16 to 19 Years | 43 (40.2%) | 6 (14.0%) |
| 20 to 24 Years | 58 (68.2%) | 9 (15.5%) |
| 25 to 29 Years | 93 (83.8%) | 0 (0.0%) |
| 30 to 34 Years | 94 (92.2%) | 0 (0.0%) |
| 35 to 44 Years | 289 (91.7%) | 13 (4.5%) |
| 45 to 54 Years | 146 (79.8%) | 9 (6.2%) |
| 55 to 59 Years | 97 (84.3%) | 2 (2.1%) |
| 60 to 64 Years | 9 (21.4%) | 0 (0.0%) |
| 65 to 74 Years | 25 (17.7%) | 3 (12.0%) |
| 75 Years and over | 0 (0.0%) | 0 (0.0%) |
| Total | 854 (60.0%) | 42 (4.9%) |
Employment Status by Educational Attainment in Mount Pleasant
According to labor force statistics for Mount Pleasant, 83.9% of individuals (728) out of the total population between 25 and 64 years of age (868) are in the labor force, with 3.3% or 24 of them being unemployed. The group with the highest labor force participation rate are those with the educational attainment of bachelor's degree or higher, with 89.1% or 221 individuals in the labor force. Within the labor force, individuals with high school diploma education have the highest percentage of unemployment, with 9.2% or 17 of them being unemployed.
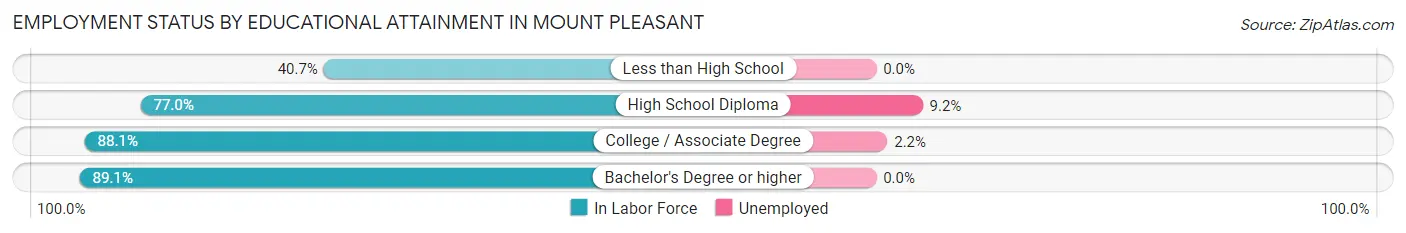
| Educational Attainment | In Labor Force | Unemployed |
| Less than High School | 11 (40.7%) | 0 (0.0%) |
| High School Diploma | 184 (77.0%) | 22 (9.2%) |
| College / Associate Degree | 312 (88.1%) | 8 (2.2%) |
| Bachelor's Degree or higher | 221 (89.1%) | 0 (0.0%) |
| Total | 728 (83.9%) | 29 (3.3%) |
Employment Occupations by Sex in Mount Pleasant
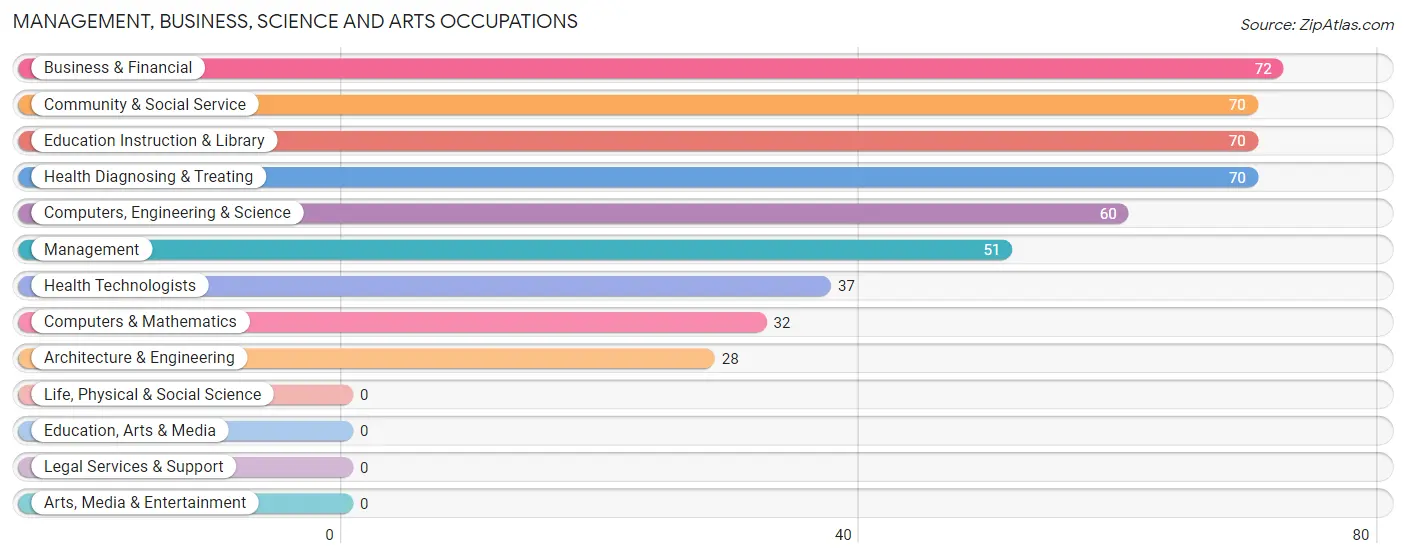
Management, Business, Science and Arts Occupations
The most common Management, Business, Science and Arts occupations in Mount Pleasant are Business & Financial (72 | 8.9%), Community & Social Service (70 | 8.6%), Education Instruction & Library (70 | 8.6%), Health Diagnosing & Treating (70 | 8.6%), and Computers, Engineering & Science (60 | 7.4%).
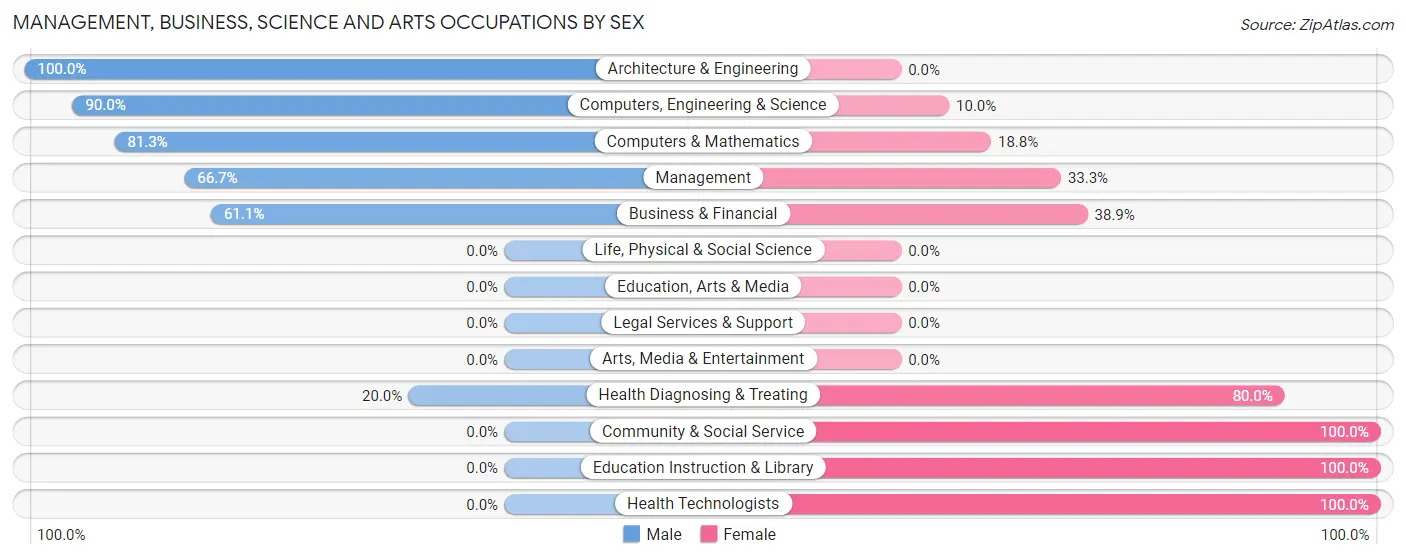
Management, Business, Science and Arts Occupations by Sex
Within the Management, Business, Science and Arts occupations in Mount Pleasant, the most male-oriented occupations are Architecture & Engineering (100.0%), Computers, Engineering & Science (90.0%), and Computers & Mathematics (81.2%), while the most female-oriented occupations are Community & Social Service (100.0%), Education Instruction & Library (100.0%), and Health Technologists (100.0%).
| Occupation | Male | Female |
| Management | 34 (66.7%) | 17 (33.3%) |
| Business & Financial | 44 (61.1%) | 28 (38.9%) |
| Computers, Engineering & Science | 54 (90.0%) | 6 (10.0%) |
| Computers & Mathematics | 26 (81.2%) | 6 (18.8%) |
| Architecture & Engineering | 28 (100.0%) | 0 (0.0%) |
| Life, Physical & Social Science | 0 (0.0%) | 0 (0.0%) |
| Community & Social Service | 0 (0.0%) | 70 (100.0%) |
| Education, Arts & Media | 0 (0.0%) | 0 (0.0%) |
| Legal Services & Support | 0 (0.0%) | 0 (0.0%) |
| Education Instruction & Library | 0 (0.0%) | 70 (100.0%) |
| Arts, Media & Entertainment | 0 (0.0%) | 0 (0.0%) |
| Health Diagnosing & Treating | 14 (20.0%) | 56 (80.0%) |
| Health Technologists | 0 (0.0%) | 37 (100.0%) |
| Total (Category) | 146 (45.2%) | 177 (54.8%) |
| Total (Overall) | 382 (47.0%) | 430 (53.0%) |
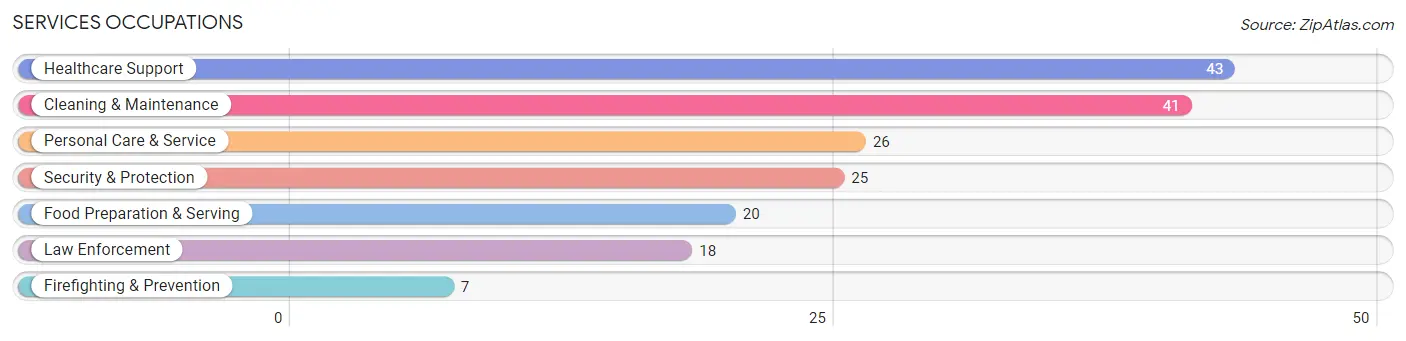
Services Occupations
The most common Services occupations in Mount Pleasant are Healthcare Support (43 | 5.3%), Cleaning & Maintenance (41 | 5.1%), Personal Care & Service (26 | 3.2%), Security & Protection (25 | 3.1%), and Food Preparation & Serving (20 | 2.5%).
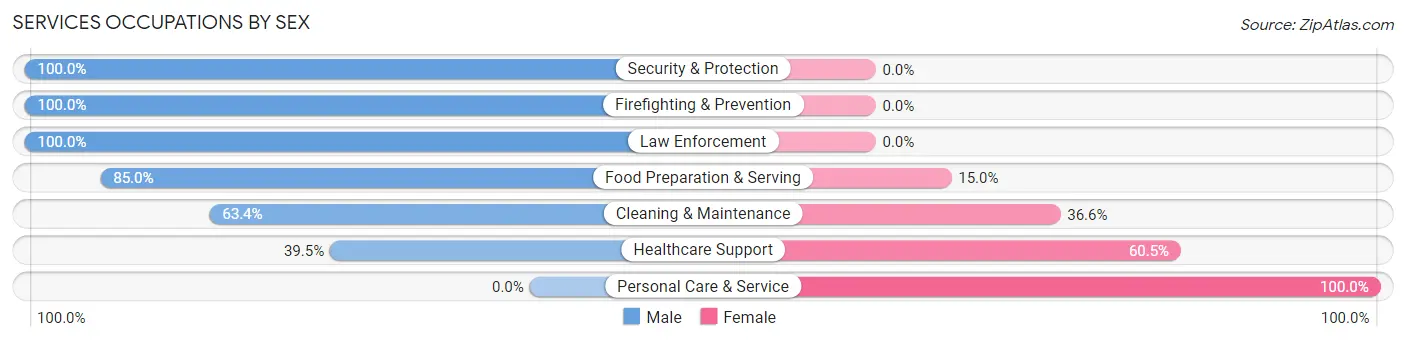
Services Occupations by Sex
Within the Services occupations in Mount Pleasant, the most male-oriented occupations are Security & Protection (100.0%), Firefighting & Prevention (100.0%), and Law Enforcement (100.0%), while the most female-oriented occupations are Personal Care & Service (100.0%), Healthcare Support (60.5%), and Cleaning & Maintenance (36.6%).
| Occupation | Male | Female |
| Healthcare Support | 17 (39.5%) | 26 (60.5%) |
| Security & Protection | 25 (100.0%) | 0 (0.0%) |
| Firefighting & Prevention | 7 (100.0%) | 0 (0.0%) |
| Law Enforcement | 18 (100.0%) | 0 (0.0%) |
| Food Preparation & Serving | 17 (85.0%) | 3 (15.0%) |
| Cleaning & Maintenance | 26 (63.4%) | 15 (36.6%) |
| Personal Care & Service | 0 (0.0%) | 26 (100.0%) |
| Total (Category) | 85 (54.8%) | 70 (45.2%) |
| Total (Overall) | 382 (47.0%) | 430 (53.0%) |
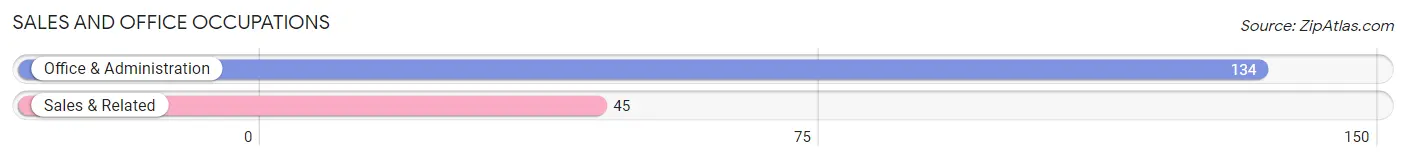
Sales and Office Occupations
The most common Sales and Office occupations in Mount Pleasant are Office & Administration (134 | 16.5%), and Sales & Related (45 | 5.5%).
Sales and Office Occupations by Sex
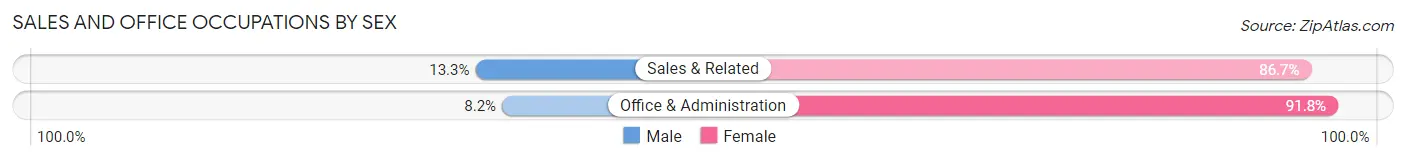
| Occupation | Male | Female |
| Sales & Related | 6 (13.3%) | 39 (86.7%) |
| Office & Administration | 11 (8.2%) | 123 (91.8%) |
| Total (Category) | 17 (9.5%) | 162 (90.5%) |
| Total (Overall) | 382 (47.0%) | 430 (53.0%) |
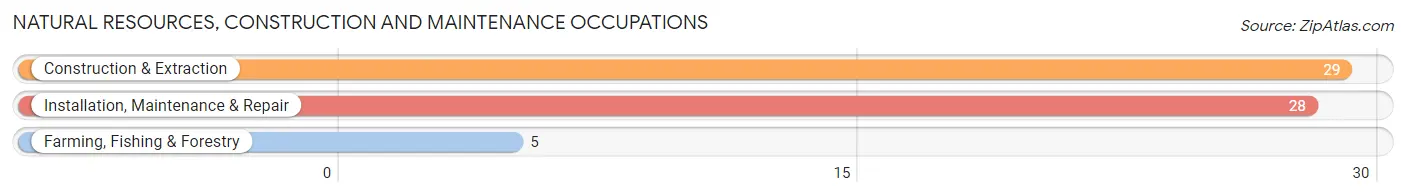
Natural Resources, Construction and Maintenance Occupations
The most common Natural Resources, Construction and Maintenance occupations in Mount Pleasant are Construction & Extraction (29 | 3.6%), Installation, Maintenance & Repair (28 | 3.5%), and Farming, Fishing & Forestry (5 | 0.6%).
Natural Resources, Construction and Maintenance Occupations by Sex
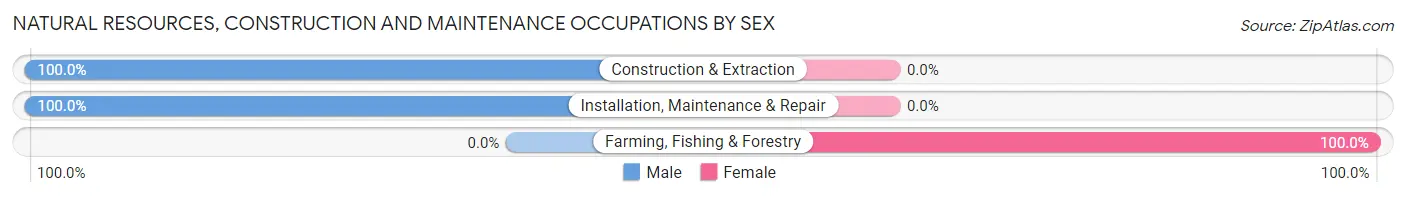
| Occupation | Male | Female |
| Farming, Fishing & Forestry | 0 (0.0%) | 5 (100.0%) |
| Construction & Extraction | 29 (100.0%) | 0 (0.0%) |
| Installation, Maintenance & Repair | 28 (100.0%) | 0 (0.0%) |
| Total (Category) | 57 (91.9%) | 5 (8.1%) |
| Total (Overall) | 382 (47.0%) | 430 (53.0%) |
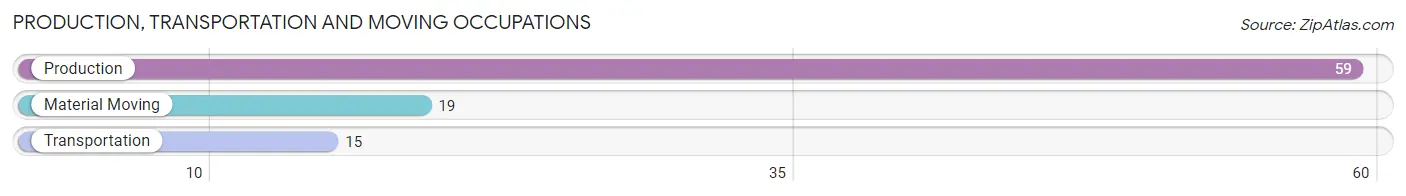
Production, Transportation and Moving Occupations
The most common Production, Transportation and Moving occupations in Mount Pleasant are Production (59 | 7.3%), Material Moving (19 | 2.3%), and Transportation (15 | 1.8%).
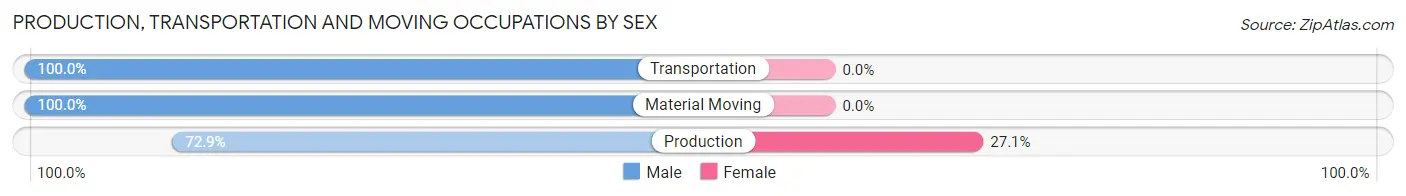
Production, Transportation and Moving Occupations by Sex
| Occupation | Male | Female |
| Production | 43 (72.9%) | 16 (27.1%) |
| Transportation | 15 (100.0%) | 0 (0.0%) |
| Material Moving | 19 (100.0%) | 0 (0.0%) |
| Total (Category) | 77 (82.8%) | 16 (17.2%) |
| Total (Overall) | 382 (47.0%) | 430 (53.0%) |
Employment Industries by Sex in Mount Pleasant
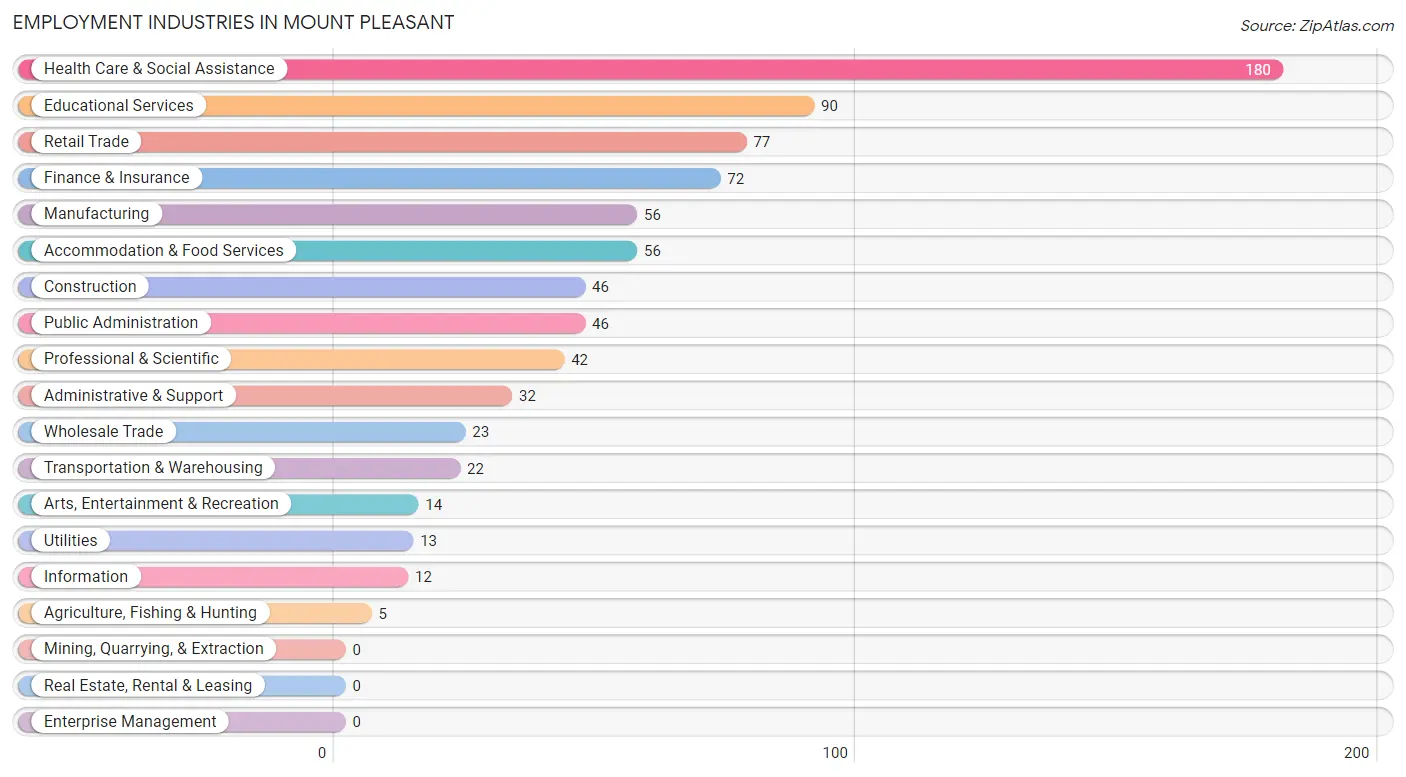
Employment Industries in Mount Pleasant
The major employment industries in Mount Pleasant include Health Care & Social Assistance (180 | 22.2%), Educational Services (90 | 11.1%), Retail Trade (77 | 9.5%), Finance & Insurance (72 | 8.9%), and Manufacturing (56 | 6.9%).
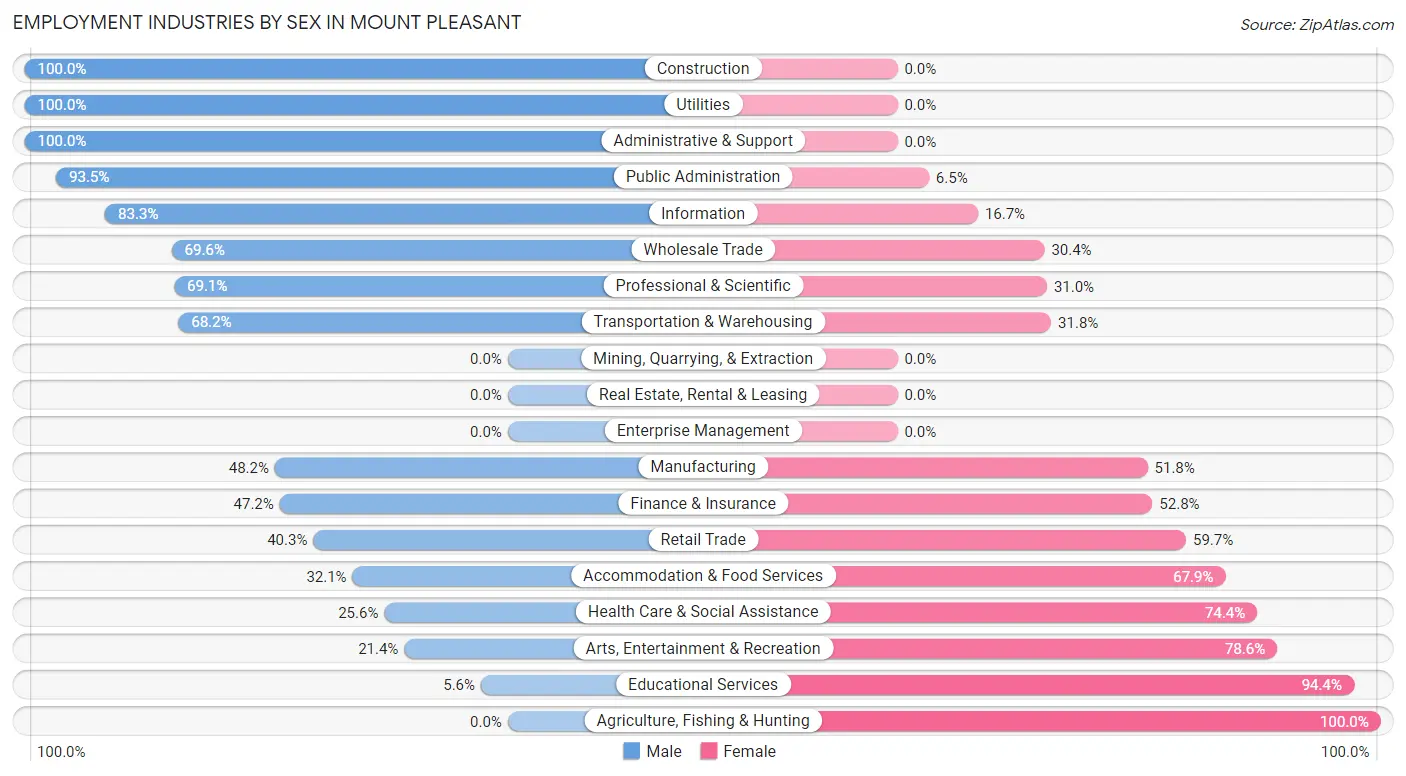
Employment Industries by Sex in Mount Pleasant
The Mount Pleasant industries that see more men than women are Construction (100.0%), Utilities (100.0%), and Administrative & Support (100.0%), whereas the industries that tend to have a higher number of women are Agriculture, Fishing & Hunting (100.0%), Educational Services (94.4%), and Arts, Entertainment & Recreation (78.6%).
| Industry | Male | Female |
| Agriculture, Fishing & Hunting | 0 (0.0%) | 5 (100.0%) |
| Mining, Quarrying, & Extraction | 0 (0.0%) | 0 (0.0%) |
| Construction | 46 (100.0%) | 0 (0.0%) |
| Manufacturing | 27 (48.2%) | 29 (51.8%) |
| Wholesale Trade | 16 (69.6%) | 7 (30.4%) |
| Retail Trade | 31 (40.3%) | 46 (59.7%) |
| Transportation & Warehousing | 15 (68.2%) | 7 (31.8%) |
| Utilities | 13 (100.0%) | 0 (0.0%) |
| Information | 10 (83.3%) | 2 (16.7%) |
| Finance & Insurance | 34 (47.2%) | 38 (52.8%) |
| Real Estate, Rental & Leasing | 0 (0.0%) | 0 (0.0%) |
| Professional & Scientific | 29 (69.1%) | 13 (30.9%) |
| Enterprise Management | 0 (0.0%) | 0 (0.0%) |
| Administrative & Support | 32 (100.0%) | 0 (0.0%) |
| Educational Services | 5 (5.6%) | 85 (94.4%) |
| Health Care & Social Assistance | 46 (25.6%) | 134 (74.4%) |
| Arts, Entertainment & Recreation | 3 (21.4%) | 11 (78.6%) |
| Accommodation & Food Services | 18 (32.1%) | 38 (67.9%) |
| Public Administration | 43 (93.5%) | 3 (6.5%) |
| Total | 382 (47.0%) | 430 (53.0%) |
Education in Mount Pleasant
School Enrollment in Mount Pleasant
The most common levels of schooling among the 498 students in Mount Pleasant are middle school (131 | 26.3%), elementary school (113 | 22.7%), and college / undergraduate (100 | 20.1%).
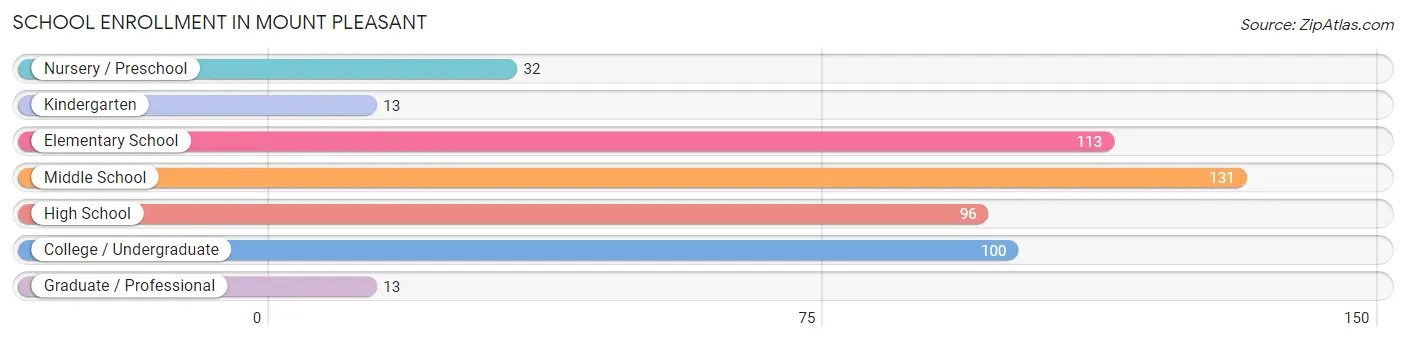
| School Level | # Students | % Students |
| Nursery / Preschool | 32 | 6.4% |
| Kindergarten | 13 | 2.6% |
| Elementary School | 113 | 22.7% |
| Middle School | 131 | 26.3% |
| High School | 96 | 19.3% |
| College / Undergraduate | 100 | 20.1% |
| Graduate / Professional | 13 | 2.6% |
| Total | 498 | 100.0% |
School Enrollment by Age by Funding Source in Mount Pleasant
Out of a total of 498 students who are enrolled in schools in Mount Pleasant, 54 (10.8%) attend a private institution, while the remaining 444 (89.2%) are enrolled in public schools. The age group of 25 to 34 year olds has the highest likelihood of being enrolled in private schools, with 17 (77.3% in the age bracket) enrolled. Conversely, the age group of 10 to 14 year olds has the lowest likelihood of being enrolled in a private school, with 168 (100.0% in the age bracket) attending a public institution.
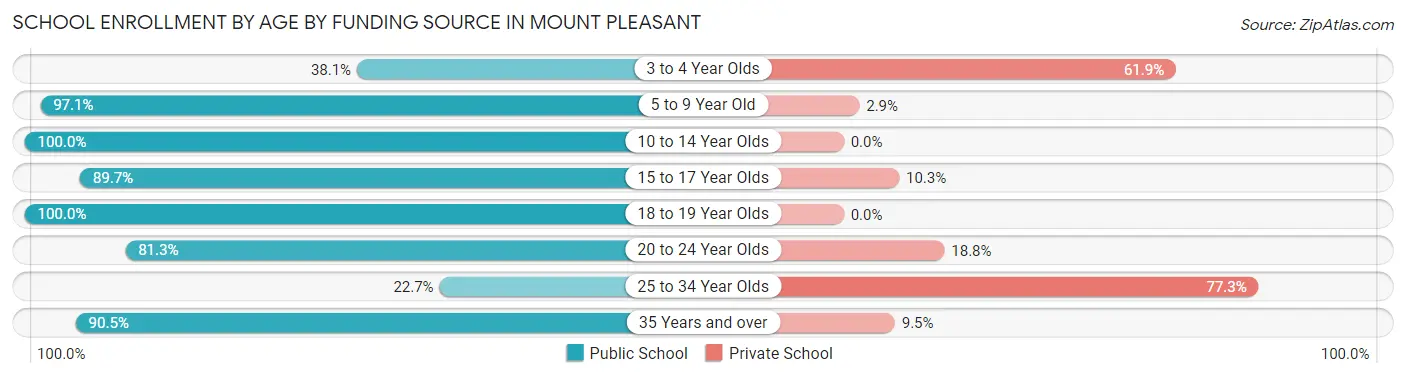
| Age Bracket | Public School | Private School |
| 3 to 4 Year Olds | 8 (38.1%) | 13 (61.9%) |
| 5 to 9 Year Old | 100 (97.1%) | 3 (2.9%) |
| 10 to 14 Year Olds | 168 (100.0%) | 0 (0.0%) |
| 15 to 17 Year Olds | 87 (89.7%) | 10 (10.3%) |
| 18 to 19 Year Olds | 18 (100.0%) | 0 (0.0%) |
| 20 to 24 Year Olds | 39 (81.2%) | 9 (18.8%) |
| 25 to 34 Year Olds | 5 (22.7%) | 17 (77.3%) |
| 35 Years and over | 19 (90.5%) | 2 (9.5%) |
| Total | 444 (89.2%) | 54 (10.8%) |
Educational Attainment by Field of Study in Mount Pleasant
Business (90 | 30.3%), education (62 | 20.9%), science & technology (33 | 11.1%), communications (23 | 7.7%), and engineering (19 | 6.4%) are the most common fields of study among 297 individuals in Mount Pleasant who have obtained a bachelor's degree or higher.
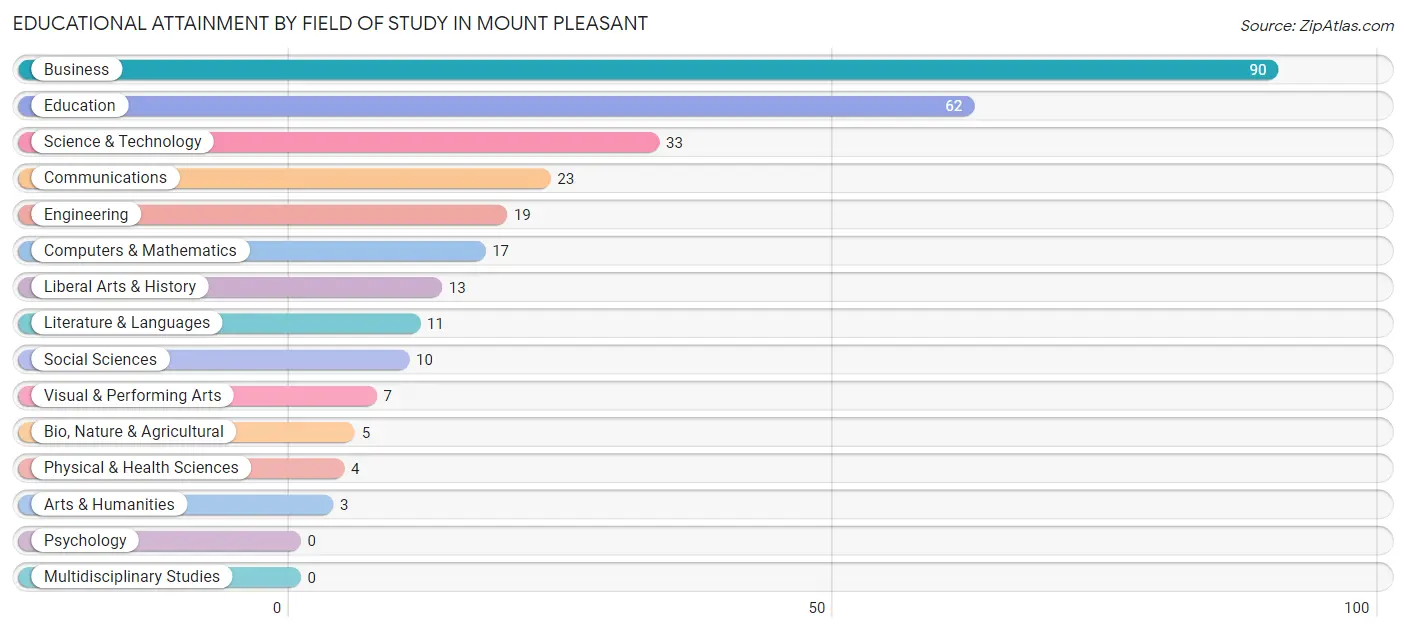
| Field of Study | # Graduates | % Graduates |
| Computers & Mathematics | 17 | 5.7% |
| Bio, Nature & Agricultural | 5 | 1.7% |
| Physical & Health Sciences | 4 | 1.3% |
| Psychology | 0 | 0.0% |
| Social Sciences | 10 | 3.4% |
| Engineering | 19 | 6.4% |
| Multidisciplinary Studies | 0 | 0.0% |
| Science & Technology | 33 | 11.1% |
| Business | 90 | 30.3% |
| Education | 62 | 20.9% |
| Literature & Languages | 11 | 3.7% |
| Liberal Arts & History | 13 | 4.4% |
| Visual & Performing Arts | 7 | 2.4% |
| Communications | 23 | 7.7% |
| Arts & Humanities | 3 | 1.0% |
| Total | 297 | 100.0% |
Transportation & Commute in Mount Pleasant
Vehicle Availability by Sex in Mount Pleasant
The most prevalent vehicle ownership categories in Mount Pleasant are males with 2 vehicles (135, accounting for 36.0%) and females with 2 vehicles (220, making up 32.1%).
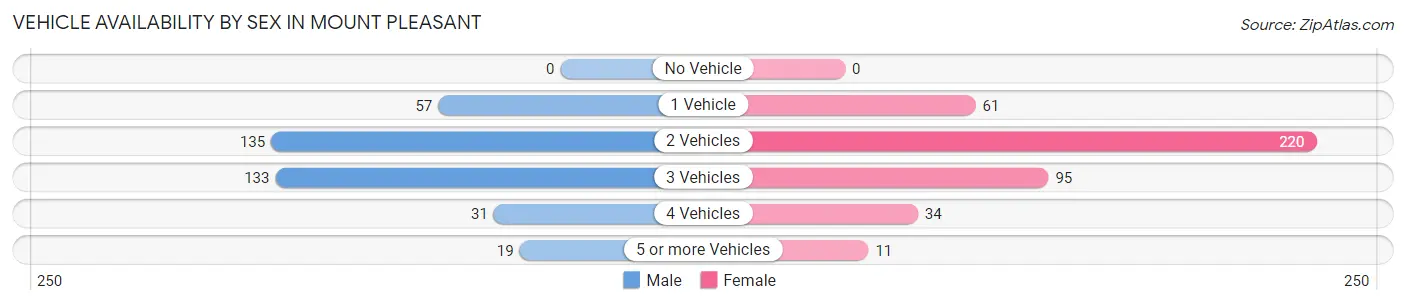
| Vehicles Available | Male | Female |
| No Vehicle | 0 (0.0%) | 0 (0.0%) |
| 1 Vehicle | 57 (15.2%) | 61 (14.5%) |
| 2 Vehicles | 135 (36.0%) | 220 (52.3%) |
| 3 Vehicles | 133 (35.5%) | 95 (22.6%) |
| 4 Vehicles | 31 (8.3%) | 34 (8.1%) |
| 5 or more Vehicles | 19 (5.1%) | 11 (2.6%) |
| Total | 375 (100.0%) | 421 (100.0%) |
Commute Time in Mount Pleasant
The most frequently occuring commute durations in Mount Pleasant are 20 to 24 minutes (145 commuters, 20.9%), 30 to 34 minutes (135 commuters, 19.5%), and 45 to 59 minutes (80 commuters, 11.5%).
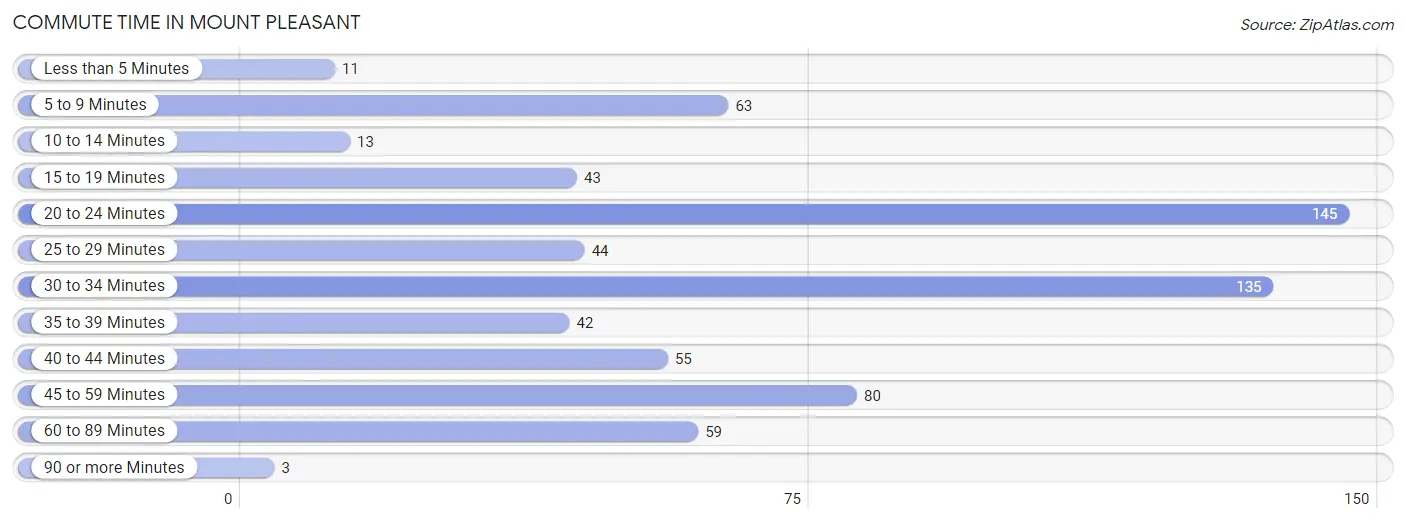
| Commute Time | # Commuters | % Commuters |
| Less than 5 Minutes | 11 | 1.6% |
| 5 to 9 Minutes | 63 | 9.1% |
| 10 to 14 Minutes | 13 | 1.9% |
| 15 to 19 Minutes | 43 | 6.2% |
| 20 to 24 Minutes | 145 | 20.9% |
| 25 to 29 Minutes | 44 | 6.4% |
| 30 to 34 Minutes | 135 | 19.5% |
| 35 to 39 Minutes | 42 | 6.1% |
| 40 to 44 Minutes | 55 | 7.9% |
| 45 to 59 Minutes | 80 | 11.5% |
| 60 to 89 Minutes | 59 | 8.5% |
| 90 or more Minutes | 3 | 0.4% |
Commute Time by Sex in Mount Pleasant
The most common commute times in Mount Pleasant are 45 to 59 minutes (64 commuters, 20.3%) for males and 20 to 24 minutes (107 commuters, 28.4%) for females.
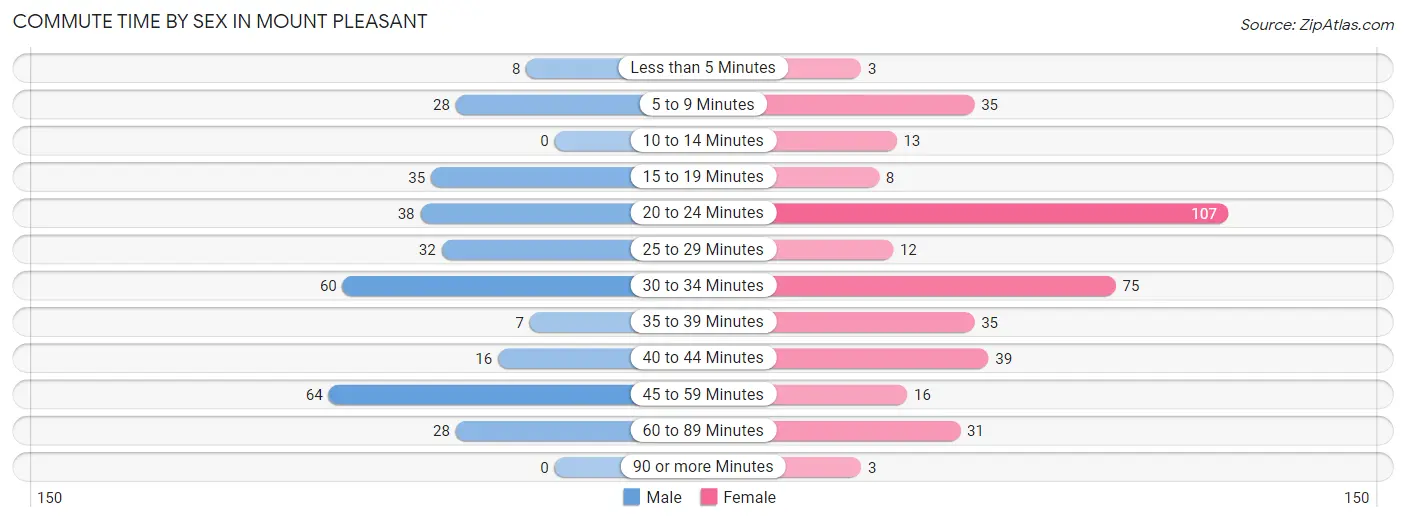
| Commute Time | Male | Female |
| Less than 5 Minutes | 8 (2.5%) | 3 (0.8%) |
| 5 to 9 Minutes | 28 (8.9%) | 35 (9.3%) |
| 10 to 14 Minutes | 0 (0.0%) | 13 (3.5%) |
| 15 to 19 Minutes | 35 (11.1%) | 8 (2.1%) |
| 20 to 24 Minutes | 38 (12.0%) | 107 (28.4%) |
| 25 to 29 Minutes | 32 (10.1%) | 12 (3.2%) |
| 30 to 34 Minutes | 60 (19.0%) | 75 (19.9%) |
| 35 to 39 Minutes | 7 (2.2%) | 35 (9.3%) |
| 40 to 44 Minutes | 16 (5.1%) | 39 (10.3%) |
| 45 to 59 Minutes | 64 (20.3%) | 16 (4.2%) |
| 60 to 89 Minutes | 28 (8.9%) | 31 (8.2%) |
| 90 or more Minutes | 0 (0.0%) | 3 (0.8%) |
Time of Departure to Work by Sex in Mount Pleasant
The most frequent times of departure to work in Mount Pleasant are 7:00 AM to 7:29 AM (60, 19.0%) for males and 7:30 AM to 7:59 AM (154, 40.8%) for females.
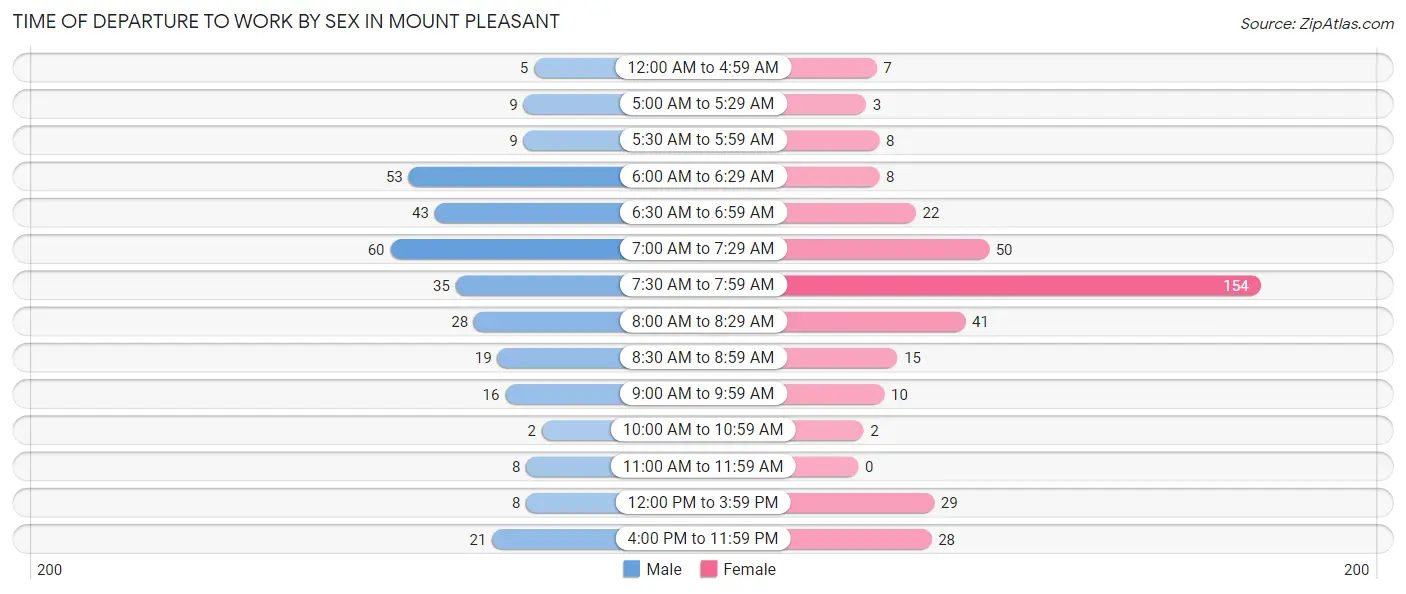
| Time of Departure | Male | Female |
| 12:00 AM to 4:59 AM | 5 (1.6%) | 7 (1.9%) |
| 5:00 AM to 5:29 AM | 9 (2.9%) | 3 (0.8%) |
| 5:30 AM to 5:59 AM | 9 (2.9%) | 8 (2.1%) |
| 6:00 AM to 6:29 AM | 53 (16.8%) | 8 (2.1%) |
| 6:30 AM to 6:59 AM | 43 (13.6%) | 22 (5.8%) |
| 7:00 AM to 7:29 AM | 60 (19.0%) | 50 (13.3%) |
| 7:30 AM to 7:59 AM | 35 (11.1%) | 154 (40.8%) |
| 8:00 AM to 8:29 AM | 28 (8.9%) | 41 (10.9%) |
| 8:30 AM to 8:59 AM | 19 (6.0%) | 15 (4.0%) |
| 9:00 AM to 9:59 AM | 16 (5.1%) | 10 (2.6%) |
| 10:00 AM to 10:59 AM | 2 (0.6%) | 2 (0.5%) |
| 11:00 AM to 11:59 AM | 8 (2.5%) | 0 (0.0%) |
| 12:00 PM to 3:59 PM | 8 (2.5%) | 29 (7.7%) |
| 4:00 PM to 11:59 PM | 21 (6.7%) | 28 (7.4%) |
| Total | 316 (100.0%) | 377 (100.0%) |
Housing Occupancy in Mount Pleasant
Occupancy by Ownership in Mount Pleasant
Of the total 633 dwellings in Mount Pleasant, owner-occupied units account for 460 (72.7%), while renter-occupied units make up 173 (27.3%).
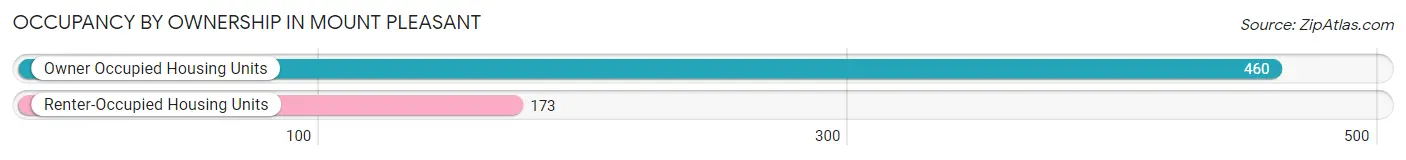
| Occupancy | # Housing Units | % Housing Units |
| Owner Occupied Housing Units | 460 | 72.7% |
| Renter-Occupied Housing Units | 173 | 27.3% |
| Total Occupied Housing Units | 633 | 100.0% |
Occupancy by Household Size in Mount Pleasant
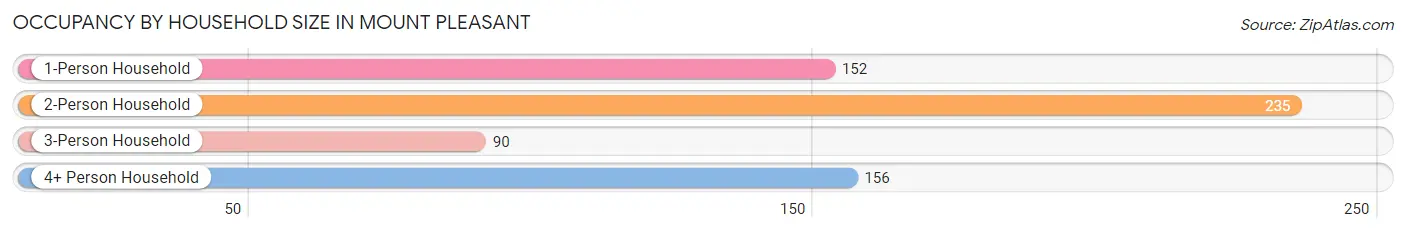
| Household Size | # Housing Units | % Housing Units |
| 1-Person Household | 152 | 24.0% |
| 2-Person Household | 235 | 37.1% |
| 3-Person Household | 90 | 14.2% |
| 4+ Person Household | 156 | 24.6% |
| Total Housing Units | 633 | 100.0% |
Occupancy by Ownership by Household Size in Mount Pleasant
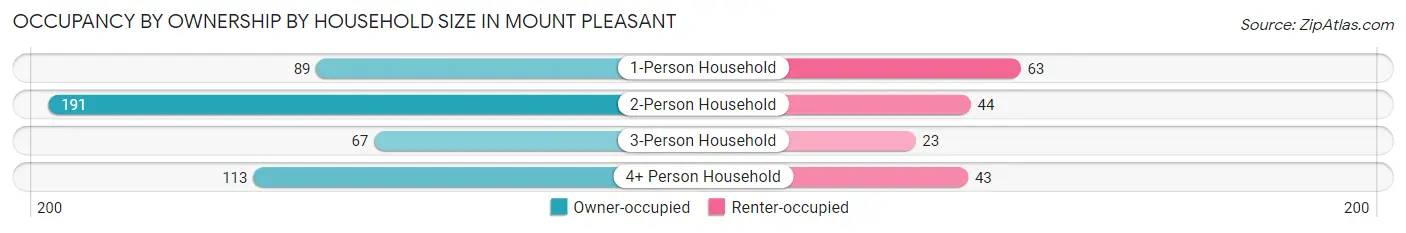
| Household Size | Owner-occupied | Renter-occupied |
| 1-Person Household | 89 (58.6%) | 63 (41.4%) |
| 2-Person Household | 191 (81.3%) | 44 (18.7%) |
| 3-Person Household | 67 (74.4%) | 23 (25.6%) |
| 4+ Person Household | 113 (72.4%) | 43 (27.6%) |
| Total Housing Units | 460 (72.7%) | 173 (27.3%) |
Occupancy by Educational Attainment in Mount Pleasant
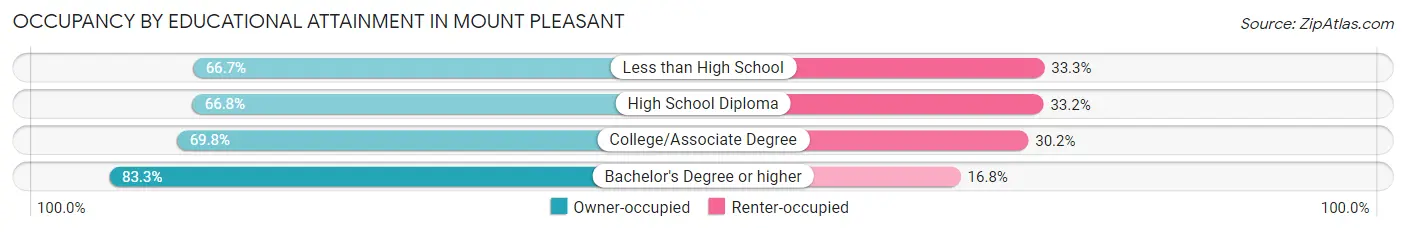
| Household Size | Owner-occupied | Renter-occupied |
| Less than High School | 34 (66.7%) | 17 (33.3%) |
| High School Diploma | 135 (66.8%) | 67 (33.2%) |
| College/Associate Degree | 132 (69.8%) | 57 (30.2%) |
| Bachelor's Degree or higher | 159 (83.3%) | 32 (16.8%) |
Occupancy by Age of Householder in Mount Pleasant
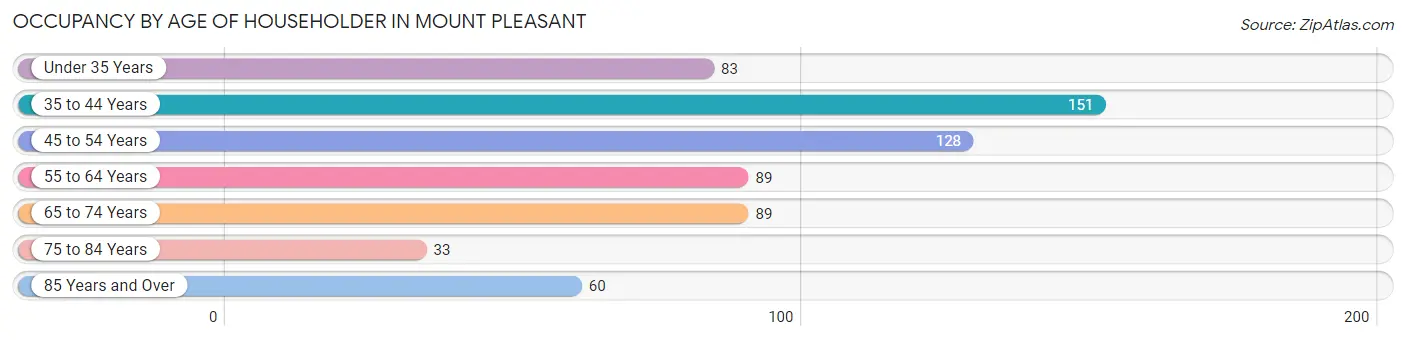
| Age Bracket | # Households | % Households |
| Under 35 Years | 83 | 13.1% |
| 35 to 44 Years | 151 | 23.8% |
| 45 to 54 Years | 128 | 20.2% |
| 55 to 64 Years | 89 | 14.1% |
| 65 to 74 Years | 89 | 14.1% |
| 75 to 84 Years | 33 | 5.2% |
| 85 Years and Over | 60 | 9.5% |
| Total | 633 | 100.0% |
Housing Finances in Mount Pleasant
Median Income by Occupancy in Mount Pleasant
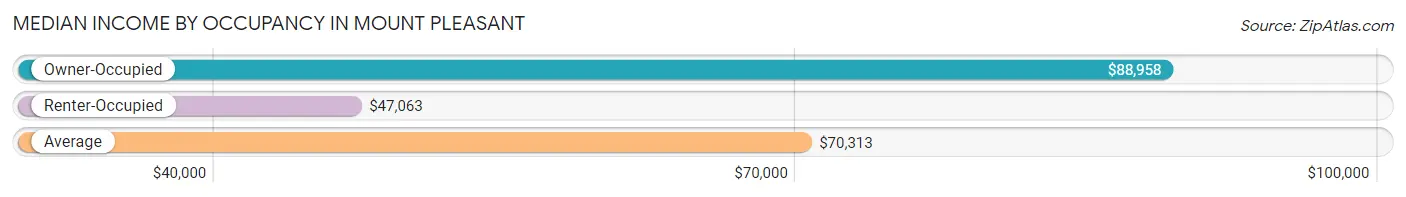
| Occupancy Type | # Households | Median Income |
| Owner-Occupied | 460 (72.7%) | $88,958 |
| Renter-Occupied | 173 (27.3%) | $47,063 |
| Average | 633 (100.0%) | $70,313 |
Occupancy by Householder Income Bracket in Mount Pleasant
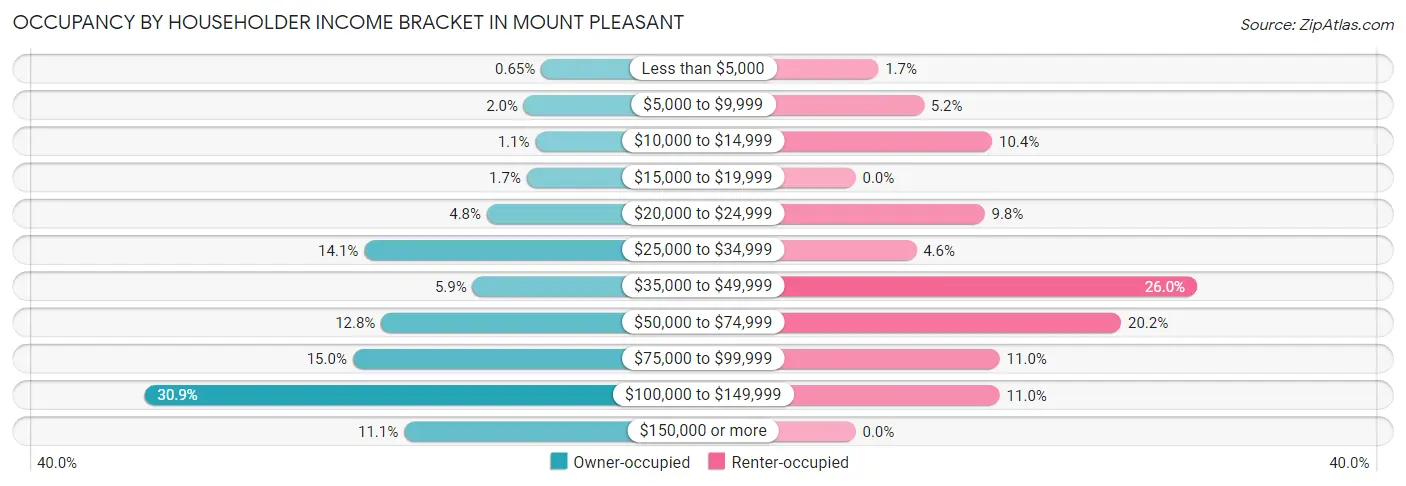
| Income Bracket | Owner-occupied | Renter-occupied |
| Less than $5,000 | 3 (0.6%) | 3 (1.7%) |
| $5,000 to $9,999 | 9 (2.0%) | 9 (5.2%) |
| $10,000 to $14,999 | 5 (1.1%) | 18 (10.4%) |
| $15,000 to $19,999 | 8 (1.7%) | 0 (0.0%) |
| $20,000 to $24,999 | 22 (4.8%) | 17 (9.8%) |
| $25,000 to $34,999 | 65 (14.1%) | 8 (4.6%) |
| $35,000 to $49,999 | 27 (5.9%) | 45 (26.0%) |
| $50,000 to $74,999 | 59 (12.8%) | 35 (20.2%) |
| $75,000 to $99,999 | 69 (15.0%) | 19 (11.0%) |
| $100,000 to $149,999 | 142 (30.9%) | 19 (11.0%) |
| $150,000 or more | 51 (11.1%) | 0 (0.0%) |
| Total | 460 (100.0%) | 173 (100.0%) |
Monthly Housing Cost Tiers in Mount Pleasant
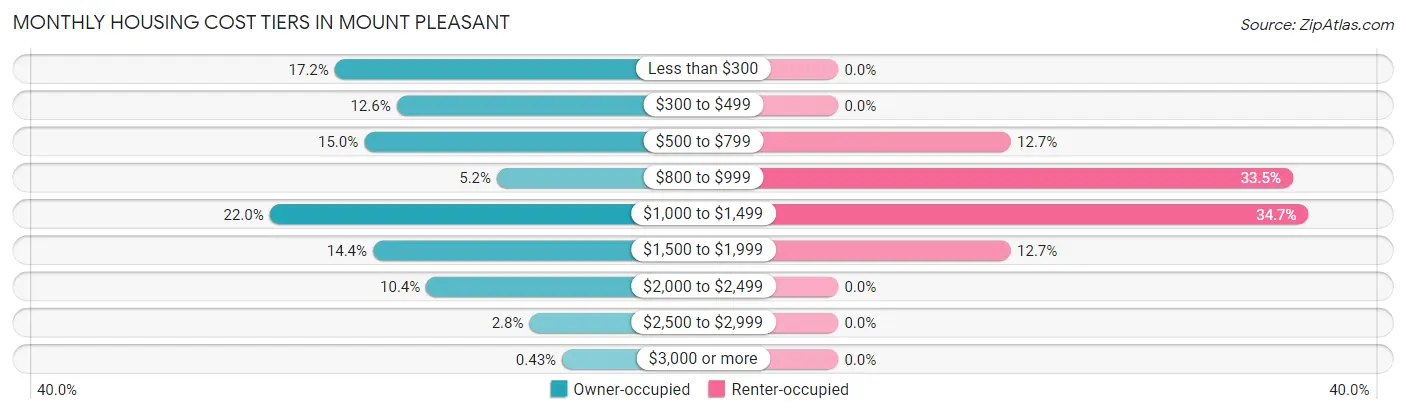
| Monthly Cost | Owner-occupied | Renter-occupied |
| Less than $300 | 79 (17.2%) | 0 (0.0%) |
| $300 to $499 | 58 (12.6%) | 0 (0.0%) |
| $500 to $799 | 69 (15.0%) | 22 (12.7%) |
| $800 to $999 | 24 (5.2%) | 58 (33.5%) |
| $1,000 to $1,499 | 101 (22.0%) | 60 (34.7%) |
| $1,500 to $1,999 | 66 (14.3%) | 22 (12.7%) |
| $2,000 to $2,499 | 48 (10.4%) | 0 (0.0%) |
| $2,500 to $2,999 | 13 (2.8%) | 0 (0.0%) |
| $3,000 or more | 2 (0.4%) | 0 (0.0%) |
| Total | 460 (100.0%) | 173 (100.0%) |
Physical Housing Characteristics in Mount Pleasant
Housing Structures in Mount Pleasant
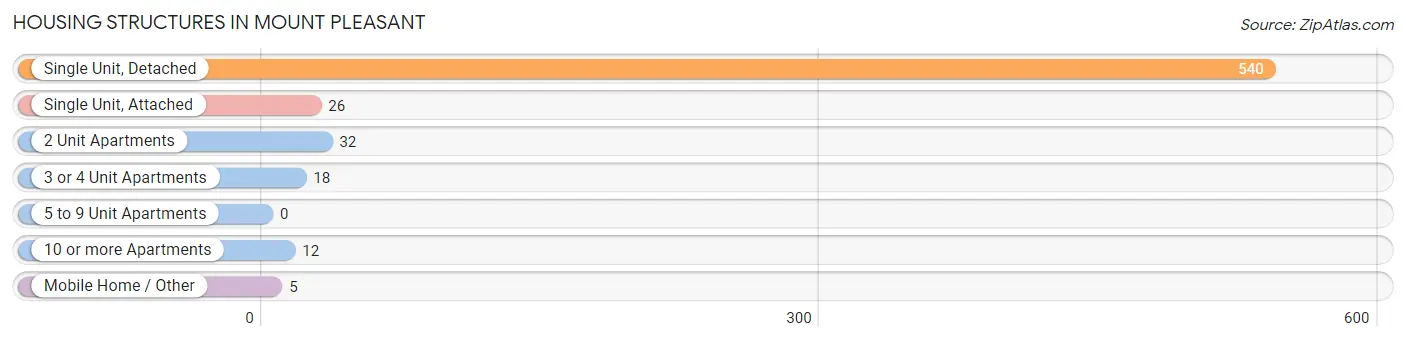
| Structure Type | # Housing Units | % Housing Units |
| Single Unit, Detached | 540 | 85.3% |
| Single Unit, Attached | 26 | 4.1% |
| 2 Unit Apartments | 32 | 5.1% |
| 3 or 4 Unit Apartments | 18 | 2.8% |
| 5 to 9 Unit Apartments | 0 | 0.0% |
| 10 or more Apartments | 12 | 1.9% |
| Mobile Home / Other | 5 | 0.8% |
| Total | 633 | 100.0% |
Housing Structures by Occupancy in Mount Pleasant
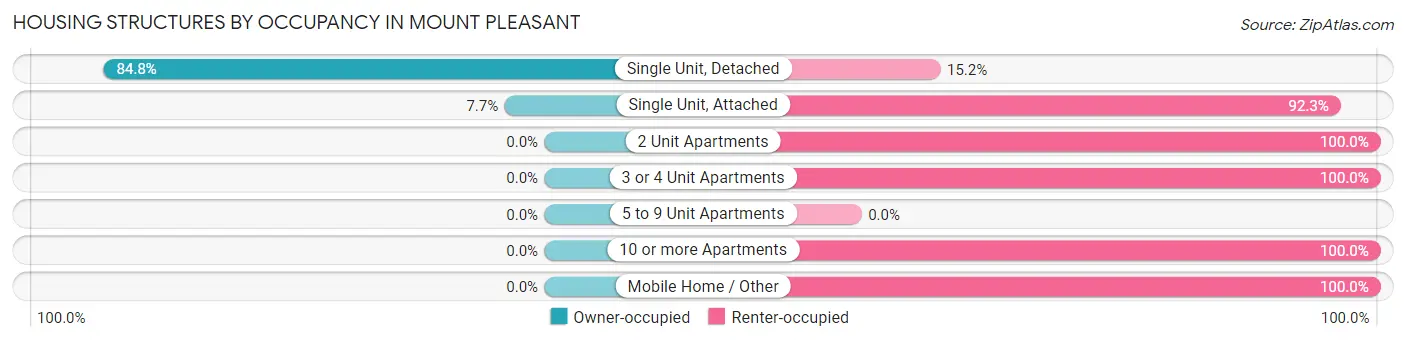
| Structure Type | Owner-occupied | Renter-occupied |
| Single Unit, Detached | 458 (84.8%) | 82 (15.2%) |
| Single Unit, Attached | 2 (7.7%) | 24 (92.3%) |
| 2 Unit Apartments | 0 (0.0%) | 32 (100.0%) |
| 3 or 4 Unit Apartments | 0 (0.0%) | 18 (100.0%) |
| 5 to 9 Unit Apartments | 0 (0.0%) | 0 (0.0%) |
| 10 or more Apartments | 0 (0.0%) | 12 (100.0%) |
| Mobile Home / Other | 0 (0.0%) | 5 (100.0%) |
| Total | 460 (72.7%) | 173 (27.3%) |
Housing Structures by Number of Rooms in Mount Pleasant
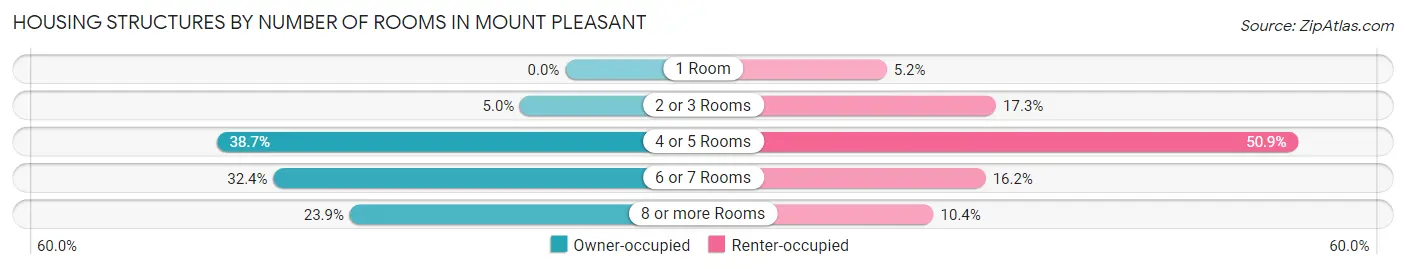
| Number of Rooms | Owner-occupied | Renter-occupied |
| 1 Room | 0 (0.0%) | 9 (5.2%) |
| 2 or 3 Rooms | 23 (5.0%) | 30 (17.3%) |
| 4 or 5 Rooms | 178 (38.7%) | 88 (50.9%) |
| 6 or 7 Rooms | 149 (32.4%) | 28 (16.2%) |
| 8 or more Rooms | 110 (23.9%) | 18 (10.4%) |
| Total | 460 (100.0%) | 173 (100.0%) |
Housing Structure by Heating Type in Mount Pleasant
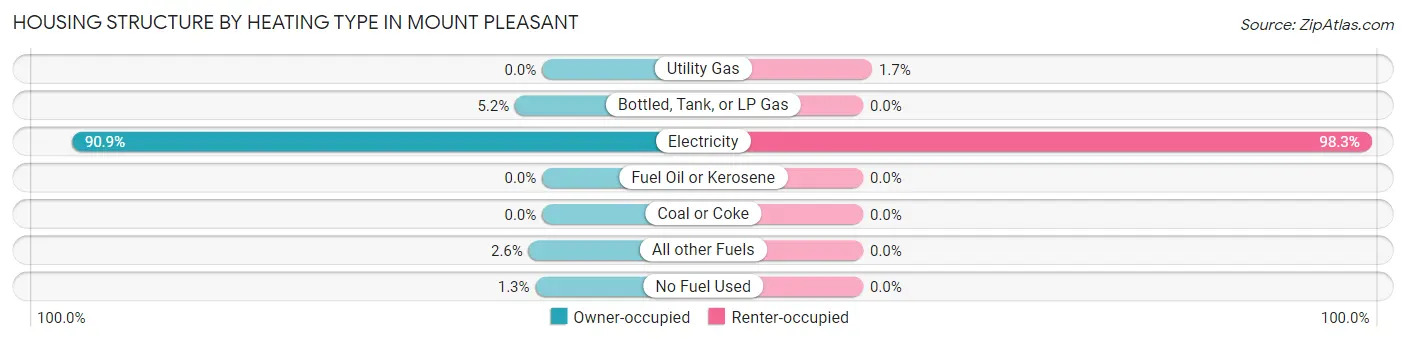
| Heating Type | Owner-occupied | Renter-occupied |
| Utility Gas | 0 (0.0%) | 3 (1.7%) |
| Bottled, Tank, or LP Gas | 24 (5.2%) | 0 (0.0%) |
| Electricity | 418 (90.9%) | 170 (98.3%) |
| Fuel Oil or Kerosene | 0 (0.0%) | 0 (0.0%) |
| Coal or Coke | 0 (0.0%) | 0 (0.0%) |
| All other Fuels | 12 (2.6%) | 0 (0.0%) |
| No Fuel Used | 6 (1.3%) | 0 (0.0%) |
| Total | 460 (100.0%) | 173 (100.0%) |
Household Vehicle Usage in Mount Pleasant
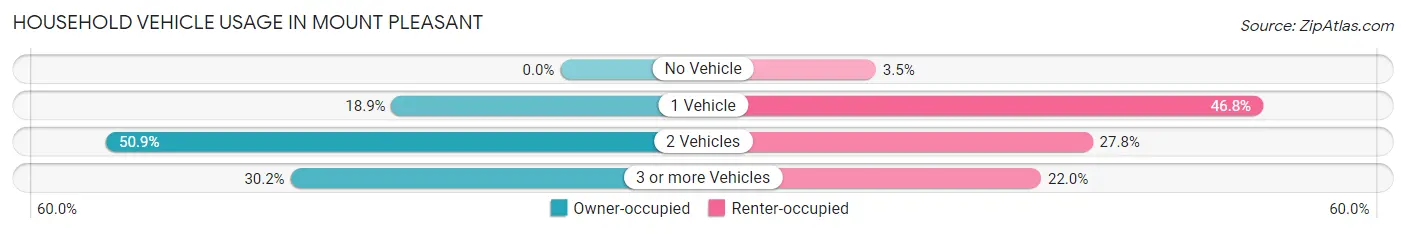
| Vehicles per Household | Owner-occupied | Renter-occupied |
| No Vehicle | 0 (0.0%) | 6 (3.5%) |
| 1 Vehicle | 87 (18.9%) | 81 (46.8%) |
| 2 Vehicles | 234 (50.9%) | 48 (27.8%) |
| 3 or more Vehicles | 139 (30.2%) | 38 (22.0%) |
| Total | 460 (100.0%) | 173 (100.0%) |
Real Estate & Mortgages in Mount Pleasant
Real Estate and Mortgage Overview in Mount Pleasant
| Characteristic | Without Mortgage | With Mortgage |
| Housing Units | 193 | 267 |
| Median Property Value | $180,100 | $279,400 |
| Median Household Income | - | - |
| Monthly Housing Costs | $358 | $2 |
| Real Estate Taxes | $1,844 | $2 |
Property Value by Mortgage Status in Mount Pleasant
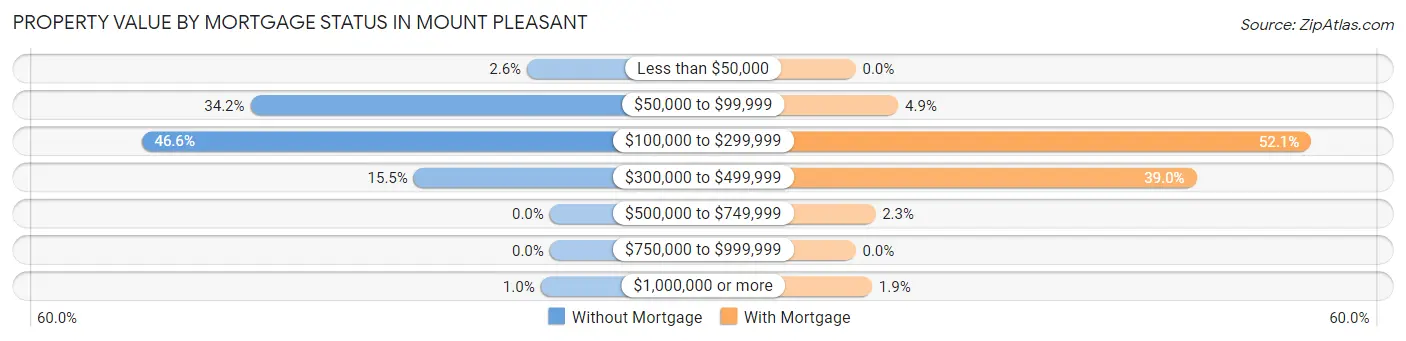
| Property Value | Without Mortgage | With Mortgage |
| Less than $50,000 | 5 (2.6%) | 0 (0.0%) |
| $50,000 to $99,999 | 66 (34.2%) | 13 (4.9%) |
| $100,000 to $299,999 | 90 (46.6%) | 139 (52.1%) |
| $300,000 to $499,999 | 30 (15.5%) | 104 (39.0%) |
| $500,000 to $749,999 | 0 (0.0%) | 6 (2.2%) |
| $750,000 to $999,999 | 0 (0.0%) | 0 (0.0%) |
| $1,000,000 or more | 2 (1.0%) | 5 (1.9%) |
| Total | 193 (100.0%) | 267 (100.0%) |
Household Income by Mortgage Status in Mount Pleasant
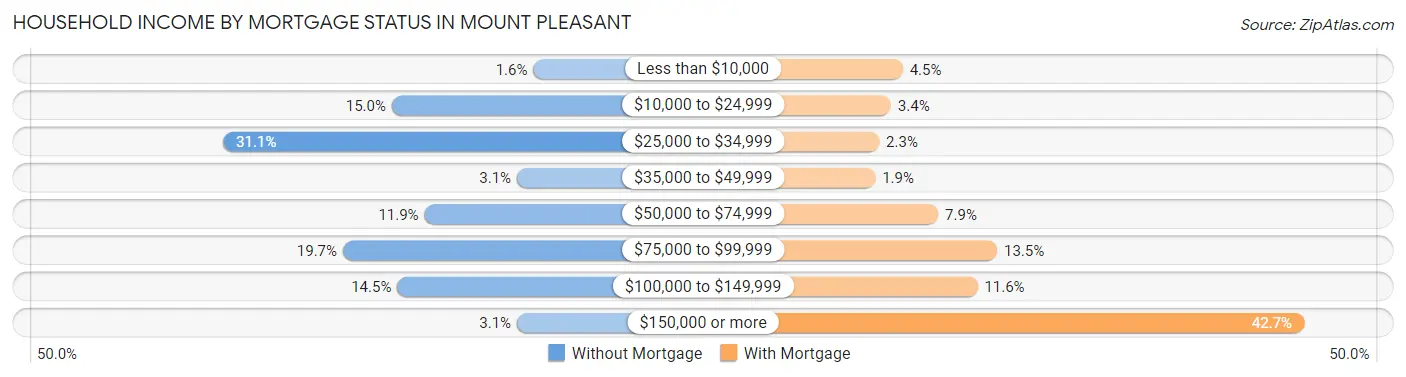
| Household Income | Without Mortgage | With Mortgage |
| Less than $10,000 | 3 (1.5%) | 12 (4.5%) |
| $10,000 to $24,999 | 29 (15.0%) | 9 (3.4%) |
| $25,000 to $34,999 | 60 (31.1%) | 6 (2.2%) |
| $35,000 to $49,999 | 6 (3.1%) | 5 (1.9%) |
| $50,000 to $74,999 | 23 (11.9%) | 21 (7.9%) |
| $75,000 to $99,999 | 38 (19.7%) | 36 (13.5%) |
| $100,000 to $149,999 | 28 (14.5%) | 31 (11.6%) |
| $150,000 or more | 6 (3.1%) | 114 (42.7%) |
| Total | 193 (100.0%) | 267 (100.0%) |
Property Value to Household Income Ratio in Mount Pleasant
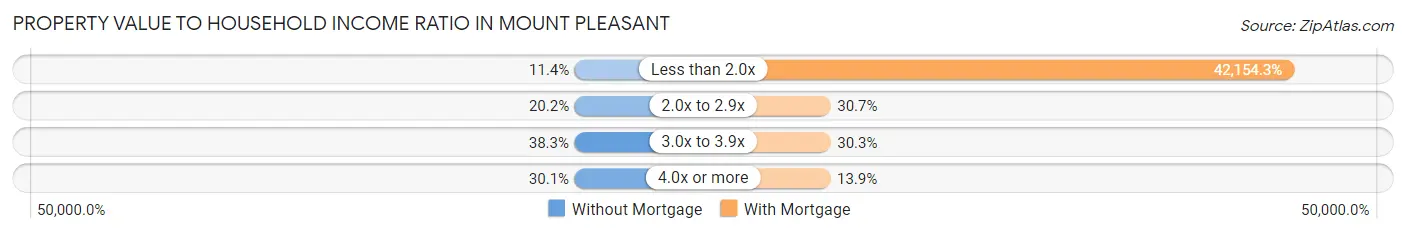
| Value-to-Income Ratio | Without Mortgage | With Mortgage |
| Less than 2.0x | 22 (11.4%) | 112,552 (42,154.3%) |
| 2.0x to 2.9x | 39 (20.2%) | 82 (30.7%) |
| 3.0x to 3.9x | 74 (38.3%) | 81 (30.3%) |
| 4.0x or more | 58 (30.0%) | 37 (13.9%) |
| Total | 193 (100.0%) | 267 (100.0%) |
Real Estate Taxes by Mortgage Status in Mount Pleasant
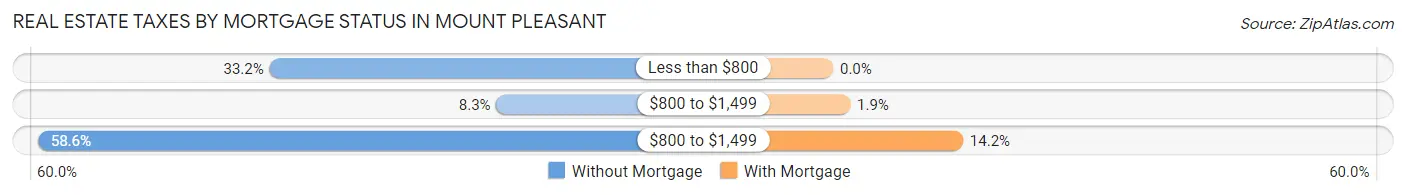
| Property Taxes | Without Mortgage | With Mortgage |
| Less than $800 | 64 (33.2%) | 0 (0.0%) |
| $800 to $1,499 | 16 (8.3%) | 5 (1.9%) |
| $800 to $1,499 | 113 (58.6%) | 38 (14.2%) |
| Total | 193 (100.0%) | 267 (100.0%) |
Health & Disability in Mount Pleasant
Health Insurance Coverage by Age in Mount Pleasant
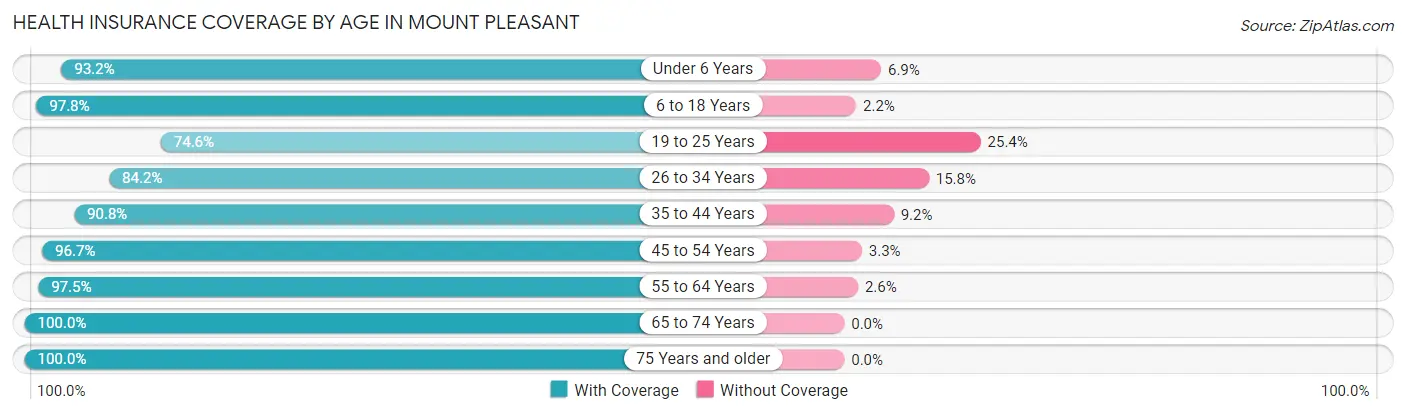
| Age Bracket | With Coverage | Without Coverage |
| Under 6 Years | 68 (93.1%) | 5 (6.9%) |
| 6 to 18 Years | 356 (97.8%) | 8 (2.2%) |
| 19 to 25 Years | 88 (74.6%) | 30 (25.4%) |
| 26 to 34 Years | 171 (84.2%) | 32 (15.8%) |
| 35 to 44 Years | 286 (90.8%) | 29 (9.2%) |
| 45 to 54 Years | 177 (96.7%) | 6 (3.3%) |
| 55 to 64 Years | 153 (97.5%) | 4 (2.5%) |
| 65 to 74 Years | 127 (100.0%) | 0 (0.0%) |
| 75 Years and older | 183 (100.0%) | 0 (0.0%) |
| Total | 1,609 (93.4%) | 114 (6.6%) |
Health Insurance Coverage by Citizenship Status in Mount Pleasant
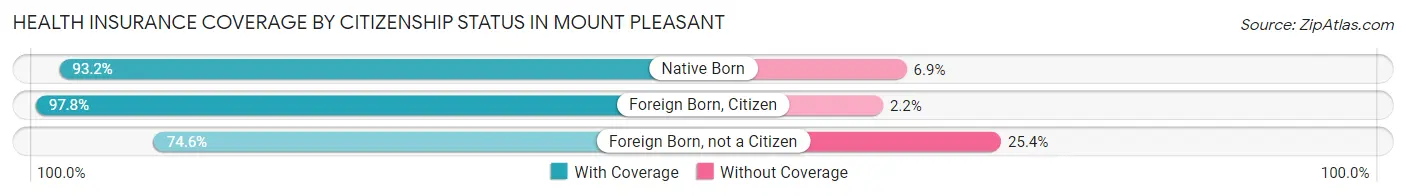
| Citizenship Status | With Coverage | Without Coverage |
| Native Born | 68 (93.1%) | 5 (6.9%) |
| Foreign Born, Citizen | 356 (97.8%) | 8 (2.2%) |
| Foreign Born, not a Citizen | 88 (74.6%) | 30 (25.4%) |
Health Insurance Coverage by Household Income in Mount Pleasant
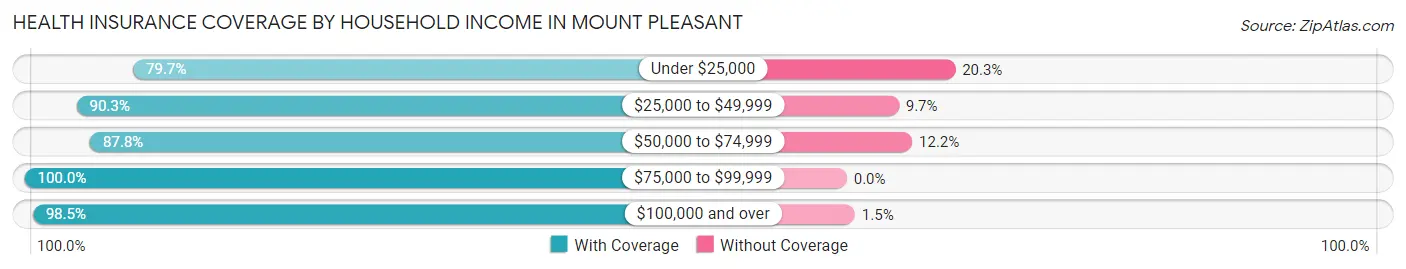
| Household Income | With Coverage | Without Coverage |
| Under $25,000 | 153 (79.7%) | 39 (20.3%) |
| $25,000 to $49,999 | 315 (90.3%) | 34 (9.7%) |
| $50,000 to $74,999 | 215 (87.8%) | 30 (12.2%) |
| $75,000 to $99,999 | 208 (100.0%) | 0 (0.0%) |
| $100,000 and over | 711 (98.5%) | 11 (1.5%) |
Public vs Private Health Insurance Coverage by Age in Mount Pleasant
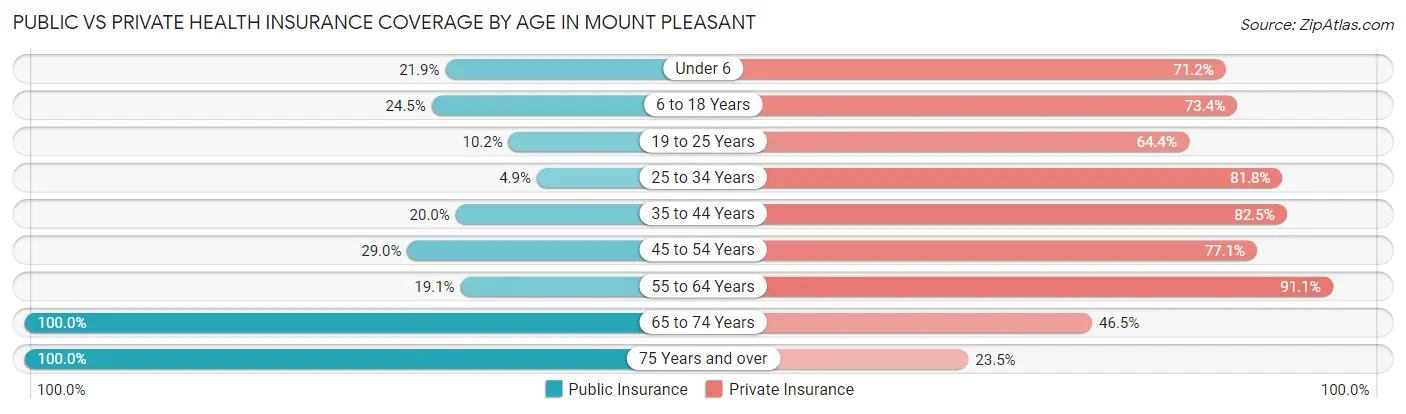
| Age Bracket | Public Insurance | Private Insurance |
| Under 6 | 16 (21.9%) | 52 (71.2%) |
| 6 to 18 Years | 89 (24.4%) | 267 (73.4%) |
| 19 to 25 Years | 12 (10.2%) | 76 (64.4%) |
| 25 to 34 Years | 10 (4.9%) | 166 (81.8%) |
| 35 to 44 Years | 63 (20.0%) | 260 (82.5%) |
| 45 to 54 Years | 53 (29.0%) | 141 (77.0%) |
| 55 to 64 Years | 30 (19.1%) | 143 (91.1%) |
| 65 to 74 Years | 127 (100.0%) | 59 (46.5%) |
| 75 Years and over | 183 (100.0%) | 43 (23.5%) |
| Total | 583 (33.8%) | 1,207 (70.1%) |
Disability Status by Sex by Age in Mount Pleasant
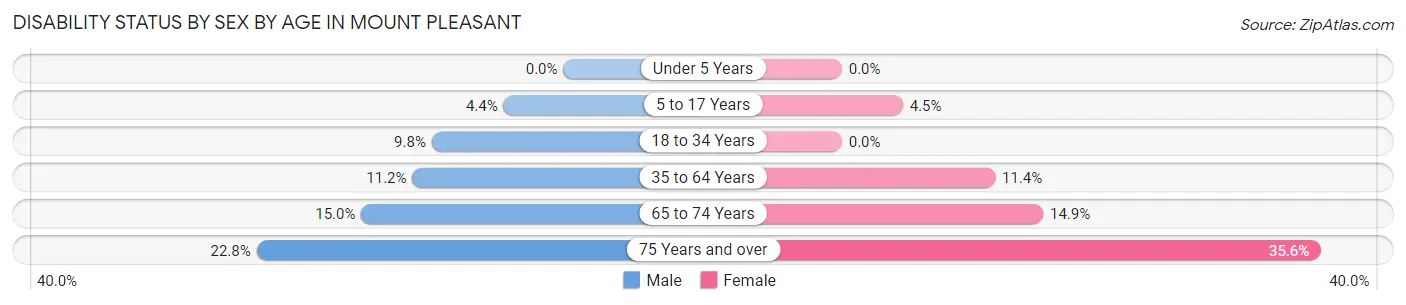
| Age Bracket | Male | Female |
| Under 5 Years | 0 (0.0%) | 0 (0.0%) |
| 5 to 17 Years | 6 (4.4%) | 11 (4.5%) |
| 18 to 34 Years | 13 (9.8%) | 0 (0.0%) |
| 35 to 64 Years | 37 (11.2%) | 37 (11.4%) |
| 65 to 74 Years | 6 (15.0%) | 13 (14.9%) |
| 75 Years and over | 18 (22.8%) | 37 (35.6%) |
Disability Class by Sex by Age in Mount Pleasant
Disability Class: Hearing Difficulty
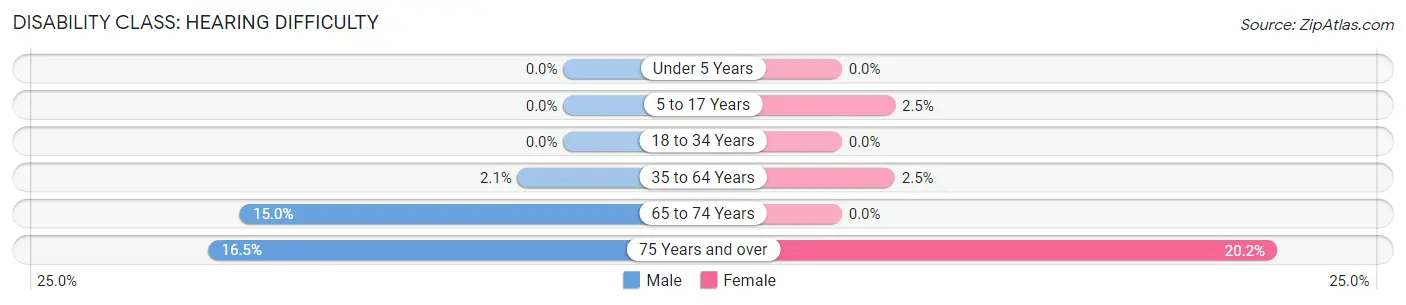
| Age Bracket | Male | Female |
| Under 5 Years | 0 (0.0%) | 0 (0.0%) |
| 5 to 17 Years | 0 (0.0%) | 6 (2.5%) |
| 18 to 34 Years | 0 (0.0%) | 0 (0.0%) |
| 35 to 64 Years | 7 (2.1%) | 8 (2.5%) |
| 65 to 74 Years | 6 (15.0%) | 0 (0.0%) |
| 75 Years and over | 13 (16.5%) | 21 (20.2%) |
Disability Class: Vision Difficulty
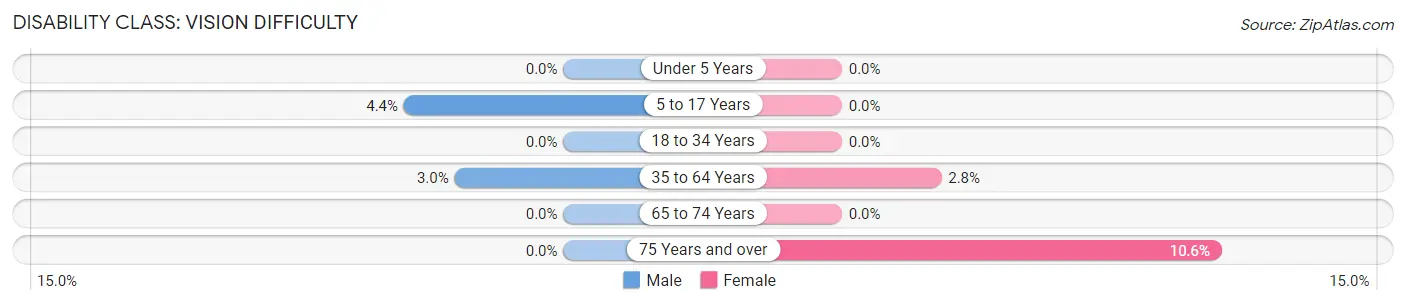
| Age Bracket | Male | Female |
| Under 5 Years | 0 (0.0%) | 0 (0.0%) |
| 5 to 17 Years | 6 (4.4%) | 0 (0.0%) |
| 18 to 34 Years | 0 (0.0%) | 0 (0.0%) |
| 35 to 64 Years | 10 (3.0%) | 9 (2.8%) |
| 65 to 74 Years | 0 (0.0%) | 0 (0.0%) |
| 75 Years and over | 0 (0.0%) | 11 (10.6%) |
Disability Class: Cognitive Difficulty
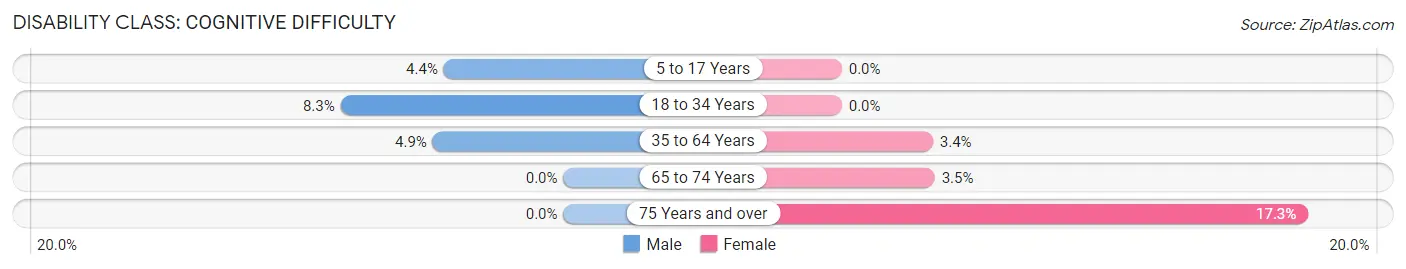
| Age Bracket | Male | Female |
| 5 to 17 Years | 6 (4.4%) | 0 (0.0%) |
| 18 to 34 Years | 11 (8.3%) | 0 (0.0%) |
| 35 to 64 Years | 16 (4.9%) | 11 (3.4%) |
| 65 to 74 Years | 0 (0.0%) | 3 (3.5%) |
| 75 Years and over | 0 (0.0%) | 18 (17.3%) |
Disability Class: Ambulatory Difficulty
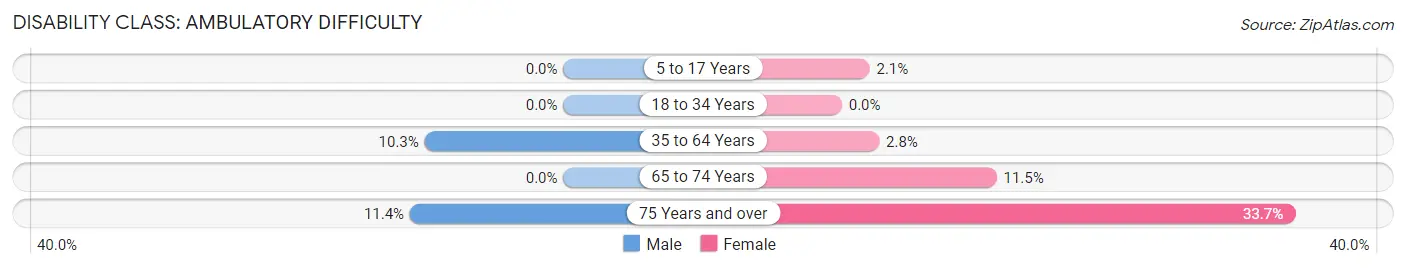
| Age Bracket | Male | Female |
| 5 to 17 Years | 0 (0.0%) | 5 (2.1%) |
| 18 to 34 Years | 0 (0.0%) | 0 (0.0%) |
| 35 to 64 Years | 34 (10.3%) | 9 (2.8%) |
| 65 to 74 Years | 0 (0.0%) | 10 (11.5%) |
| 75 Years and over | 9 (11.4%) | 35 (33.7%) |
Disability Class: Self-Care Difficulty
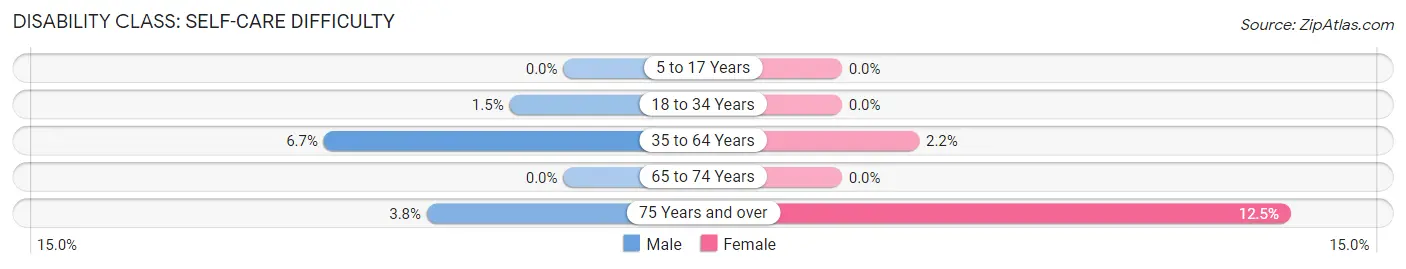
| Age Bracket | Male | Female |
| 5 to 17 Years | 0 (0.0%) | 0 (0.0%) |
| 18 to 34 Years | 2 (1.5%) | 0 (0.0%) |
| 35 to 64 Years | 22 (6.7%) | 7 (2.1%) |
| 65 to 74 Years | 0 (0.0%) | 0 (0.0%) |
| 75 Years and over | 3 (3.8%) | 13 (12.5%) |
Technology Access in Mount Pleasant
Computing Device Access in Mount Pleasant
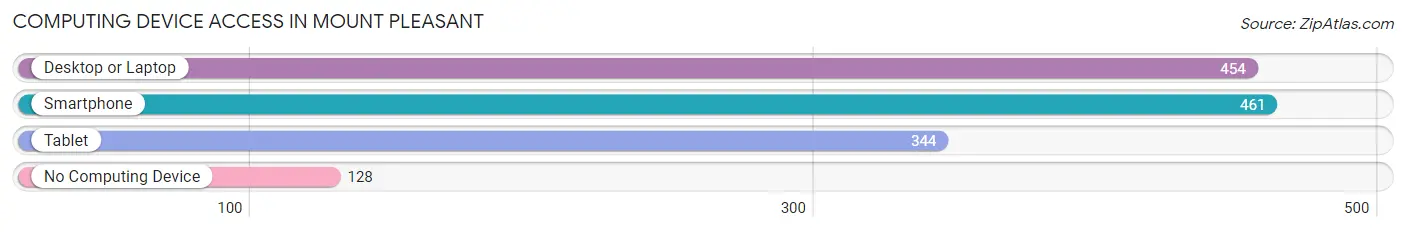
| Device Type | # Households | % Households |
| Desktop or Laptop | 454 | 71.7% |
| Smartphone | 461 | 72.8% |
| Tablet | 344 | 54.3% |
| No Computing Device | 128 | 20.2% |
| Total | 633 | 100.0% |
Internet Access in Mount Pleasant
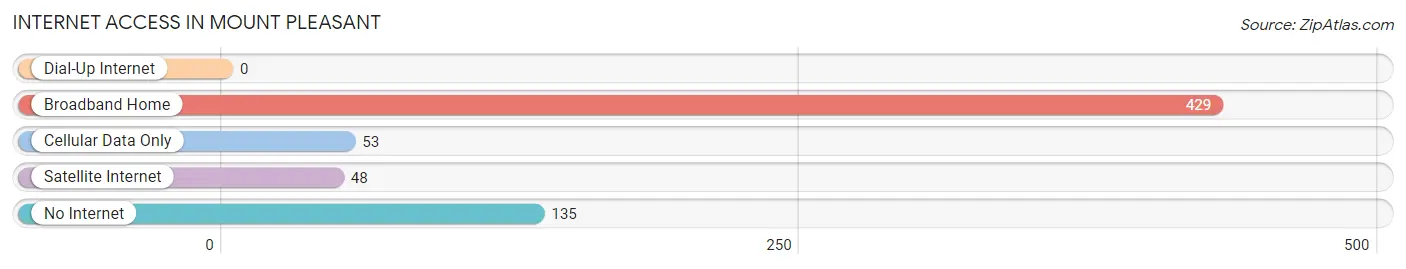
| Internet Type | # Households | % Households |
| Dial-Up Internet | 0 | 0.0% |
| Broadband Home | 429 | 67.8% |
| Cellular Data Only | 53 | 8.4% |
| Satellite Internet | 48 | 7.6% |
| No Internet | 135 | 21.3% |
| Total | 633 | 100.0% |
Mount Pleasant Summary
Introduction
Mount Pleasant is a small town located in Cabarrus County, North Carolina. It is situated in the Piedmont region of the state, approximately 25 miles northeast of Charlotte. The town has a population of approximately 4,000 people and is known for its small-town charm and friendly atmosphere. The town is home to a variety of businesses, including a number of small shops and restaurants. The town is also home to a number of historic sites, including the historic Mount Pleasant Presbyterian Church, which was built in 1845.
History
Mount Pleasant was first settled in the late 1700s by a group of German immigrants. The town was originally known as “Mountain Pleasant” and was later shortened to “Mount Pleasant”. The town was officially incorporated in 1851 and was named after the nearby Mount Pleasant Presbyterian Church. The town grew steadily throughout the 19th century and was home to a variety of businesses, including a cotton mill, a grist mill, and a sawmill.
In the early 20th century, the town experienced a period of growth and development. The town was home to a number of businesses, including a furniture factory, a canning factory, and a brickyard. The town also had a number of churches, including the Mount Pleasant Presbyterian Church, which was built in 1845.
Geography
Mount Pleasant is located in the Piedmont region of North Carolina, approximately 25 miles northeast of Charlotte. The town is situated in Cabarrus County, which is bordered by Mecklenburg County to the north, Union County to the east, Stanly County to the south, and Rowan County to the west. The town is situated on the banks of the Rocky River, which flows through the town and is a popular spot for fishing and other recreational activities.
The town is located at an elevation of approximately 800 feet above sea level and has a humid subtropical climate. The average temperature in the summer months is around 80 degrees Fahrenheit, while the average temperature in the winter months is around 40 degrees Fahrenheit. The town receives an average of 45 inches of precipitation per year, with most of the precipitation occurring in the spring and summer months.
Economy
Mount Pleasant is home to a variety of businesses, including a number of small shops and restaurants. The town is also home to a number of manufacturing companies, including a furniture factory, a canning factory, and a brickyard. The town is also home to a number of historic sites, including the historic Mount Pleasant Presbyterian Church, which was built in 1845.
The town is also home to a number of educational institutions, including the Mount Pleasant Academy, which was founded in 1845. The town is also home to a number of parks and recreational facilities, including the Mount Pleasant Recreation Center, which offers a variety of activities for residents and visitors.
Demographics
As of the 2010 census, the population of Mount Pleasant was 4,039. The racial makeup of the town was 87.3% White, 8.2% African American, 0.3% Native American, 0.7% Asian, 0.1% Pacific Islander, 1.2% from other races, and 2.4% from two or more races. The median household income in the town was $41,944, and the median family income was $50,944.
Conclusion
Mount Pleasant is a small town located in Cabarrus County, North Carolina. It is situated in the Piedmont region of the state, approximately 25 miles northeast of Charlotte. The town has a population of approximately 4,000 people and is known for its small-town charm and friendly atmosphere. The town is home to a variety of businesses, including a number of small shops and restaurants. The town is also home to a number of historic sites, including the historic Mount Pleasant Presbyterian Church, which was built in 1845. The town has a humid subtropical climate and is home to a number of educational institutions, manufacturing companies, and recreational facilities. The town has a population that is predominantly White, with a median household income of $41,944.
Common Questions
What is Per Capita Income in Mount Pleasant?
Per Capita income in Mount Pleasant is $30,963.
What is the Median Family Income in Mount Pleasant?
Median Family Income in Mount Pleasant is $85,714.
What is the Median Household income in Mount Pleasant?
Median Household Income in Mount Pleasant is $70,313.
What is Income or Wage Gap in Mount Pleasant?
Income or Wage Gap in Mount Pleasant is 29.6%.
Women in Mount Pleasant earn 70.4 cents for every dollar earned by a man.
What is Inequality or Gini Index in Mount Pleasant?
Inequality or Gini Index in Mount Pleasant is 0.38.
What is the Total Population of Mount Pleasant?
Total Population of Mount Pleasant is 1,776.
What is the Total Male Population of Mount Pleasant?
Total Male Population of Mount Pleasant is 766.
What is the Total Female Population of Mount Pleasant?
Total Female Population of Mount Pleasant is 1,010.
What is the Ratio of Males per 100 Females in Mount Pleasant?
There are 75.84 Males per 100 Females in Mount Pleasant.
What is the Ratio of Females per 100 Males in Mount Pleasant?
There are 131.85 Females per 100 Males in Mount Pleasant.
What is the Median Population Age in Mount Pleasant?
Median Population Age in Mount Pleasant is 39.1 Years.
What is the Average Family Size in Mount Pleasant
Average Family Size in Mount Pleasant is 3.3 People.
What is the Average Household Size in Mount Pleasant
Average Household Size in Mount Pleasant is 2.7 People.
How Large is the Labor Force in Mount Pleasant?
There are 854 People in the Labor Forcein in Mount Pleasant.
What is the Percentage of People in the Labor Force in Mount Pleasant?
60.0% of People are in the Labor Force in Mount Pleasant.
What is the Unemployment Rate in Mount Pleasant?
Unemployment Rate in Mount Pleasant is 4.9%.