Richlands, NC Map & Demographics
Richlands Map
Richlands Overview
$24,407
PER CAPITA INCOME
$68,611
AVG FAMILY INCOME
$59,333
AVG HOUSEHOLD INCOME
41.2%
WAGE / INCOME GAP [ % ]
58.8¢/ $1
WAGE / INCOME GAP [ $ ]
0.41
INEQUALITY / GINI INDEX
2,577
TOTAL POPULATION
1,408
MALE POPULATION
1,169
FEMALE POPULATION
120.44
MALES / 100 FEMALES
83.03
FEMALES / 100 MALES
28.9
MEDIAN AGE
4.2
AVG FAMILY SIZE
3.3
AVG HOUSEHOLD SIZE
1,178
LABOR FORCE [ PEOPLE ]
65.0%
PERCENT IN LABOR FORCE
13.6%
UNEMPLOYMENT RATE
Richlands Zip Codes
Richlands Area Codes
Income in Richlands
Income Overview in Richlands
Per Capita Income in Richlands is $24,407, while median incomes of families and households are $68,611 and $59,333 respectively.
| Characteristic | Number | Measure |
| Per Capita Income | 2,577 | $24,407 |
| Median Family Income | 516 | $68,611 |
| Mean Family Income | 516 | $90,123 |
| Median Household Income | 784 | $59,333 |
| Mean Household Income | 784 | $74,780 |
| Income Deficit | 516 | $0 |
| Wage / Income Gap (%) | 2,577 | 41.24% |
| Wage / Income Gap ($) | 2,577 | 58.76¢ per $1 |
| Gini / Inequality Index | 2,577 | 0.41 |
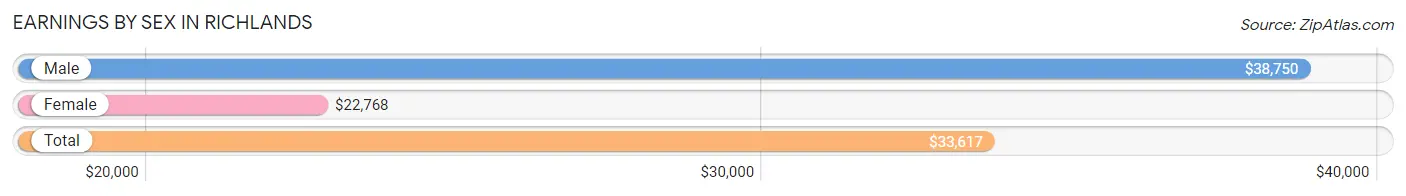
Earnings by Sex in Richlands
Average Earnings in Richlands are $33,617, $38,750 for men and $22,768 for women, a difference of 41.2%.
| Sex | Number | Average Earnings |
| Male | 710 (59.9%) | $38,750 |
| Female | 475 (40.1%) | $22,768 |
| Total | 1,185 (100.0%) | $33,617 |
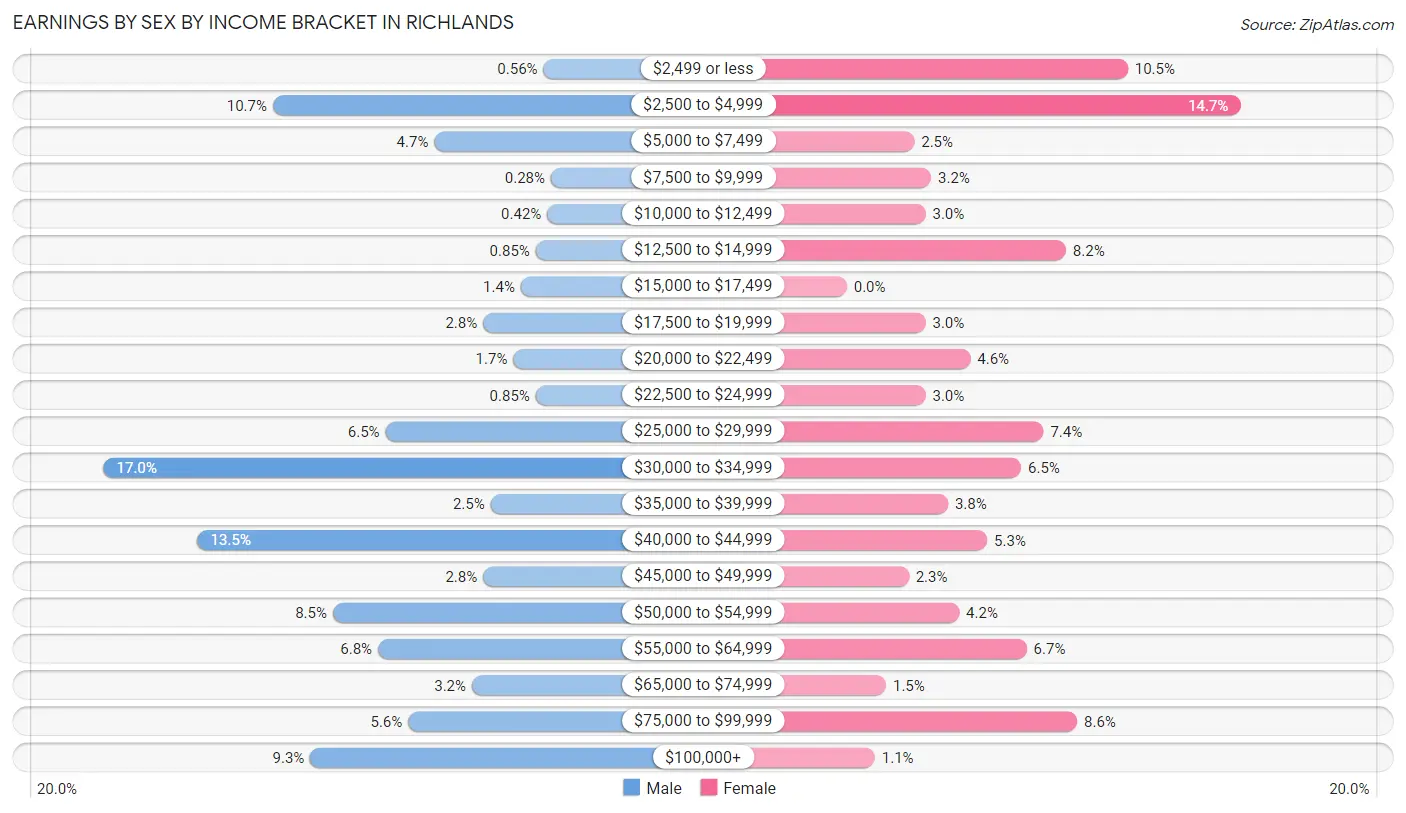
Earnings by Sex by Income Bracket in Richlands
The most common earnings brackets in Richlands are $30,000 to $34,999 for men (121 | 17.0%) and $2,500 to $4,999 for women (70 | 14.7%).
| Income | Male | Female |
| $2,499 or less | 4 (0.6%) | 50 (10.5%) |
| $2,500 to $4,999 | 76 (10.7%) | 70 (14.7%) |
| $5,000 to $7,499 | 33 (4.6%) | 12 (2.5%) |
| $7,500 to $9,999 | 2 (0.3%) | 15 (3.2%) |
| $10,000 to $12,499 | 3 (0.4%) | 14 (2.9%) |
| $12,500 to $14,999 | 6 (0.9%) | 39 (8.2%) |
| $15,000 to $17,499 | 10 (1.4%) | 0 (0.0%) |
| $17,500 to $19,999 | 20 (2.8%) | 14 (2.9%) |
| $20,000 to $22,499 | 12 (1.7%) | 22 (4.6%) |
| $22,500 to $24,999 | 6 (0.9%) | 14 (2.9%) |
| $25,000 to $29,999 | 46 (6.5%) | 35 (7.4%) |
| $30,000 to $34,999 | 121 (17.0%) | 31 (6.5%) |
| $35,000 to $39,999 | 18 (2.5%) | 18 (3.8%) |
| $40,000 to $44,999 | 96 (13.5%) | 25 (5.3%) |
| $45,000 to $49,999 | 20 (2.8%) | 11 (2.3%) |
| $50,000 to $54,999 | 60 (8.5%) | 20 (4.2%) |
| $55,000 to $64,999 | 48 (6.8%) | 32 (6.7%) |
| $65,000 to $74,999 | 23 (3.2%) | 7 (1.5%) |
| $75,000 to $99,999 | 40 (5.6%) | 41 (8.6%) |
| $100,000+ | 66 (9.3%) | 5 (1.1%) |
| Total | 710 (100.0%) | 475 (100.0%) |
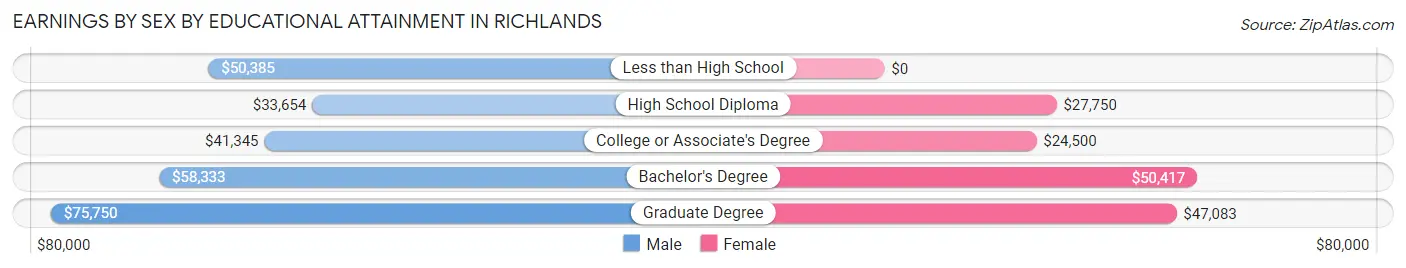
Earnings by Sex by Educational Attainment in Richlands
Average earnings in Richlands are $40,239 for men and $32,961 for women, a difference of 18.1%. Men with an educational attainment of graduate degree enjoy the highest average annual earnings of $75,750, while those with high school diploma education earn the least with $33,654. Women with an educational attainment of bachelor's degree earn the most with the average annual earnings of $50,417, while those with college or associate's degree education have the smallest earnings of $24,500.
| Educational Attainment | Male Income | Female Income |
| Less than High School | $50,385 | $0 |
| High School Diploma | $33,654 | $27,750 |
| College or Associate's Degree | $41,345 | $24,500 |
| Bachelor's Degree | $58,333 | $50,417 |
| Graduate Degree | $75,750 | $47,083 |
| Total | $40,239 | $32,961 |
Family Income in Richlands
Family Income Brackets in Richlands
According to the Richlands family income data, there are 151 families falling into the $50,000 to $74,999 income range, which is the most common income bracket and makes up 29.3% of all families. Conversely, the $15,000 to $24,999 income bracket is the least frequent group with only 12 families (2.3%) belonging to this category.
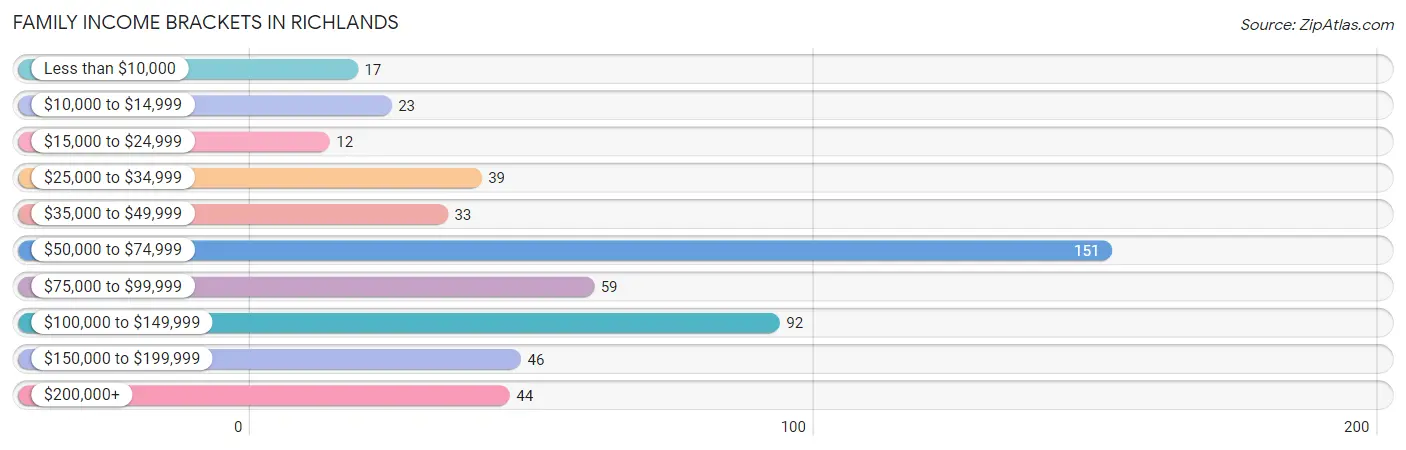
| Income Bracket | # Families | % Families |
| Less than $10,000 | 17 | 3.3% |
| $10,000 to $14,999 | 23 | 4.5% |
| $15,000 to $24,999 | 12 | 2.3% |
| $25,000 to $34,999 | 39 | 7.6% |
| $35,000 to $49,999 | 33 | 6.4% |
| $50,000 to $74,999 | 151 | 29.3% |
| $75,000 to $99,999 | 59 | 11.4% |
| $100,000 to $149,999 | 92 | 17.8% |
| $150,000 to $199,999 | 46 | 8.9% |
| $200,000+ | 44 | 8.5% |
Family Income by Famaliy Size in Richlands
6-person families (43 | 8.3%) account for the highest median family income in Richlands with $226,007 per family, while 6-person families (43 | 8.3%) have the highest median income of $37,668 per family member.
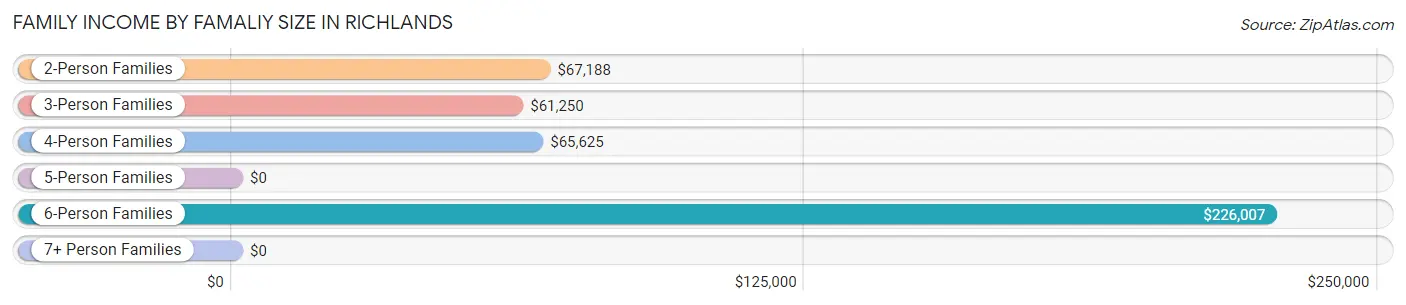
| Income Bracket | # Families | Median Income |
| 2-Person Families | 157 (30.4%) | $67,188 |
| 3-Person Families | 151 (29.3%) | $61,250 |
| 4-Person Families | 92 (17.8%) | $65,625 |
| 5-Person Families | 36 (7.0%) | $0 |
| 6-Person Families | 43 (8.3%) | $226,007 |
| 7+ Person Families | 37 (7.2%) | $0 |
| Total | 516 (100.0%) | $68,611 |
Family Income by Number of Earners in Richlands
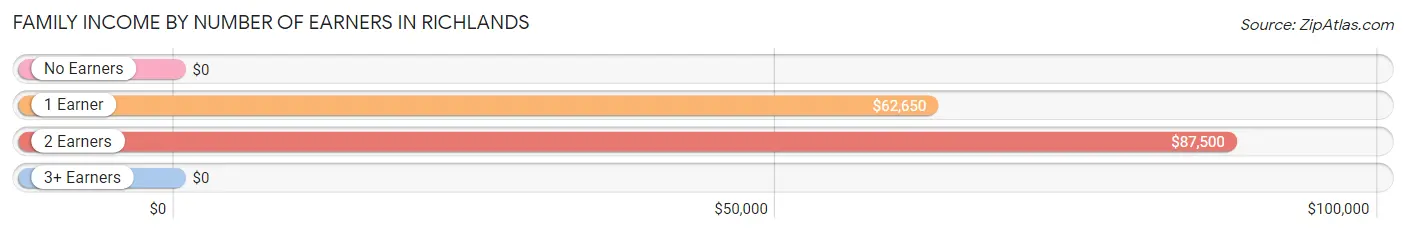
| Number of Earners | # Families | Median Income |
| No Earners | 82 (15.9%) | $0 |
| 1 Earner | 155 (30.0%) | $62,650 |
| 2 Earners | 214 (41.5%) | $87,500 |
| 3+ Earners | 65 (12.6%) | $0 |
| Total | 516 (100.0%) | $68,611 |
Household Income in Richlands
Household Income Brackets in Richlands
With 197 households falling in the category, the $50,000 to $74,999 income range is the most frequent in Richlands, accounting for 25.1% of all households. In contrast, only 34 households (4.3%) fall into the less than $10,000 income bracket, making it the least populous group.
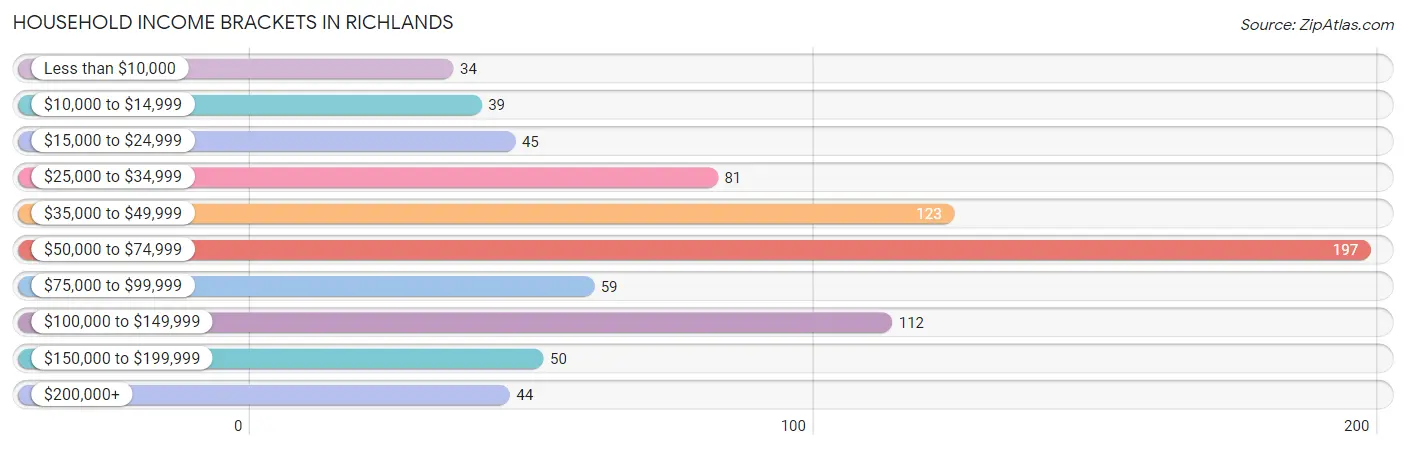
| Income Bracket | # Households | % Households |
| Less than $10,000 | 34 | 4.3% |
| $10,000 to $14,999 | 39 | 5.0% |
| $15,000 to $24,999 | 45 | 5.7% |
| $25,000 to $34,999 | 81 | 10.3% |
| $35,000 to $49,999 | 123 | 15.7% |
| $50,000 to $74,999 | 197 | 25.1% |
| $75,000 to $99,999 | 59 | 7.5% |
| $100,000 to $149,999 | 112 | 14.3% |
| $150,000 to $199,999 | 50 | 6.4% |
| $200,000+ | 44 | 5.6% |
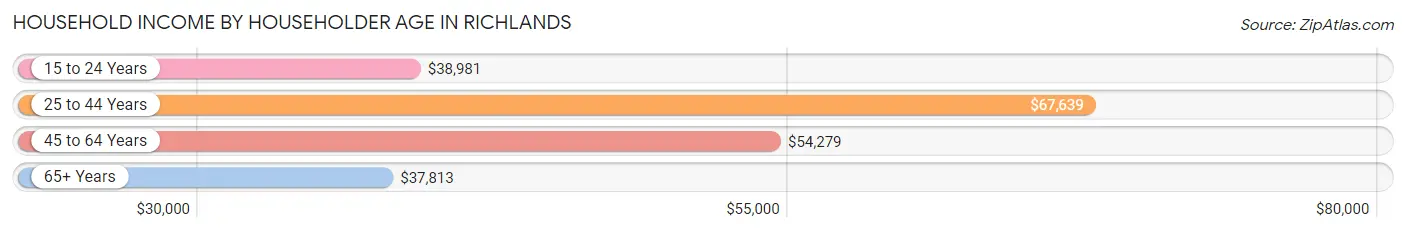
Household Income by Householder Age in Richlands
The median household income in Richlands is $59,333, with the highest median household income of $67,639 found in the 25 to 44 years age bracket for the primary householder. A total of 385 households (49.1%) fall into this category. Meanwhile, the 65+ years age bracket for the primary householder has the lowest median household income of $37,813, with 118 households (15.0%) in this group.
| Income Bracket | # Households | Median Income |
| 15 to 24 Years | 74 (9.4%) | $38,981 |
| 25 to 44 Years | 385 (49.1%) | $67,639 |
| 45 to 64 Years | 207 (26.4%) | $54,279 |
| 65+ Years | 118 (15.0%) | $37,813 |
| Total | 784 (100.0%) | $59,333 |
Poverty in Richlands
Income Below Poverty by Sex and Age in Richlands
With 9.9% poverty level for males and 16.5% for females among the residents of Richlands, 16 and 17 year old males and 18 to 24 year old females are the most vulnerable to poverty, with 16 males (51.6%) and 59 females (57.3%) in their respective age groups living below the poverty level.
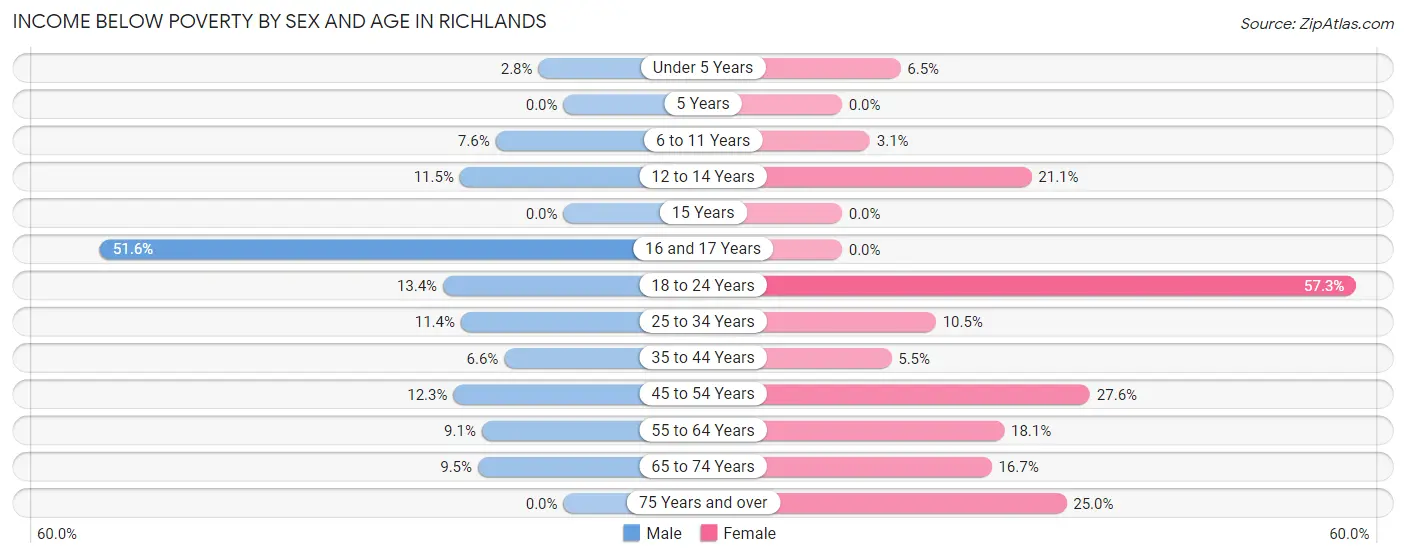
| Age Bracket | Male | Female |
| Under 5 Years | 3 (2.8%) | 3 (6.5%) |
| 5 Years | 0 (0.0%) | 0 (0.0%) |
| 6 to 11 Years | 9 (7.6%) | 2 (3.1%) |
| 12 to 14 Years | 18 (11.5%) | 42 (21.1%) |
| 15 Years | 0 (0.0%) | 0 (0.0%) |
| 16 and 17 Years | 16 (51.6%) | 0 (0.0%) |
| 18 to 24 Years | 11 (13.4%) | 59 (57.3%) |
| 25 to 34 Years | 33 (11.4%) | 16 (10.5%) |
| 35 to 44 Years | 18 (6.6%) | 14 (5.5%) |
| 45 to 54 Years | 19 (12.3%) | 21 (27.6%) |
| 55 to 64 Years | 6 (9.1%) | 15 (18.1%) |
| 65 to 74 Years | 6 (9.5%) | 11 (16.7%) |
| 75 Years and over | 0 (0.0%) | 10 (25.0%) |
| Total | 139 (9.9%) | 193 (16.5%) |
Income Above Poverty by Sex and Age in Richlands
According to the poverty statistics in Richlands, males aged 5 years and females aged 5 years are the age groups that are most secure financially, with 100.0% of males and 100.0% of females in these age groups living above the poverty line.
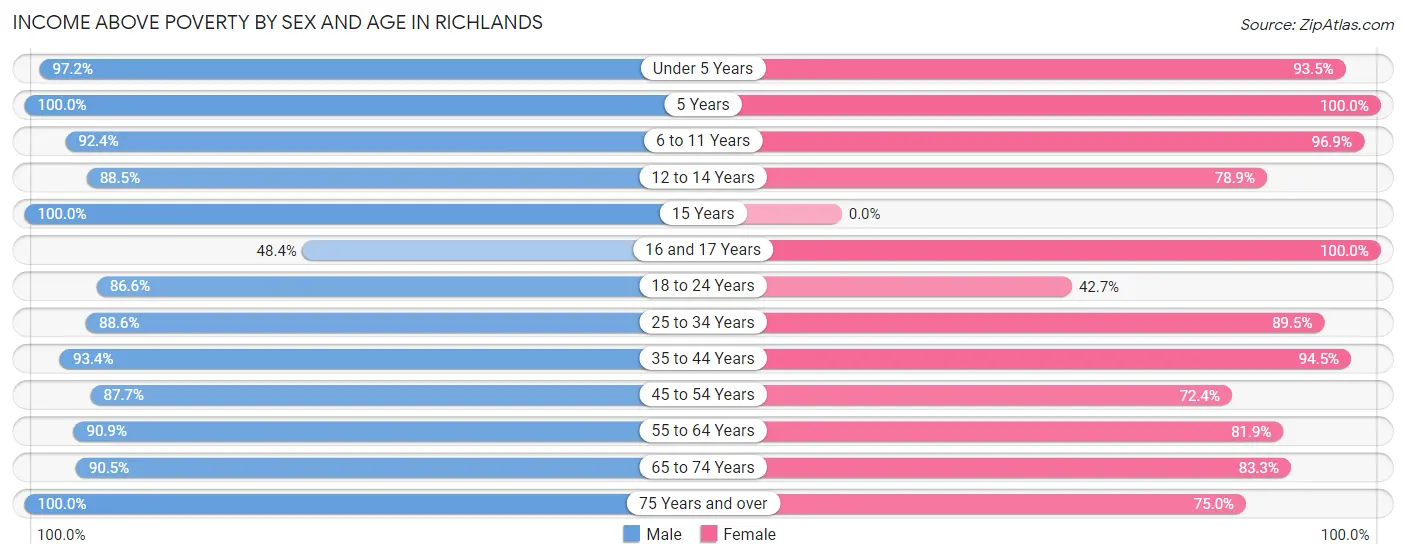
| Age Bracket | Male | Female |
| Under 5 Years | 105 (97.2%) | 43 (93.5%) |
| 5 Years | 14 (100.0%) | 18 (100.0%) |
| 6 to 11 Years | 110 (92.4%) | 62 (96.9%) |
| 12 to 14 Years | 138 (88.5%) | 157 (78.9%) |
| 15 Years | 40 (100.0%) | 0 (0.0%) |
| 16 and 17 Years | 15 (48.4%) | 67 (100.0%) |
| 18 to 24 Years | 71 (86.6%) | 44 (42.7%) |
| 25 to 34 Years | 256 (88.6%) | 137 (89.5%) |
| 35 to 44 Years | 255 (93.4%) | 240 (94.5%) |
| 45 to 54 Years | 136 (87.7%) | 55 (72.4%) |
| 55 to 64 Years | 60 (90.9%) | 68 (81.9%) |
| 65 to 74 Years | 57 (90.5%) | 55 (83.3%) |
| 75 Years and over | 12 (100.0%) | 30 (75.0%) |
| Total | 1,269 (90.1%) | 976 (83.5%) |
Income Below Poverty Among Married-Couple Families in Richlands
The poverty statistics for married-couple families in Richlands show that 7.6% or 32 of the total 423 families live below the poverty line. Families with 3 or 4 children have the highest poverty rate of 22.2%, comprising of 14 families. On the other hand, families with 1 or 2 children have the lowest poverty rate of 4.6%, which includes 11 families.
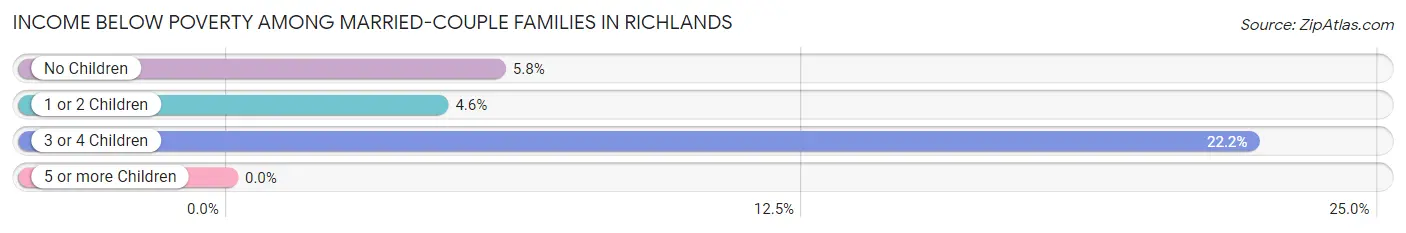
| Children | Above Poverty | Below Poverty |
| No Children | 113 (94.2%) | 7 (5.8%) |
| 1 or 2 Children | 229 (95.4%) | 11 (4.6%) |
| 3 or 4 Children | 49 (77.8%) | 14 (22.2%) |
| 5 or more Children | 0 (0.0%) | 0 (0.0%) |
| Total | 391 (92.4%) | 32 (7.6%) |
Income Below Poverty Among Single-Parent Households in Richlands
According to the poverty data in Richlands, 17.6% or 3 single-father households and 27.6% or 21 single-mother households are living below the poverty line. Among single-father households, those with no children have the highest poverty rate, with 3 households (30.0%) experiencing poverty. Likewise, among single-mother households, those with 1 or 2 children have the highest poverty rate, with 14 households (45.2%) falling below the poverty line.
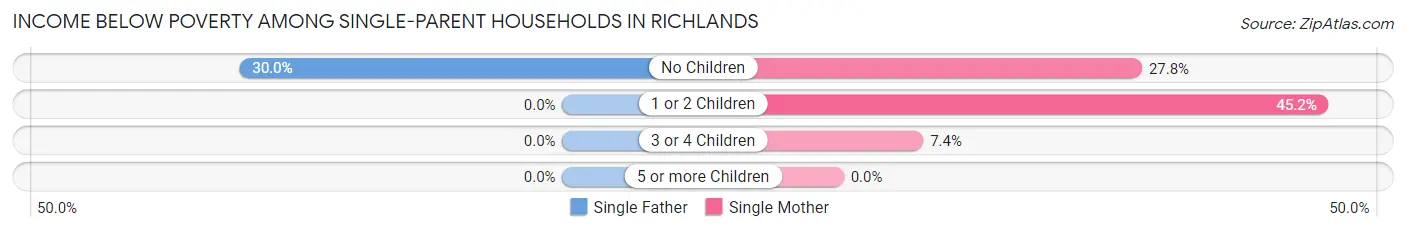
| Children | Single Father | Single Mother |
| No Children | 3 (30.0%) | 5 (27.8%) |
| 1 or 2 Children | 0 (0.0%) | 14 (45.2%) |
| 3 or 4 Children | 0 (0.0%) | 2 (7.4%) |
| 5 or more Children | 0 (0.0%) | 0 (0.0%) |
| Total | 3 (17.6%) | 21 (27.6%) |
Income Below Poverty Among Married-Couple vs Single-Parent Households in Richlands
The poverty data for Richlands shows that 32 of the married-couple family households (7.6%) and 24 of the single-parent households (25.8%) are living below the poverty level. Within the married-couple family households, those with 3 or 4 children have the highest poverty rate, with 14 households (22.2%) falling below the poverty line. Among the single-parent households, those with 1 or 2 children have the highest poverty rate, with 14 household (36.8%) living below poverty.
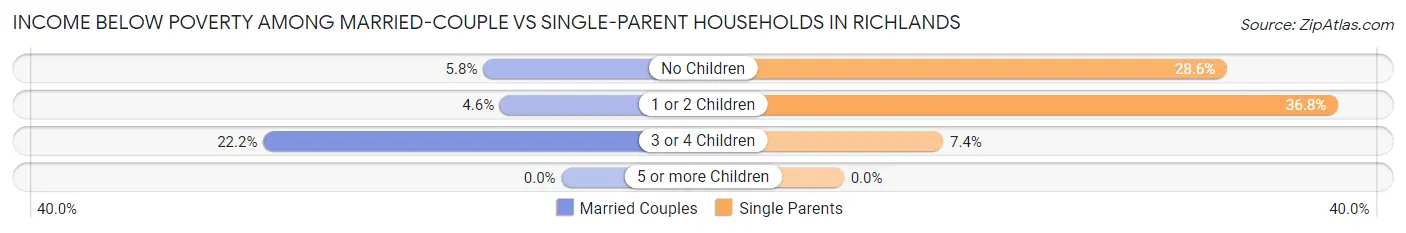
| Children | Married-Couple Families | Single-Parent Households |
| No Children | 7 (5.8%) | 8 (28.6%) |
| 1 or 2 Children | 11 (4.6%) | 14 (36.8%) |
| 3 or 4 Children | 14 (22.2%) | 2 (7.4%) |
| 5 or more Children | 0 (0.0%) | 0 (0.0%) |
| Total | 32 (7.6%) | 24 (25.8%) |
Race in Richlands
The most populous races in Richlands are White / Caucasian (1,987 | 77.1%), Black / African American (401 | 15.6%), and Hispanic or Latino (232 | 9.0%).
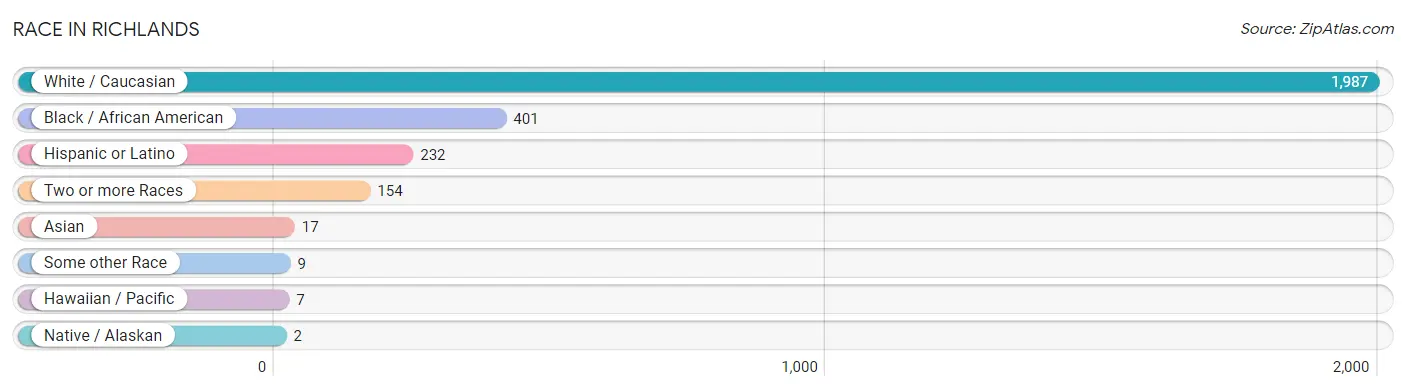
| Race | # Population | % Population |
| Asian | 17 | 0.7% |
| Black / African American | 401 | 15.6% |
| Hawaiian / Pacific | 7 | 0.3% |
| Hispanic or Latino | 232 | 9.0% |
| Native / Alaskan | 2 | 0.1% |
| White / Caucasian | 1,987 | 77.1% |
| Two or more Races | 154 | 6.0% |
| Some other Race | 9 | 0.4% |
| Total | 2,577 | 100.0% |
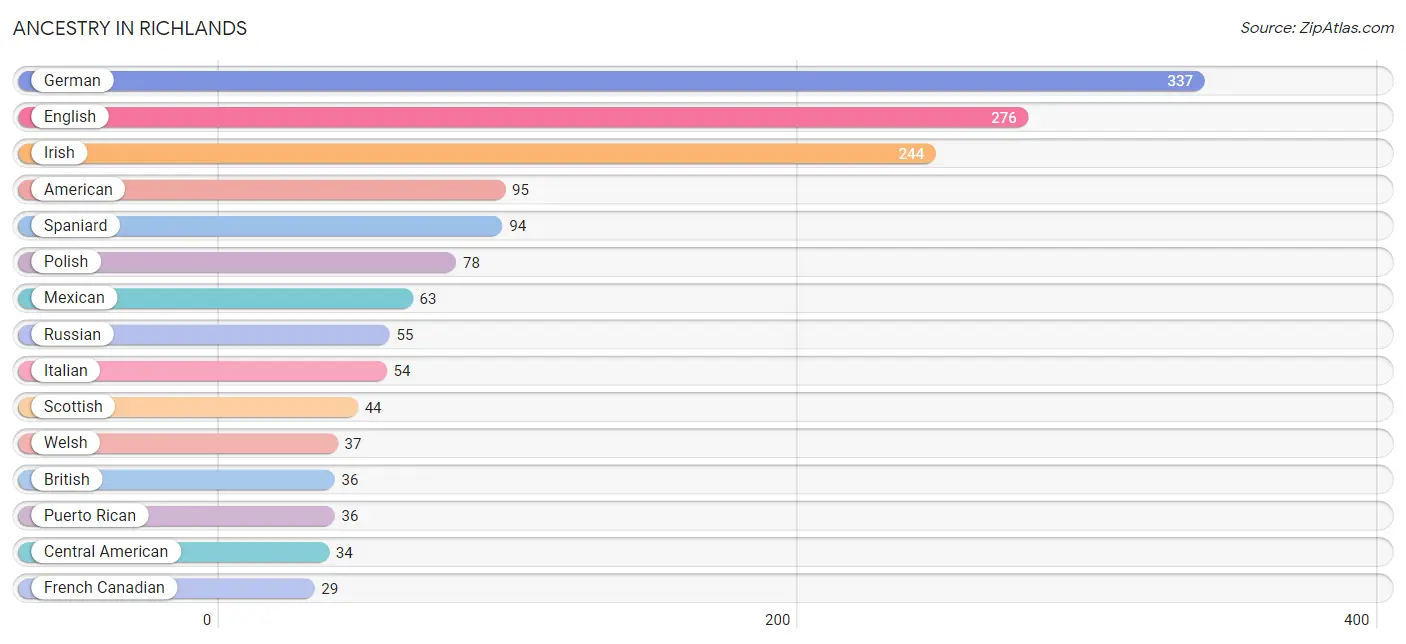
Ancestry in Richlands
The most populous ancestries reported in Richlands are German (337 | 13.1%), English (276 | 10.7%), Irish (244 | 9.5%), American (95 | 3.7%), and Spaniard (94 | 3.6%), together accounting for 40.6% of all Richlands residents.
| Ancestry | # Population | % Population |
| African | 12 | 0.5% |
| American | 95 | 3.7% |
| Armenian | 4 | 0.2% |
| Bermudan | 3 | 0.1% |
| Bhutanese | 24 | 0.9% |
| British | 36 | 1.4% |
| Central American | 34 | 1.3% |
| Cherokee | 13 | 0.5% |
| Choctaw | 6 | 0.2% |
| Cuban | 5 | 0.2% |
| Czech | 3 | 0.1% |
| Czechoslovakian | 6 | 0.2% |
| Dutch | 8 | 0.3% |
| English | 276 | 10.7% |
| European | 19 | 0.7% |
| Filipino | 16 | 0.6% |
| French | 21 | 0.8% |
| French Canadian | 29 | 1.1% |
| German | 337 | 13.1% |
| Guamanian / Chamorro | 7 | 0.3% |
| Haitian | 13 | 0.5% |
| Honduran | 26 | 1.0% |
| Hungarian | 3 | 0.1% |
| Irish | 244 | 9.5% |
| Italian | 54 | 2.1% |
| Korean | 11 | 0.4% |
| Lithuanian | 6 | 0.2% |
| Mexican | 63 | 2.4% |
| Northern European | 1 | 0.0% |
| Norwegian | 9 | 0.4% |
| Polish | 78 | 3.0% |
| Puerto Rican | 36 | 1.4% |
| Romanian | 16 | 0.6% |
| Russian | 55 | 2.1% |
| Salvadoran | 8 | 0.3% |
| Scotch-Irish | 9 | 0.4% |
| Scottish | 44 | 1.7% |
| Spaniard | 94 | 3.6% |
| Subsaharan African | 12 | 0.5% |
| Swedish | 4 | 0.2% |
| Tlingit-Haida | 1 | 0.0% |
| Welsh | 37 | 1.4% | View All 42 Rows |
Immigrants in Richlands
The most numerous immigrant groups reported in Richlands came from Europe (16 | 0.6%), Germany (14 | 0.5%), Western Europe (14 | 0.5%), Italy (2 | 0.1%), and Southern Europe (2 | 0.1%), together accounting for 1.9% of all Richlands residents.
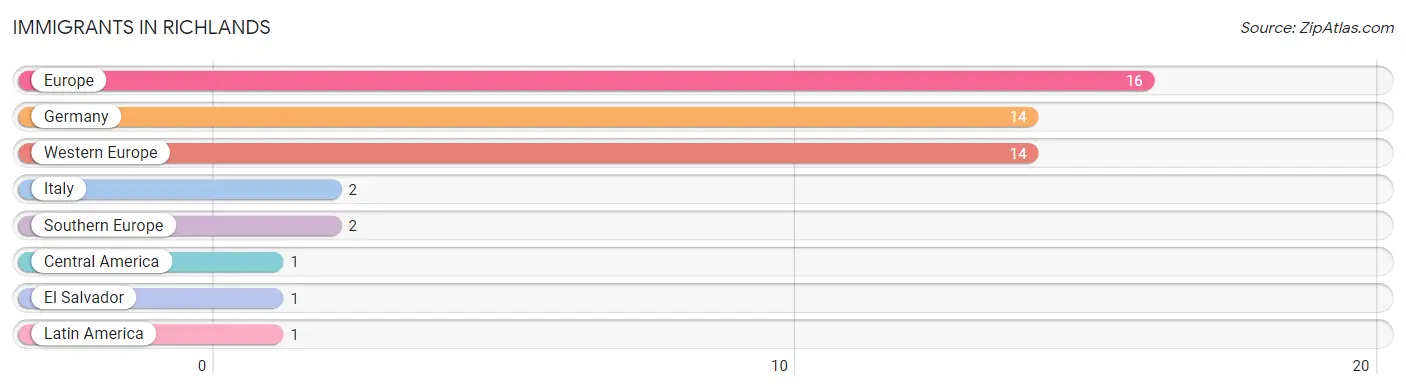
| Immigration Origin | # Population | % Population |
| Central America | 1 | 0.0% |
| El Salvador | 1 | 0.0% |
| Europe | 16 | 0.6% |
| Germany | 14 | 0.5% |
| Italy | 2 | 0.1% |
| Latin America | 1 | 0.0% |
| Southern Europe | 2 | 0.1% |
| Western Europe | 14 | 0.5% | View All 8 Rows |
Sex and Age in Richlands
Sex and Age in Richlands
The most populous age groups in Richlands are 25 to 29 Years (220 | 15.6%) for men and 10 to 14 Years (209 | 17.9%) for women.
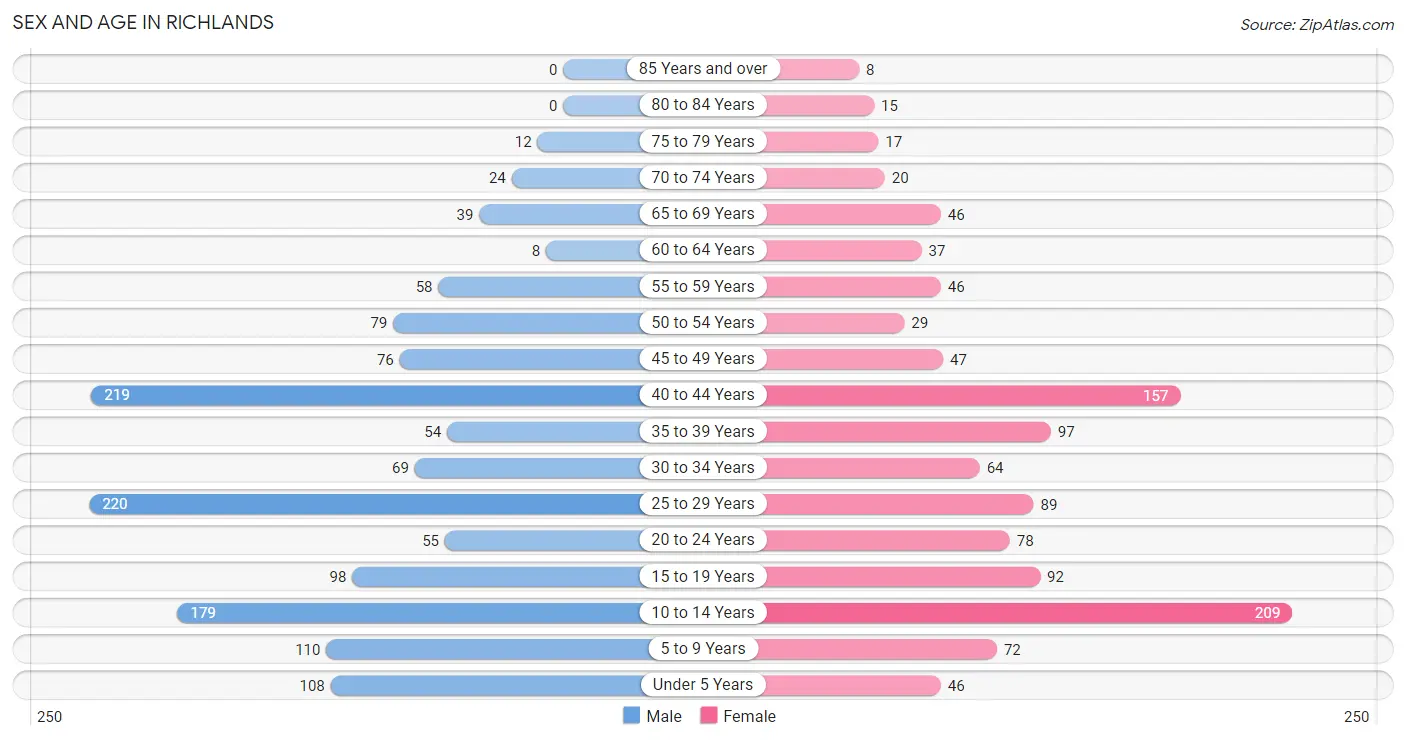
| Age Bracket | Male | Female |
| Under 5 Years | 108 (7.7%) | 46 (3.9%) |
| 5 to 9 Years | 110 (7.8%) | 72 (6.2%) |
| 10 to 14 Years | 179 (12.7%) | 209 (17.9%) |
| 15 to 19 Years | 98 (7.0%) | 92 (7.9%) |
| 20 to 24 Years | 55 (3.9%) | 78 (6.7%) |
| 25 to 29 Years | 220 (15.6%) | 89 (7.6%) |
| 30 to 34 Years | 69 (4.9%) | 64 (5.5%) |
| 35 to 39 Years | 54 (3.8%) | 97 (8.3%) |
| 40 to 44 Years | 219 (15.5%) | 157 (13.4%) |
| 45 to 49 Years | 76 (5.4%) | 47 (4.0%) |
| 50 to 54 Years | 79 (5.6%) | 29 (2.5%) |
| 55 to 59 Years | 58 (4.1%) | 46 (3.9%) |
| 60 to 64 Years | 8 (0.6%) | 37 (3.2%) |
| 65 to 69 Years | 39 (2.8%) | 46 (3.9%) |
| 70 to 74 Years | 24 (1.7%) | 20 (1.7%) |
| 75 to 79 Years | 12 (0.9%) | 17 (1.5%) |
| 80 to 84 Years | 0 (0.0%) | 15 (1.3%) |
| 85 Years and over | 0 (0.0%) | 8 (0.7%) |
| Total | 1,408 (100.0%) | 1,169 (100.0%) |
Families and Households in Richlands
Median Family Size in Richlands
The median family size in Richlands is 4.15 persons per family, with married-couple families (423 | 82.0%) accounting for the largest median family size of 4.31 persons per family. On the other hand, single male/father families (17 | 3.3%) represent the smallest median family size with 2.12 persons per family.
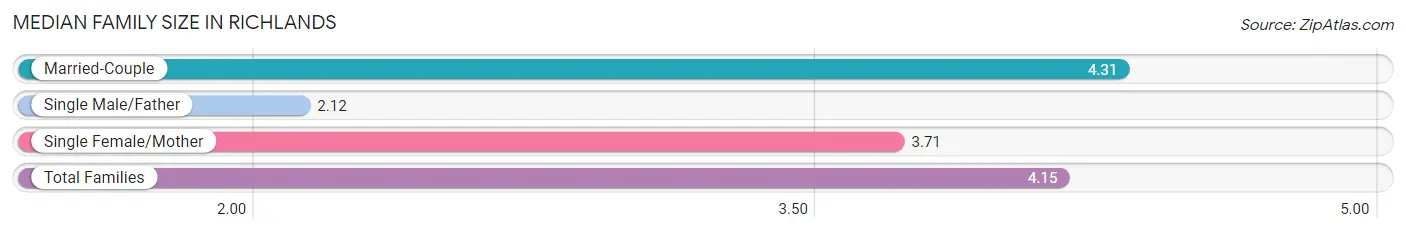
| Family Type | # Families | Family Size |
| Married-Couple | 423 (82.0%) | 4.31 |
| Single Male/Father | 17 (3.3%) | 2.12 |
| Single Female/Mother | 76 (14.7%) | 3.71 |
| Total Families | 516 (100.0%) | 4.15 |
Median Household Size in Richlands
The median household size in Richlands is 3.29 persons per household, with married-couple households (423 | 53.9%) accounting for the largest median household size of 4.33 persons per household. non-family households (268 | 34.2%) represent the smallest median household size with 1.57 persons per household.
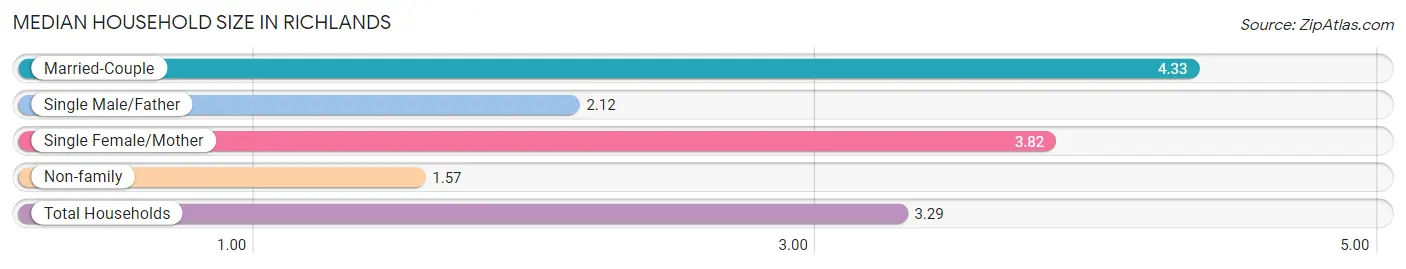
| Household Type | # Households | Household Size |
| Married-Couple | 423 (53.9%) | 4.33 |
| Single Male/Father | 17 (2.2%) | 2.12 |
| Single Female/Mother | 76 (9.7%) | 3.82 |
| Non-family | 268 (34.2%) | 1.57 |
| Total Households | 784 (100.0%) | 3.29 |
Household Size by Marriage Status in Richlands
Out of a total of 784 households in Richlands, 516 (65.8%) are family households, while 268 (34.2%) are nonfamily households. The most numerous type of family households are 2-person households, comprising 155, and the most common type of nonfamily households are 1-person households, comprising 160.
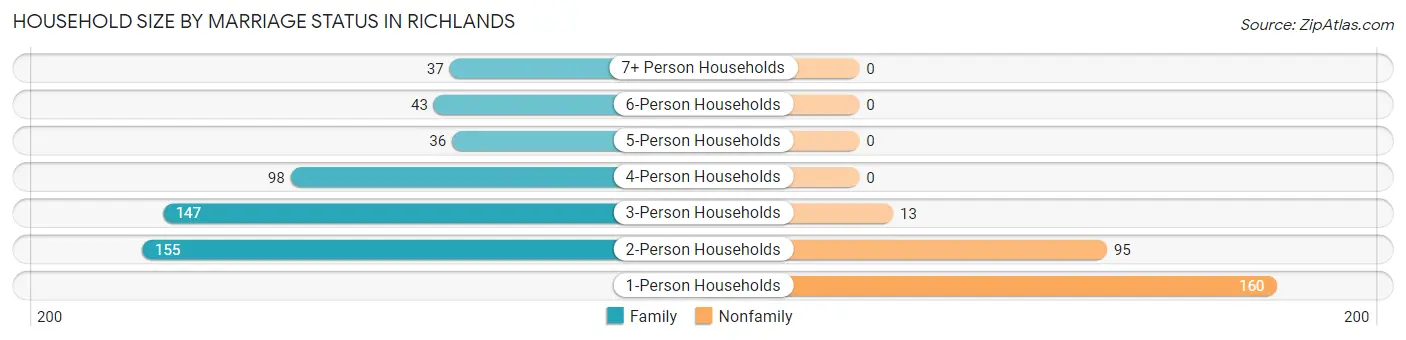
| Household Size | Family Households | Nonfamily Households |
| 1-Person Households | - | 160 (20.4%) |
| 2-Person Households | 155 (19.8%) | 95 (12.1%) |
| 3-Person Households | 147 (18.8%) | 13 (1.7%) |
| 4-Person Households | 98 (12.5%) | 0 (0.0%) |
| 5-Person Households | 36 (4.6%) | 0 (0.0%) |
| 6-Person Households | 43 (5.5%) | 0 (0.0%) |
| 7+ Person Households | 37 (4.7%) | 0 (0.0%) |
| Total | 516 (65.8%) | 268 (34.2%) |
Female Fertility in Richlands
Fertility by Age in Richlands
Average fertility rate in Richlands is 58.0 births per 1,000 women. Women in the age bracket of 20 to 34 years have the highest fertility rate with 113.0 births per 1,000 women. Women in the age bracket of 20 to 34 years acount for 70.3% of all women with births.
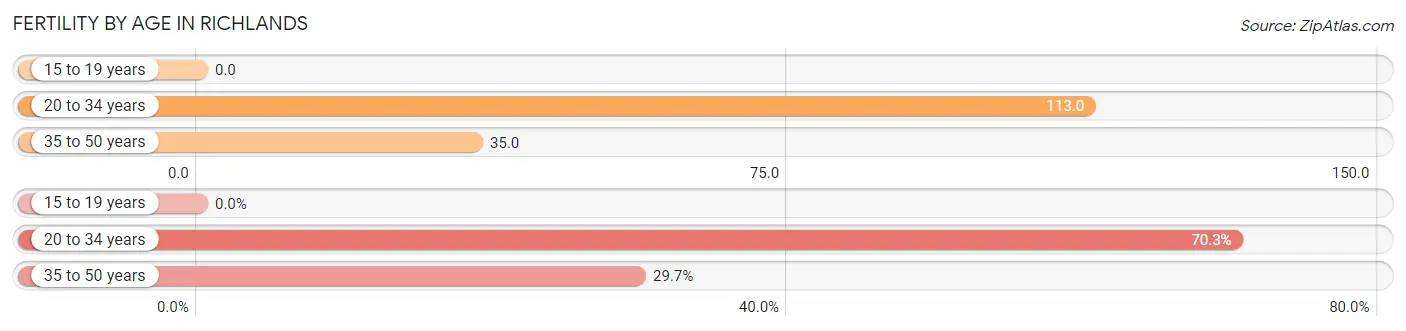
| Age Bracket | Women with Births | Births / 1,000 Women |
| 15 to 19 years | 0 (0.0%) | 0.0 |
| 20 to 34 years | 26 (70.3%) | 113.0 |
| 35 to 50 years | 11 (29.7%) | 35.0 |
| Total | 37 (100.0%) | 58.0 |
Fertility by Age by Marriage Status in Richlands
86.5% of women with births (37) in Richlands are married. The highest percentage of unmarried women with births falls into 35 to 50 years age bracket with 45.5% of them unmarried at the time of birth, while the lowest percentage of unmarried women with births belong to 20 to 34 years age bracket with 0.0% of them unmarried.
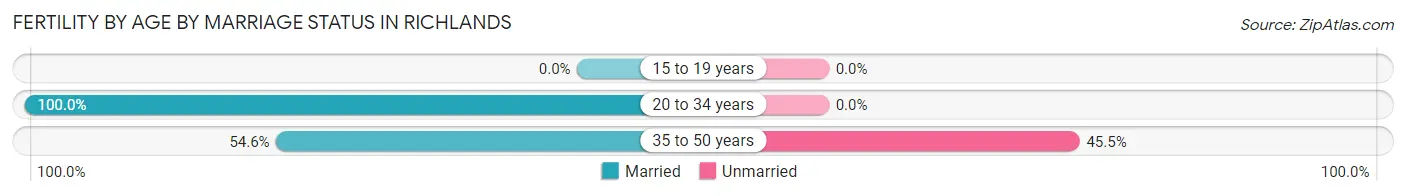
| Age Bracket | Married | Unmarried |
| 15 to 19 years | 0 (0.0%) | 0 (0.0%) |
| 20 to 34 years | 26 (100.0%) | 0 (0.0%) |
| 35 to 50 years | 6 (54.5%) | 5 (45.5%) |
| Total | 32 (86.5%) | 5 (13.5%) |
Fertility by Education in Richlands
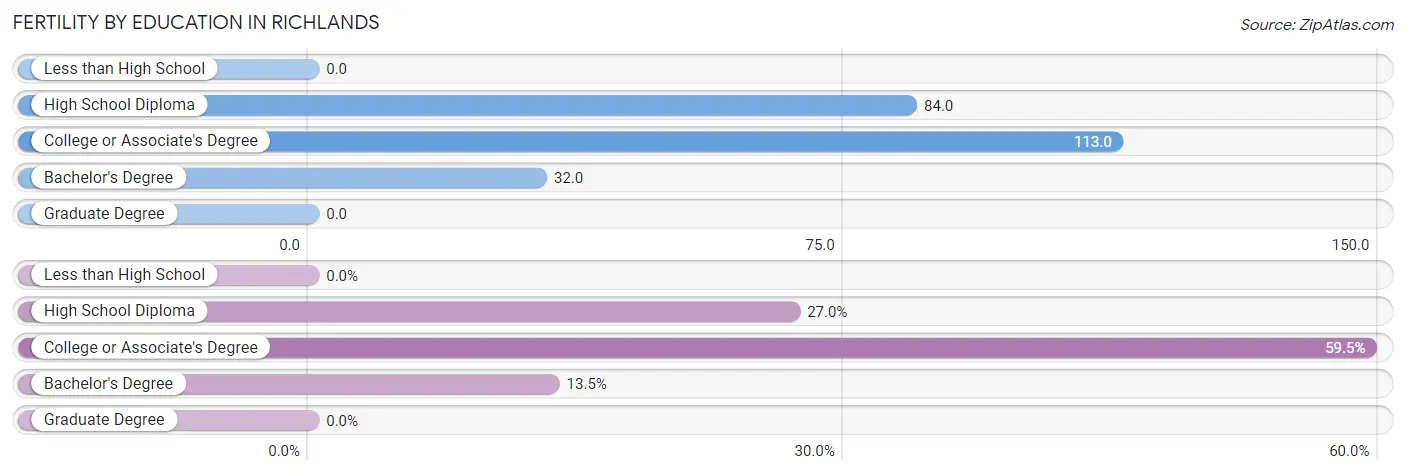
| Educational Attainment | Women with Births | Births / 1,000 Women |
| Less than High School | 0 (0.0%) | 0.0 |
| High School Diploma | 10 (27.0%) | 84.0 |
| College or Associate's Degree | 22 (59.5%) | 113.0 |
| Bachelor's Degree | 5 (13.5%) | 32.0 |
| Graduate Degree | 0 (0.0%) | 0.0 |
| Total | 37 (100.0%) | 58.0 |
Fertility by Education by Marriage Status in Richlands
13.5% of women with births in Richlands are unmarried. Women with the educational attainment of high school diploma are most likely to be married with 100.0% of them married at childbirth, while women with the educational attainment of bachelor's degree are least likely to be married with 100.0% of them unmarried at childbirth.
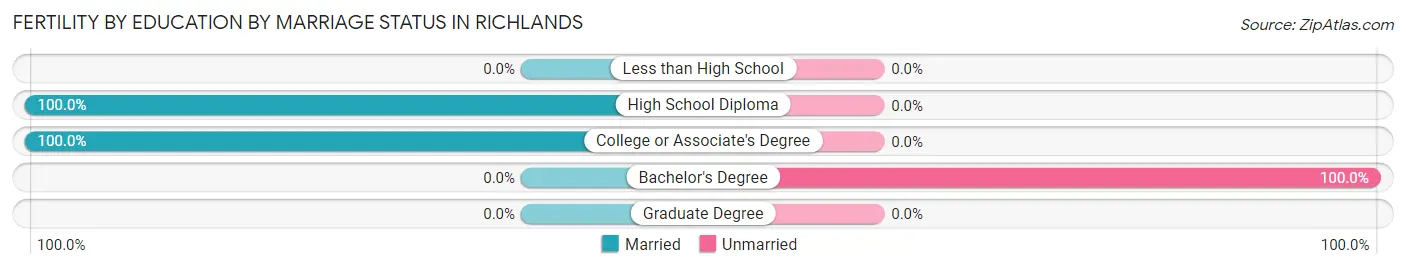
| Educational Attainment | Married | Unmarried |
| Less than High School | 0 (0.0%) | 0 (0.0%) |
| High School Diploma | 10 (100.0%) | 0 (0.0%) |
| College or Associate's Degree | 22 (100.0%) | 0 (0.0%) |
| Bachelor's Degree | 0 (0.0%) | 5 (100.0%) |
| Graduate Degree | 0 (0.0%) | 0 (0.0%) |
| Total | 32 (86.5%) | 5 (13.5%) |
Employment Characteristics in Richlands
Employment by Class of Employer in Richlands
Among the 1,032 employed individuals in Richlands, private company employees (658 | 63.8%), federal government employees (168 | 16.3%), and state government employees (80 | 7.7%) make up the most common classes of employment.
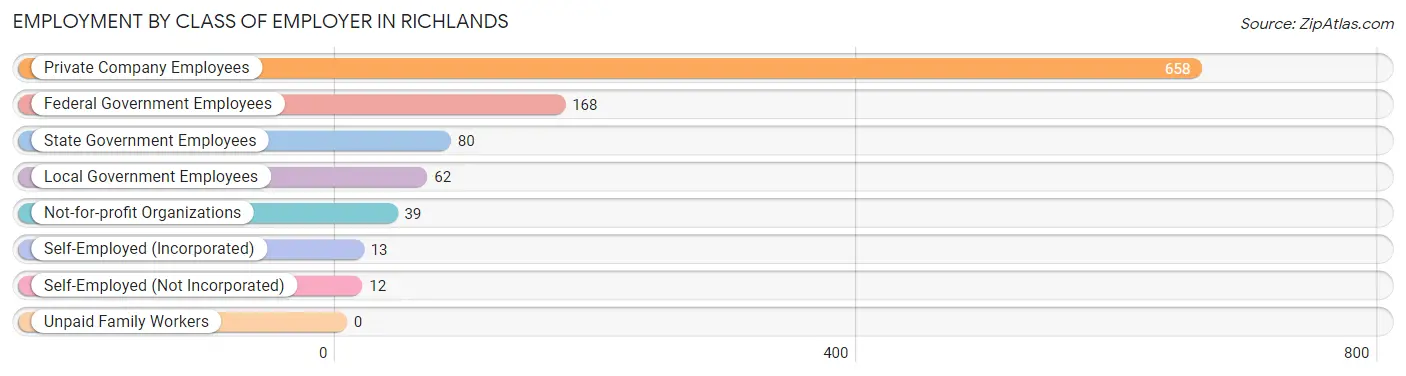
| Employer Class | # Employees | % Employees |
| Private Company Employees | 658 | 63.8% |
| Self-Employed (Incorporated) | 13 | 1.3% |
| Self-Employed (Not Incorporated) | 12 | 1.2% |
| Not-for-profit Organizations | 39 | 3.8% |
| Local Government Employees | 62 | 6.0% |
| State Government Employees | 80 | 7.7% |
| Federal Government Employees | 168 | 16.3% |
| Unpaid Family Workers | 0 | 0.0% |
| Total | 1,032 | 100.0% |
Employment Status by Age in Richlands
According to the labor force statistics for Richlands, out of the total population over 16 years of age (1,813), 65.0% or 1,178 individuals are in the labor force, with 13.6% or 160 of them unemployed. The age group with the highest labor force participation rate is 20 to 24 years, with 91.0% or 121 individuals in the labor force. Within the labor force, the 16 to 19 years age range has the highest percentage of unemployed individuals, with 69.5% or 57 of them being unemployed.
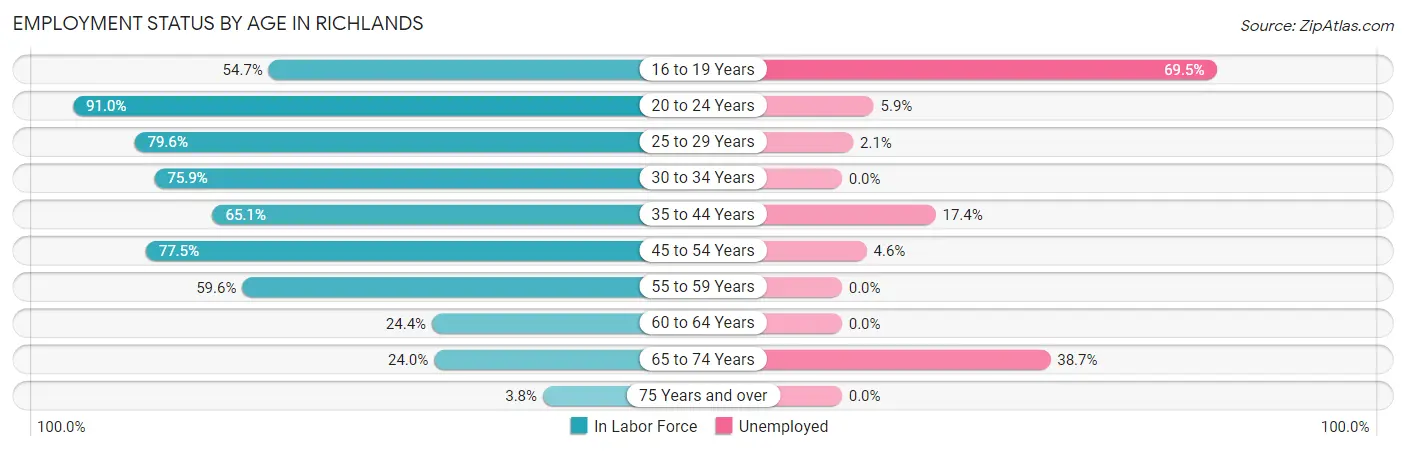
| Age Bracket | In Labor Force | Unemployed |
| 16 to 19 Years | 82 (54.7%) | 57 (69.5%) |
| 20 to 24 Years | 121 (91.0%) | 7 (5.9%) |
| 25 to 29 Years | 246 (79.6%) | 5 (2.1%) |
| 30 to 34 Years | 101 (75.9%) | 0 (0.0%) |
| 35 to 44 Years | 343 (65.1%) | 60 (17.4%) |
| 45 to 54 Years | 179 (77.5%) | 8 (4.6%) |
| 55 to 59 Years | 62 (59.6%) | 0 (0.0%) |
| 60 to 64 Years | 11 (24.4%) | 0 (0.0%) |
| 65 to 74 Years | 31 (24.0%) | 12 (38.7%) |
| 75 Years and over | 2 (3.8%) | 0 (0.0%) |
| Total | 1,178 (65.0%) | 160 (13.6%) |
Employment Status by Educational Attainment in Richlands
According to labor force statistics for Richlands, 69.8% of individuals (942) out of the total population between 25 and 64 years of age (1,349) are in the labor force, with 8.3% or 78 of them being unemployed. The group with the highest labor force participation rate are those with the educational attainment of bachelor's degree or higher, with 79.5% or 295 individuals in the labor force. Within the labor force, individuals with bachelor's degree or higher education have the highest percentage of unemployment, with 20.1% or 59 of them being unemployed.
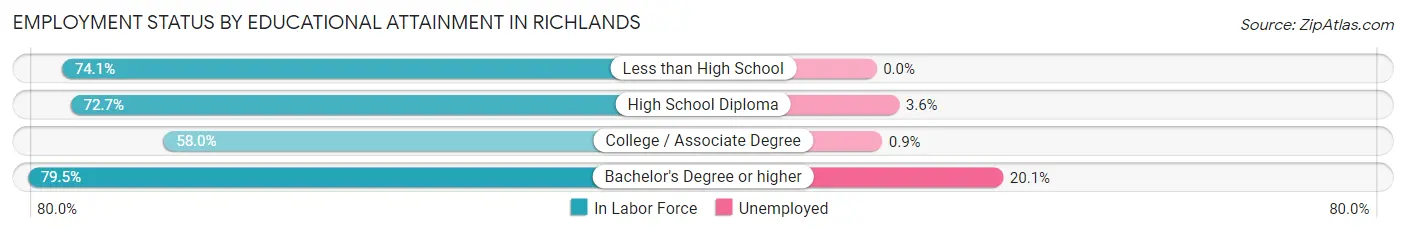
| Educational Attainment | In Labor Force | Unemployed |
| Less than High School | 80 (74.1%) | 0 (0.0%) |
| High School Diploma | 307 (72.7%) | 15 (3.6%) |
| College / Associate Degree | 260 (58.0%) | 4 (0.9%) |
| Bachelor's Degree or higher | 295 (79.5%) | 75 (20.1%) |
| Total | 942 (69.8%) | 112 (8.3%) |
Employment Occupations by Sex in Richlands
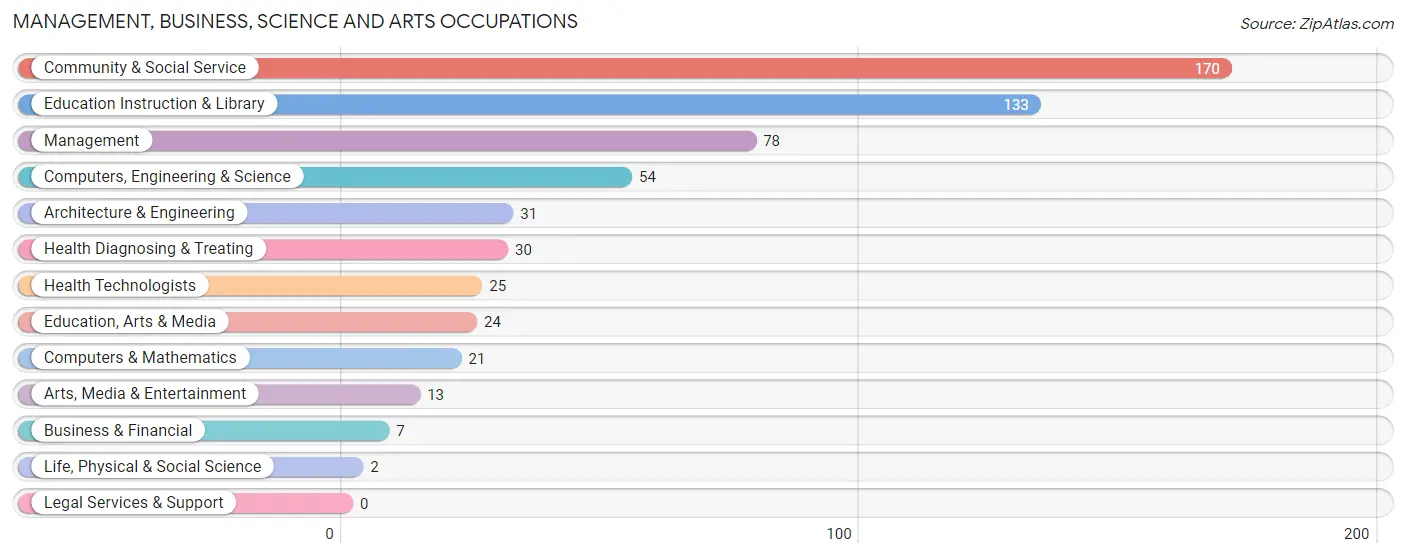
Management, Business, Science and Arts Occupations
The most common Management, Business, Science and Arts occupations in Richlands are Community & Social Service (170 | 18.4%), Education Instruction & Library (133 | 14.4%), Management (78 | 8.4%), Computers, Engineering & Science (54 | 5.8%), and Architecture & Engineering (31 | 3.4%).
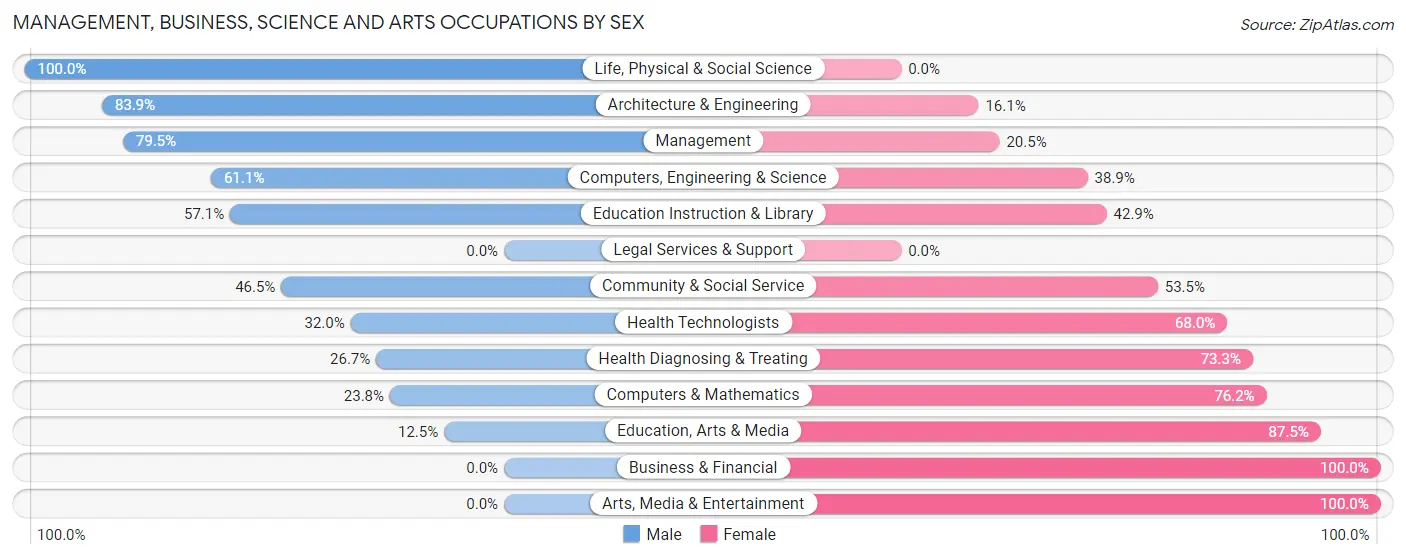
Management, Business, Science and Arts Occupations by Sex
Within the Management, Business, Science and Arts occupations in Richlands, the most male-oriented occupations are Life, Physical & Social Science (100.0%), Architecture & Engineering (83.9%), and Management (79.5%), while the most female-oriented occupations are Business & Financial (100.0%), Arts, Media & Entertainment (100.0%), and Education, Arts & Media (87.5%).
| Occupation | Male | Female |
| Management | 62 (79.5%) | 16 (20.5%) |
| Business & Financial | 0 (0.0%) | 7 (100.0%) |
| Computers, Engineering & Science | 33 (61.1%) | 21 (38.9%) |
| Computers & Mathematics | 5 (23.8%) | 16 (76.2%) |
| Architecture & Engineering | 26 (83.9%) | 5 (16.1%) |
| Life, Physical & Social Science | 2 (100.0%) | 0 (0.0%) |
| Community & Social Service | 79 (46.5%) | 91 (53.5%) |
| Education, Arts & Media | 3 (12.5%) | 21 (87.5%) |
| Legal Services & Support | 0 (0.0%) | 0 (0.0%) |
| Education Instruction & Library | 76 (57.1%) | 57 (42.9%) |
| Arts, Media & Entertainment | 0 (0.0%) | 13 (100.0%) |
| Health Diagnosing & Treating | 8 (26.7%) | 22 (73.3%) |
| Health Technologists | 8 (32.0%) | 17 (68.0%) |
| Total (Category) | 182 (53.7%) | 157 (46.3%) |
| Total (Overall) | 552 (59.7%) | 372 (40.3%) |
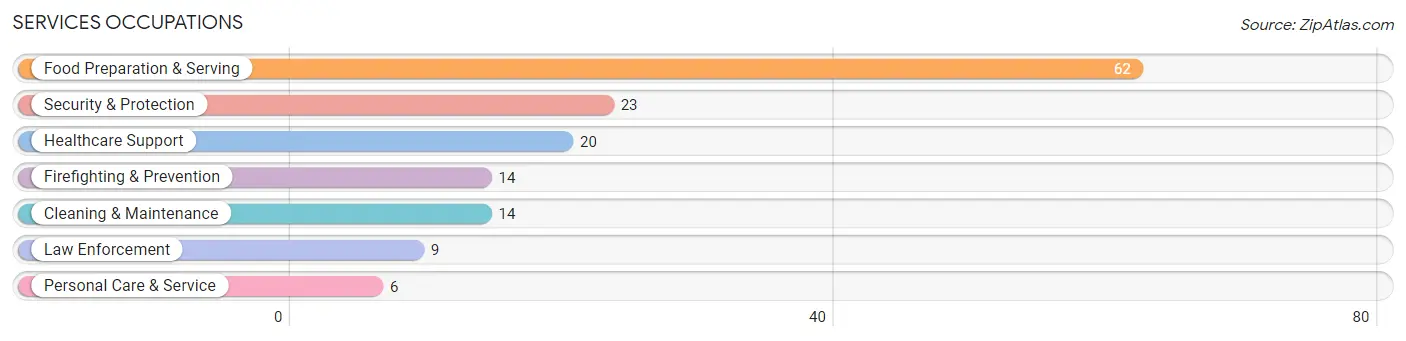
Services Occupations
The most common Services occupations in Richlands are Food Preparation & Serving (62 | 6.7%), Security & Protection (23 | 2.5%), Healthcare Support (20 | 2.2%), Firefighting & Prevention (14 | 1.5%), and Cleaning & Maintenance (14 | 1.5%).
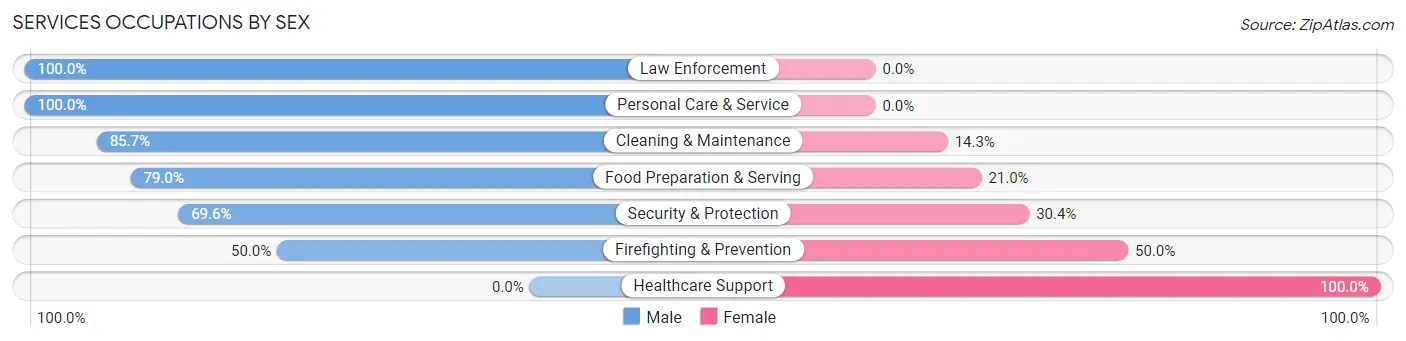
Services Occupations by Sex
Within the Services occupations in Richlands, the most male-oriented occupations are Law Enforcement (100.0%), Personal Care & Service (100.0%), and Cleaning & Maintenance (85.7%), while the most female-oriented occupations are Healthcare Support (100.0%), Firefighting & Prevention (50.0%), and Security & Protection (30.4%).
| Occupation | Male | Female |
| Healthcare Support | 0 (0.0%) | 20 (100.0%) |
| Security & Protection | 16 (69.6%) | 7 (30.4%) |
| Firefighting & Prevention | 7 (50.0%) | 7 (50.0%) |
| Law Enforcement | 9 (100.0%) | 0 (0.0%) |
| Food Preparation & Serving | 49 (79.0%) | 13 (21.0%) |
| Cleaning & Maintenance | 12 (85.7%) | 2 (14.3%) |
| Personal Care & Service | 6 (100.0%) | 0 (0.0%) |
| Total (Category) | 83 (66.4%) | 42 (33.6%) |
| Total (Overall) | 552 (59.7%) | 372 (40.3%) |
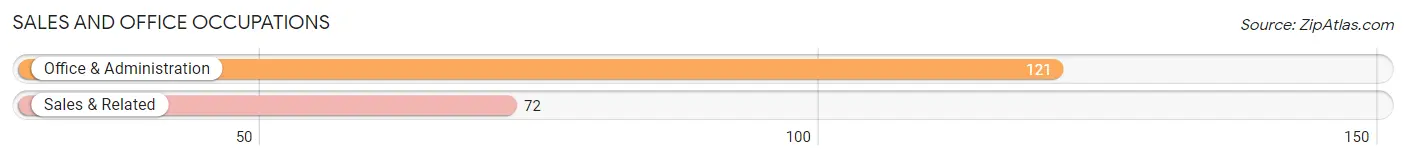
Sales and Office Occupations
The most common Sales and Office occupations in Richlands are Office & Administration (121 | 13.1%), and Sales & Related (72 | 7.8%).
Sales and Office Occupations by Sex
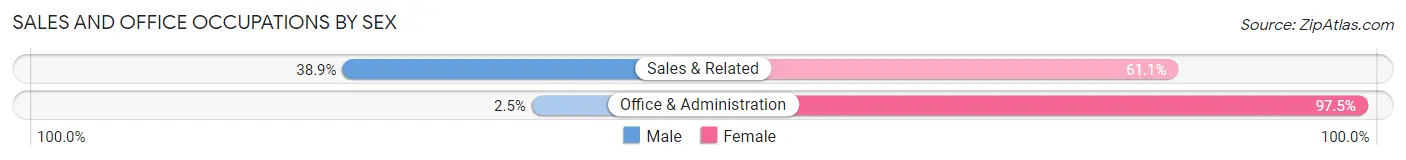
| Occupation | Male | Female |
| Sales & Related | 28 (38.9%) | 44 (61.1%) |
| Office & Administration | 3 (2.5%) | 118 (97.5%) |
| Total (Category) | 31 (16.1%) | 162 (83.9%) |
| Total (Overall) | 552 (59.7%) | 372 (40.3%) |
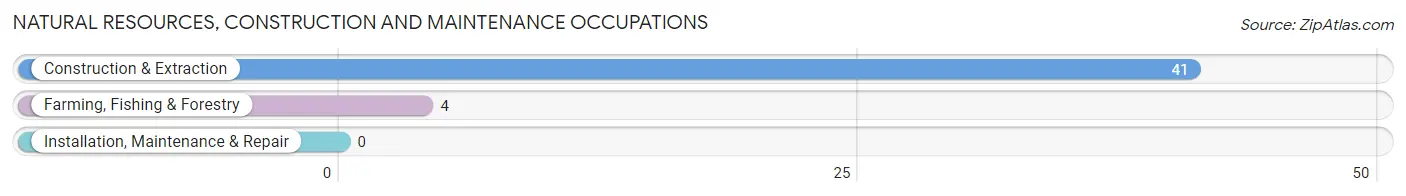
Natural Resources, Construction and Maintenance Occupations
The most common Natural Resources, Construction and Maintenance occupations in Richlands are Construction & Extraction (41 | 4.4%), and Farming, Fishing & Forestry (4 | 0.4%).
Natural Resources, Construction and Maintenance Occupations by Sex
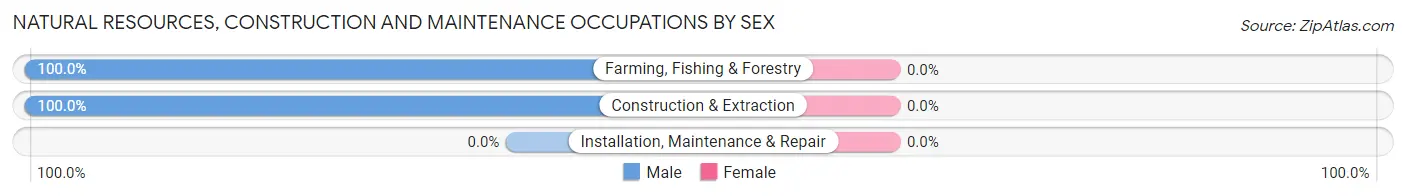
| Occupation | Male | Female |
| Farming, Fishing & Forestry | 4 (100.0%) | 0 (0.0%) |
| Construction & Extraction | 41 (100.0%) | 0 (0.0%) |
| Installation, Maintenance & Repair | 0 (0.0%) | 0 (0.0%) |
| Total (Category) | 45 (100.0%) | 0 (0.0%) |
| Total (Overall) | 552 (59.7%) | 372 (40.3%) |
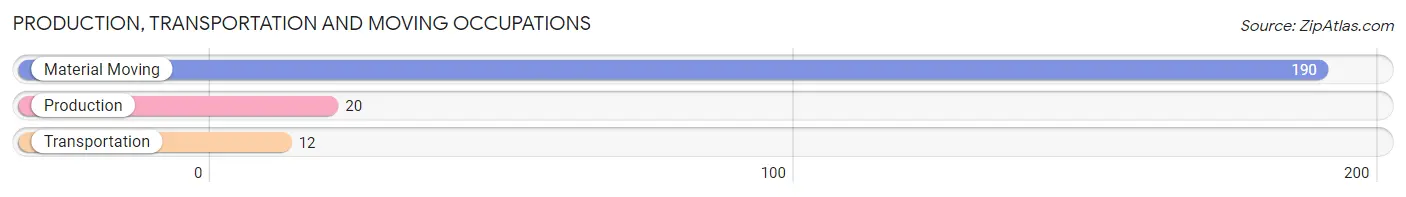
Production, Transportation and Moving Occupations
The most common Production, Transportation and Moving occupations in Richlands are Material Moving (190 | 20.6%), Production (20 | 2.2%), and Transportation (12 | 1.3%).
Production, Transportation and Moving Occupations by Sex
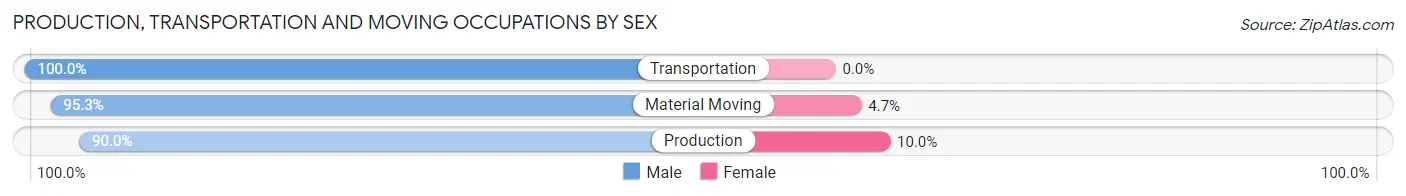
| Occupation | Male | Female |
| Production | 18 (90.0%) | 2 (10.0%) |
| Transportation | 12 (100.0%) | 0 (0.0%) |
| Material Moving | 181 (95.3%) | 9 (4.7%) |
| Total (Category) | 211 (95.1%) | 11 (5.0%) |
| Total (Overall) | 552 (59.7%) | 372 (40.3%) |
Employment Industries by Sex in Richlands
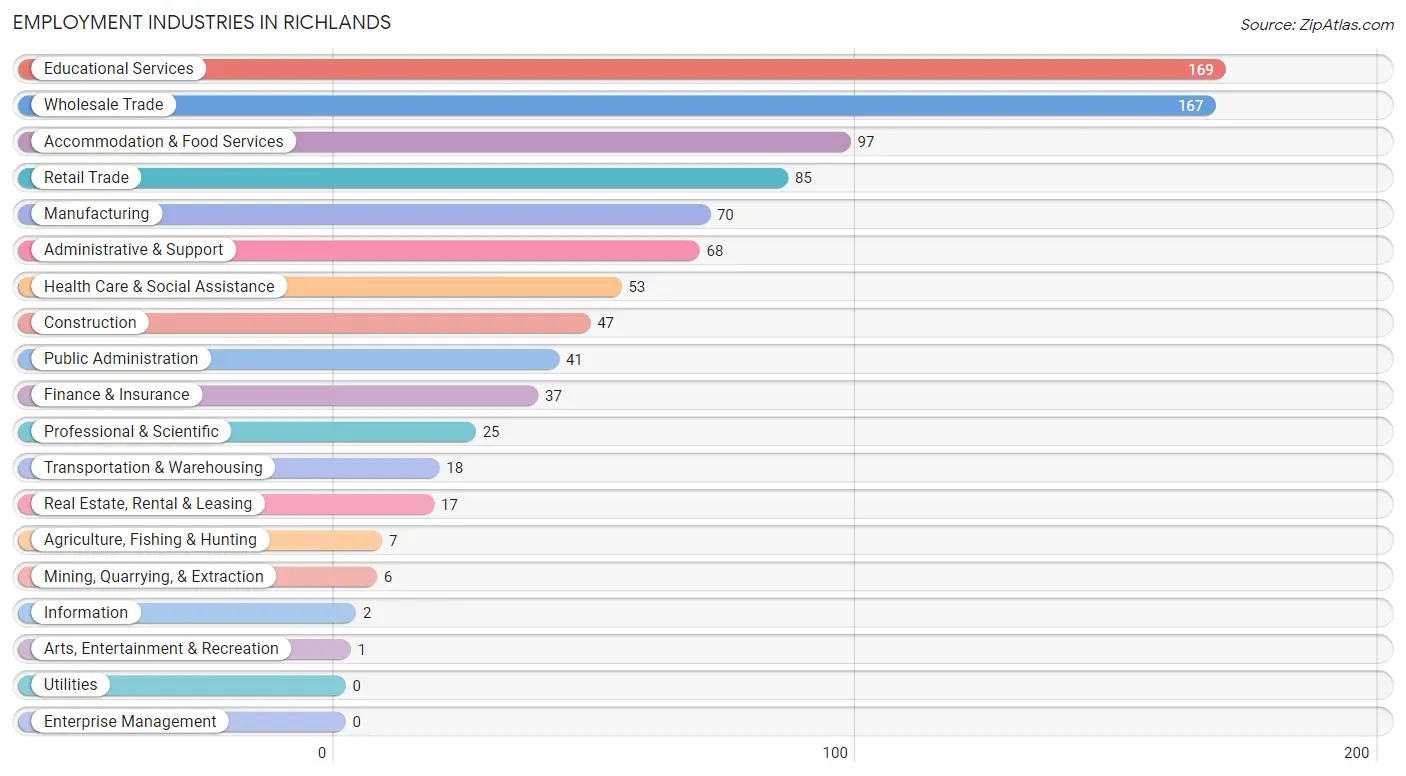
Employment Industries in Richlands
The major employment industries in Richlands include Educational Services (169 | 18.3%), Wholesale Trade (167 | 18.1%), Accommodation & Food Services (97 | 10.5%), Retail Trade (85 | 9.2%), and Manufacturing (70 | 7.6%).
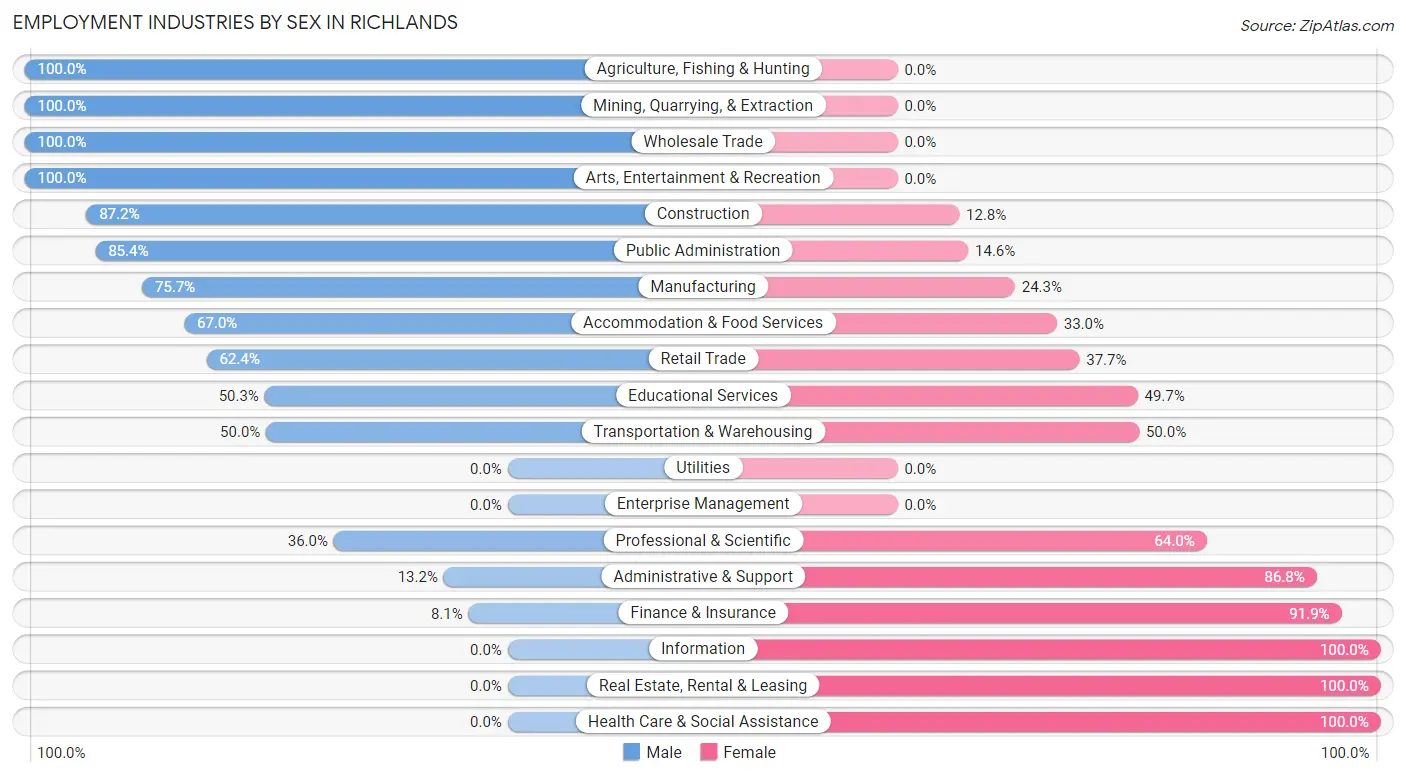
Employment Industries by Sex in Richlands
The Richlands industries that see more men than women are Agriculture, Fishing & Hunting (100.0%), Mining, Quarrying, & Extraction (100.0%), and Wholesale Trade (100.0%), whereas the industries that tend to have a higher number of women are Information (100.0%), Real Estate, Rental & Leasing (100.0%), and Health Care & Social Assistance (100.0%).
| Industry | Male | Female |
| Agriculture, Fishing & Hunting | 7 (100.0%) | 0 (0.0%) |
| Mining, Quarrying, & Extraction | 6 (100.0%) | 0 (0.0%) |
| Construction | 41 (87.2%) | 6 (12.8%) |
| Manufacturing | 53 (75.7%) | 17 (24.3%) |
| Wholesale Trade | 167 (100.0%) | 0 (0.0%) |
| Retail Trade | 53 (62.4%) | 32 (37.7%) |
| Transportation & Warehousing | 9 (50.0%) | 9 (50.0%) |
| Utilities | 0 (0.0%) | 0 (0.0%) |
| Information | 0 (0.0%) | 2 (100.0%) |
| Finance & Insurance | 3 (8.1%) | 34 (91.9%) |
| Real Estate, Rental & Leasing | 0 (0.0%) | 17 (100.0%) |
| Professional & Scientific | 9 (36.0%) | 16 (64.0%) |
| Enterprise Management | 0 (0.0%) | 0 (0.0%) |
| Administrative & Support | 9 (13.2%) | 59 (86.8%) |
| Educational Services | 85 (50.3%) | 84 (49.7%) |
| Health Care & Social Assistance | 0 (0.0%) | 53 (100.0%) |
| Arts, Entertainment & Recreation | 1 (100.0%) | 0 (0.0%) |
| Accommodation & Food Services | 65 (67.0%) | 32 (33.0%) |
| Public Administration | 35 (85.4%) | 6 (14.6%) |
| Total | 552 (59.7%) | 372 (40.3%) |
Education in Richlands
School Enrollment in Richlands
The most common levels of schooling among the 794 students in Richlands are middle school (344 | 43.3%), high school (169 | 21.3%), and elementary school (121 | 15.2%).
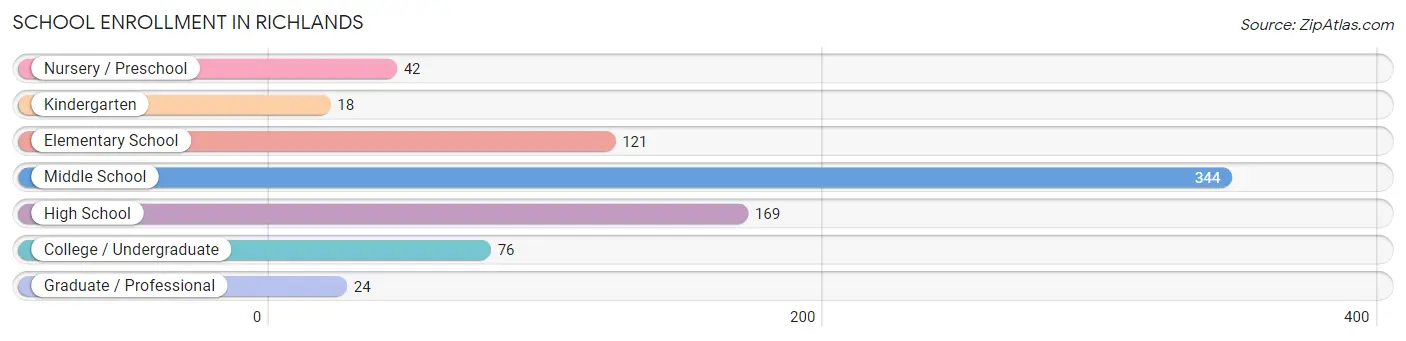
| School Level | # Students | % Students |
| Nursery / Preschool | 42 | 5.3% |
| Kindergarten | 18 | 2.3% |
| Elementary School | 121 | 15.2% |
| Middle School | 344 | 43.3% |
| High School | 169 | 21.3% |
| College / Undergraduate | 76 | 9.6% |
| Graduate / Professional | 24 | 3.0% |
| Total | 794 | 100.0% |
School Enrollment by Age by Funding Source in Richlands
Out of a total of 794 students who are enrolled in schools in Richlands, 160 (20.2%) attend a private institution, while the remaining 634 (79.8%) are enrolled in public schools. The age group of 20 to 24 year olds has the highest likelihood of being enrolled in private schools, with 5 (41.7% in the age bracket) enrolled. Conversely, the age group of 3 to 4 year olds has the lowest likelihood of being enrolled in a private school, with 26 (100.0% in the age bracket) attending a public institution.
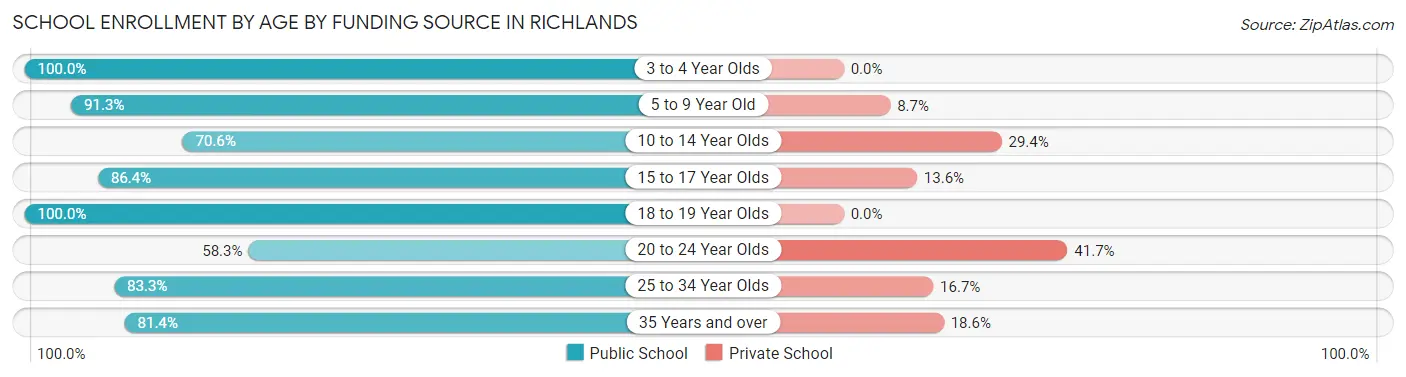
| Age Bracket | Public School | Private School |
| 3 to 4 Year Olds | 26 (100.0%) | 0 (0.0%) |
| 5 to 9 Year Old | 137 (91.3%) | 13 (8.7%) |
| 10 to 14 Year Olds | 264 (70.6%) | 110 (29.4%) |
| 15 to 17 Year Olds | 95 (86.4%) | 15 (13.6%) |
| 18 to 19 Year Olds | 27 (100.0%) | 0 (0.0%) |
| 20 to 24 Year Olds | 7 (58.3%) | 5 (41.7%) |
| 25 to 34 Year Olds | 30 (83.3%) | 6 (16.7%) |
| 35 Years and over | 48 (81.4%) | 11 (18.6%) |
| Total | 634 (79.8%) | 160 (20.2%) |
Educational Attainment by Field of Study in Richlands
Liberal arts & history (78 | 17.9%), education (73 | 16.8%), engineering (54 | 12.4%), bio, nature & agricultural (42 | 9.7%), and arts & humanities (39 | 9.0%) are the most common fields of study among 435 individuals in Richlands who have obtained a bachelor's degree or higher.
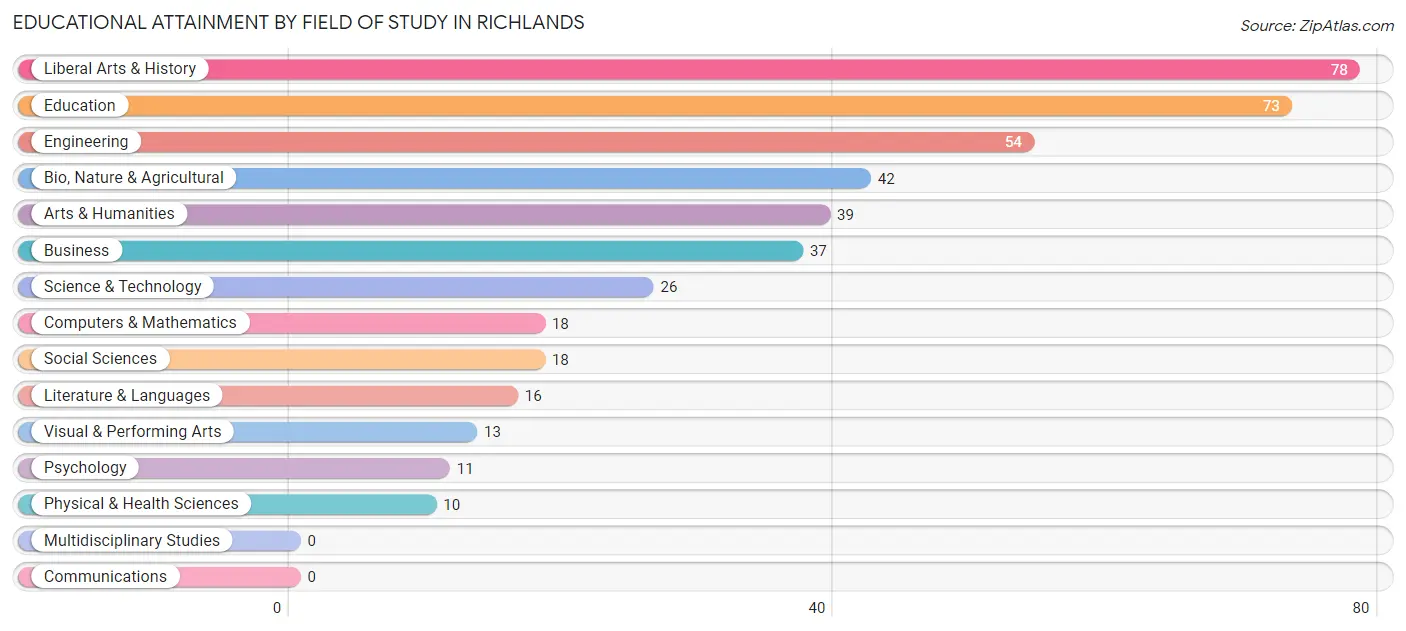
| Field of Study | # Graduates | % Graduates |
| Computers & Mathematics | 18 | 4.1% |
| Bio, Nature & Agricultural | 42 | 9.7% |
| Physical & Health Sciences | 10 | 2.3% |
| Psychology | 11 | 2.5% |
| Social Sciences | 18 | 4.1% |
| Engineering | 54 | 12.4% |
| Multidisciplinary Studies | 0 | 0.0% |
| Science & Technology | 26 | 6.0% |
| Business | 37 | 8.5% |
| Education | 73 | 16.8% |
| Literature & Languages | 16 | 3.7% |
| Liberal Arts & History | 78 | 17.9% |
| Visual & Performing Arts | 13 | 3.0% |
| Communications | 0 | 0.0% |
| Arts & Humanities | 39 | 9.0% |
| Total | 435 | 100.0% |
Transportation & Commute in Richlands
Vehicle Availability by Sex in Richlands
The most prevalent vehicle ownership categories in Richlands are males with 2 vehicles (219, accounting for 33.9%) and females with 2 vehicles (143, making up 56.9%).
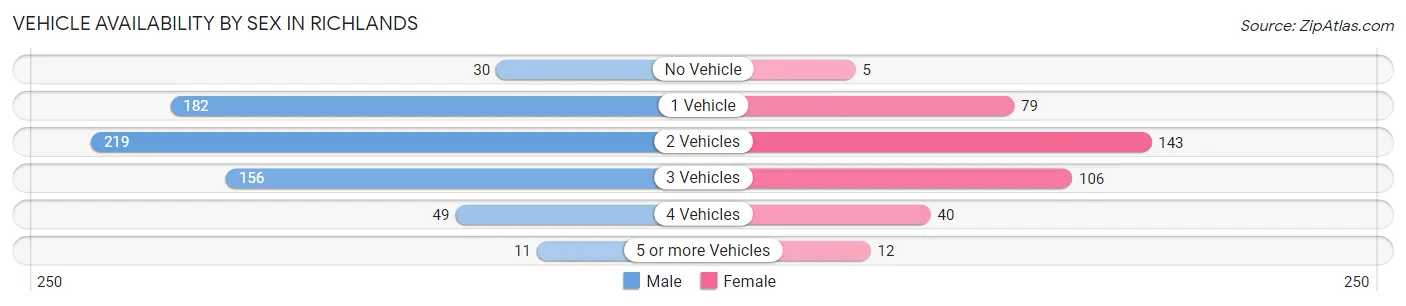
| Vehicles Available | Male | Female |
| No Vehicle | 30 (4.6%) | 5 (1.3%) |
| 1 Vehicle | 182 (28.1%) | 79 (20.5%) |
| 2 Vehicles | 219 (33.9%) | 143 (37.1%) |
| 3 Vehicles | 156 (24.1%) | 106 (27.5%) |
| 4 Vehicles | 49 (7.6%) | 40 (10.4%) |
| 5 or more Vehicles | 11 (1.7%) | 12 (3.1%) |
| Total | 647 (100.0%) | 385 (100.0%) |
Commute Time in Richlands
The most frequently occuring commute durations in Richlands are 30 to 34 minutes (187 commuters, 19.5%), 60 to 89 minutes (157 commuters, 16.4%), and 25 to 29 minutes (117 commuters, 12.2%).
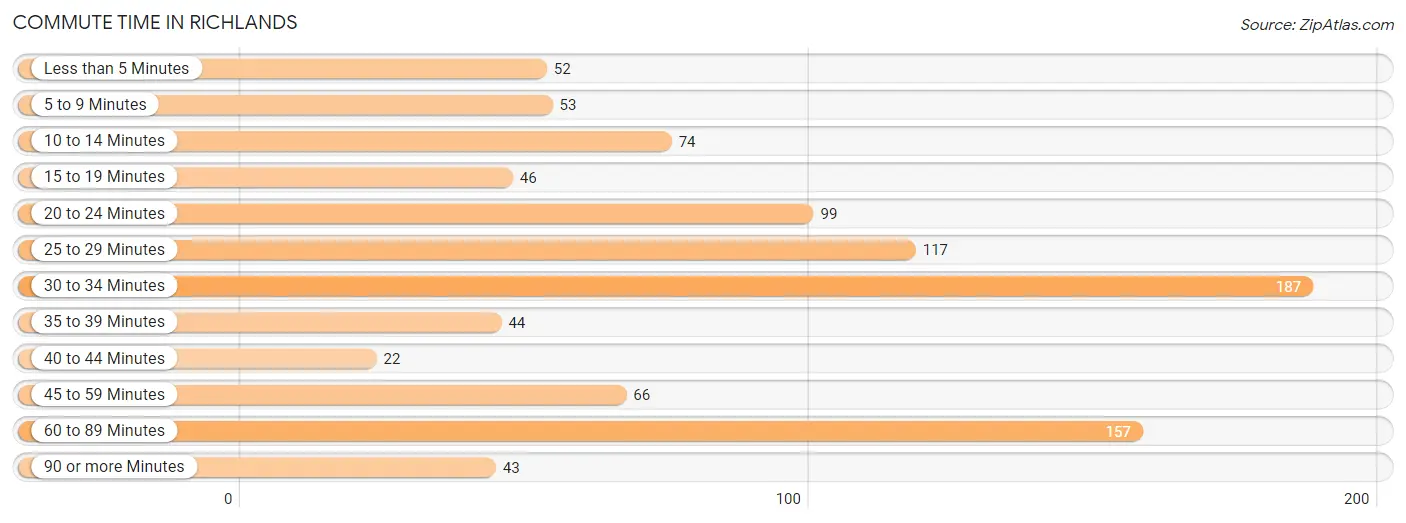
| Commute Time | # Commuters | % Commuters |
| Less than 5 Minutes | 52 | 5.4% |
| 5 to 9 Minutes | 53 | 5.5% |
| 10 to 14 Minutes | 74 | 7.7% |
| 15 to 19 Minutes | 46 | 4.8% |
| 20 to 24 Minutes | 99 | 10.3% |
| 25 to 29 Minutes | 117 | 12.2% |
| 30 to 34 Minutes | 187 | 19.5% |
| 35 to 39 Minutes | 44 | 4.6% |
| 40 to 44 Minutes | 22 | 2.3% |
| 45 to 59 Minutes | 66 | 6.9% |
| 60 to 89 Minutes | 157 | 16.4% |
| 90 or more Minutes | 43 | 4.5% |
Commute Time by Sex in Richlands
The most common commute times in Richlands are 30 to 34 minutes (143 commuters, 22.3%) for males and 20 to 24 minutes (47 commuters, 14.8%) for females.
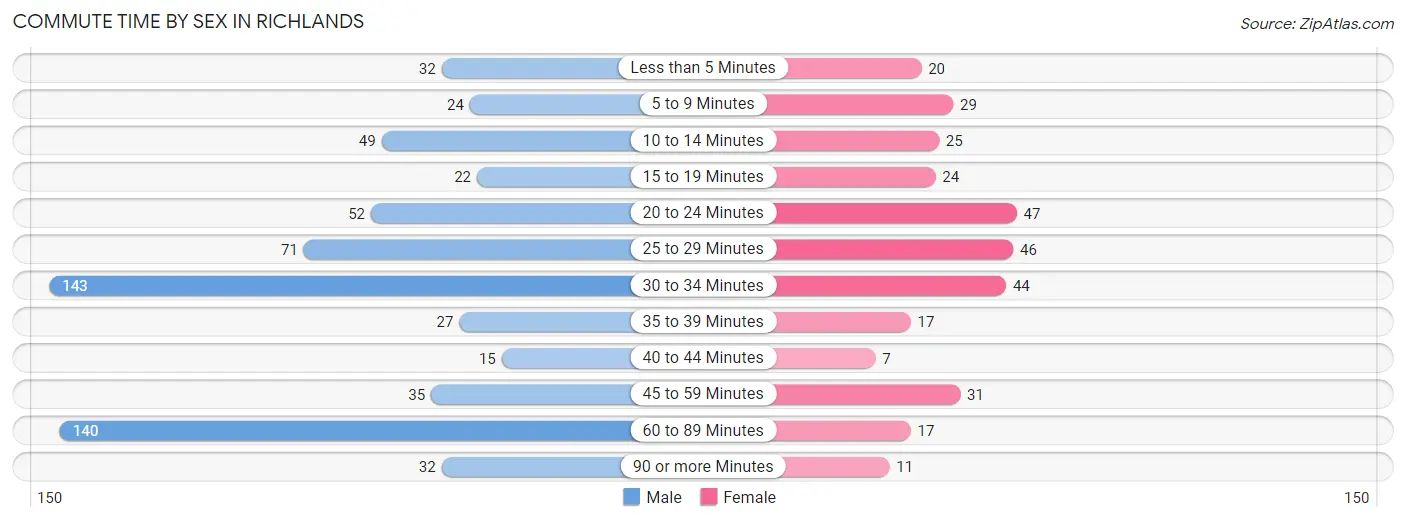
| Commute Time | Male | Female |
| Less than 5 Minutes | 32 (5.0%) | 20 (6.3%) |
| 5 to 9 Minutes | 24 (3.7%) | 29 (9.1%) |
| 10 to 14 Minutes | 49 (7.6%) | 25 (7.9%) |
| 15 to 19 Minutes | 22 (3.4%) | 24 (7.5%) |
| 20 to 24 Minutes | 52 (8.1%) | 47 (14.8%) |
| 25 to 29 Minutes | 71 (11.1%) | 46 (14.5%) |
| 30 to 34 Minutes | 143 (22.3%) | 44 (13.8%) |
| 35 to 39 Minutes | 27 (4.2%) | 17 (5.3%) |
| 40 to 44 Minutes | 15 (2.3%) | 7 (2.2%) |
| 45 to 59 Minutes | 35 (5.4%) | 31 (9.8%) |
| 60 to 89 Minutes | 140 (21.8%) | 17 (5.3%) |
| 90 or more Minutes | 32 (5.0%) | 11 (3.5%) |
Time of Departure to Work by Sex in Richlands
The most frequent times of departure to work in Richlands are 7:00 AM to 7:29 AM (179, 27.9%) for males and 7:30 AM to 7:59 AM (57, 17.9%) for females.
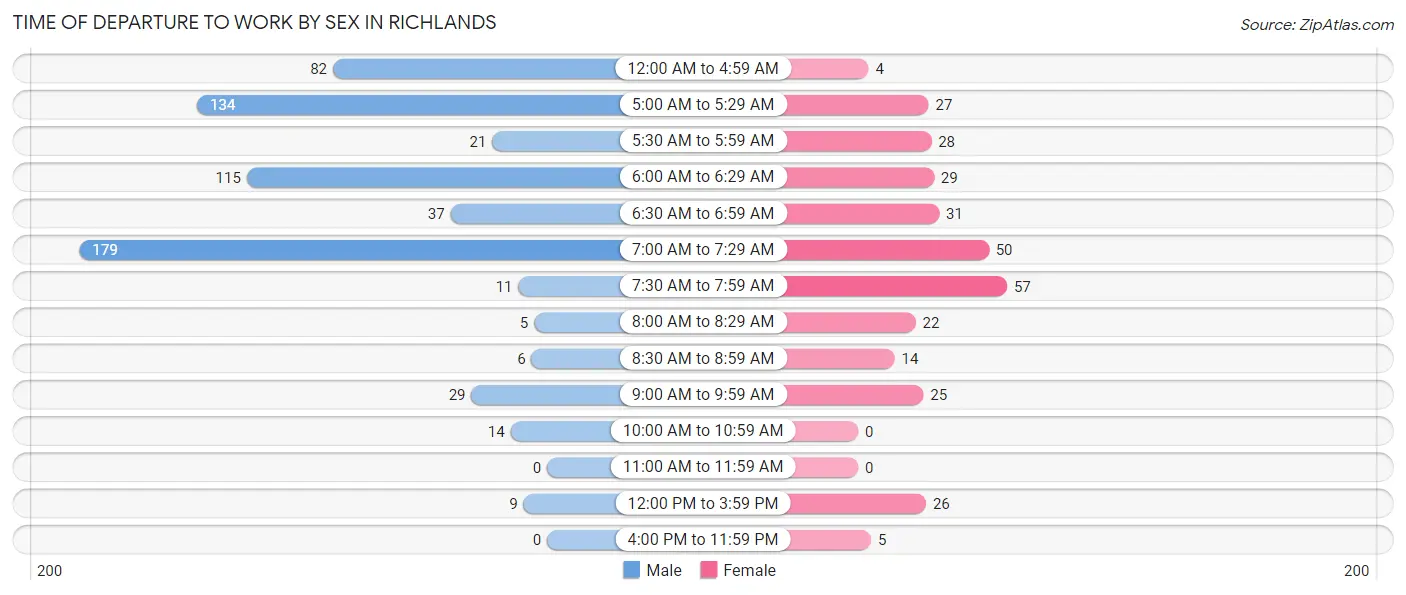
| Time of Departure | Male | Female |
| 12:00 AM to 4:59 AM | 82 (12.8%) | 4 (1.3%) |
| 5:00 AM to 5:29 AM | 134 (20.9%) | 27 (8.5%) |
| 5:30 AM to 5:59 AM | 21 (3.3%) | 28 (8.8%) |
| 6:00 AM to 6:29 AM | 115 (17.9%) | 29 (9.1%) |
| 6:30 AM to 6:59 AM | 37 (5.8%) | 31 (9.8%) |
| 7:00 AM to 7:29 AM | 179 (27.9%) | 50 (15.7%) |
| 7:30 AM to 7:59 AM | 11 (1.7%) | 57 (17.9%) |
| 8:00 AM to 8:29 AM | 5 (0.8%) | 22 (6.9%) |
| 8:30 AM to 8:59 AM | 6 (0.9%) | 14 (4.4%) |
| 9:00 AM to 9:59 AM | 29 (4.5%) | 25 (7.9%) |
| 10:00 AM to 10:59 AM | 14 (2.2%) | 0 (0.0%) |
| 11:00 AM to 11:59 AM | 0 (0.0%) | 0 (0.0%) |
| 12:00 PM to 3:59 PM | 9 (1.4%) | 26 (8.2%) |
| 4:00 PM to 11:59 PM | 0 (0.0%) | 5 (1.6%) |
| Total | 642 (100.0%) | 318 (100.0%) |
Housing Occupancy in Richlands
Occupancy by Ownership in Richlands
Of the total 784 dwellings in Richlands, owner-occupied units account for 511 (65.2%), while renter-occupied units make up 273 (34.8%).
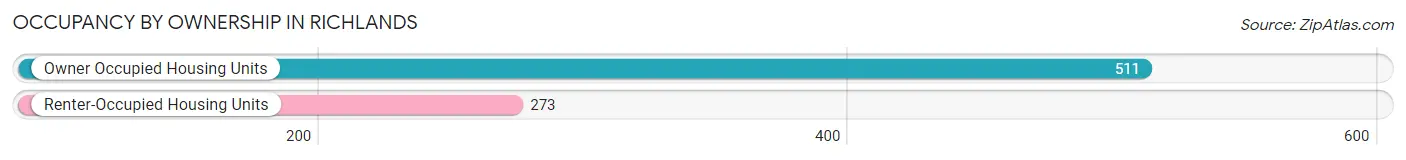
| Occupancy | # Housing Units | % Housing Units |
| Owner Occupied Housing Units | 511 | 65.2% |
| Renter-Occupied Housing Units | 273 | 34.8% |
| Total Occupied Housing Units | 784 | 100.0% |
Occupancy by Household Size in Richlands
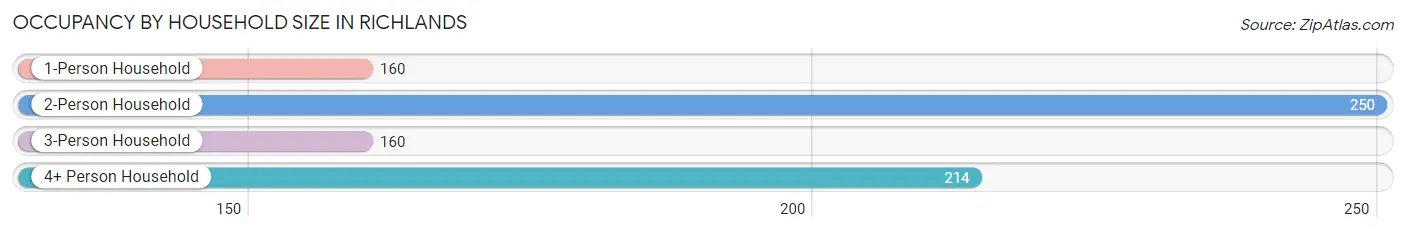
| Household Size | # Housing Units | % Housing Units |
| 1-Person Household | 160 | 20.4% |
| 2-Person Household | 250 | 31.9% |
| 3-Person Household | 160 | 20.4% |
| 4+ Person Household | 214 | 27.3% |
| Total Housing Units | 784 | 100.0% |
Occupancy by Ownership by Household Size in Richlands
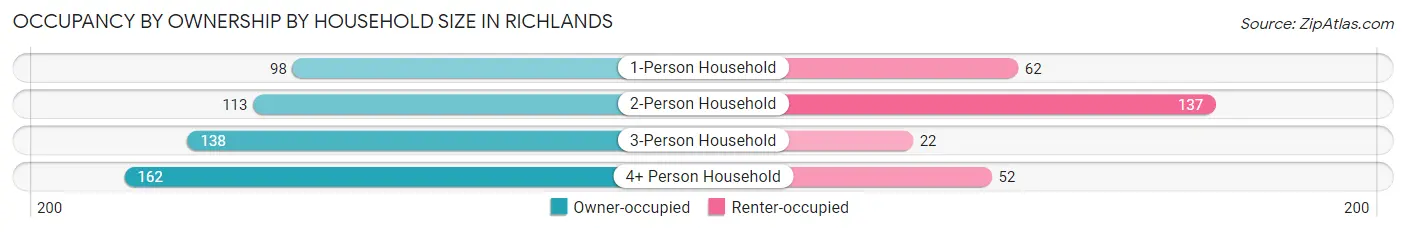
| Household Size | Owner-occupied | Renter-occupied |
| 1-Person Household | 98 (61.3%) | 62 (38.8%) |
| 2-Person Household | 113 (45.2%) | 137 (54.8%) |
| 3-Person Household | 138 (86.3%) | 22 (13.8%) |
| 4+ Person Household | 162 (75.7%) | 52 (24.3%) |
| Total Housing Units | 511 (65.2%) | 273 (34.8%) |
Occupancy by Educational Attainment in Richlands
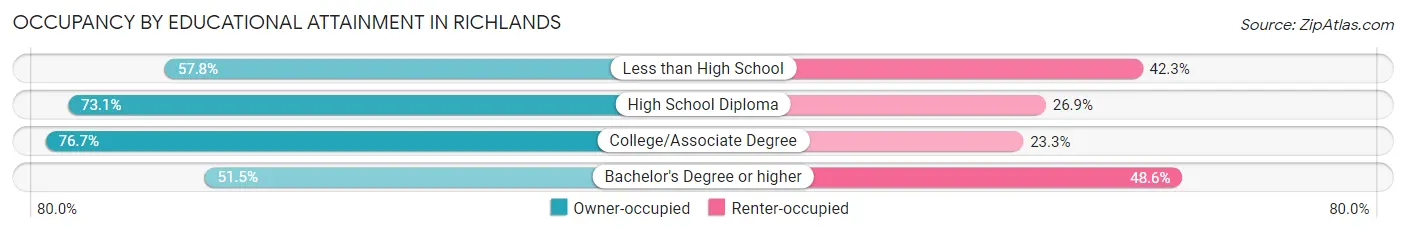
| Household Size | Owner-occupied | Renter-occupied |
| Less than High School | 41 (57.8%) | 30 (42.2%) |
| High School Diploma | 144 (73.1%) | 53 (26.9%) |
| College/Associate Degree | 184 (76.7%) | 56 (23.3%) |
| Bachelor's Degree or higher | 142 (51.4%) | 134 (48.5%) |
Occupancy by Age of Householder in Richlands
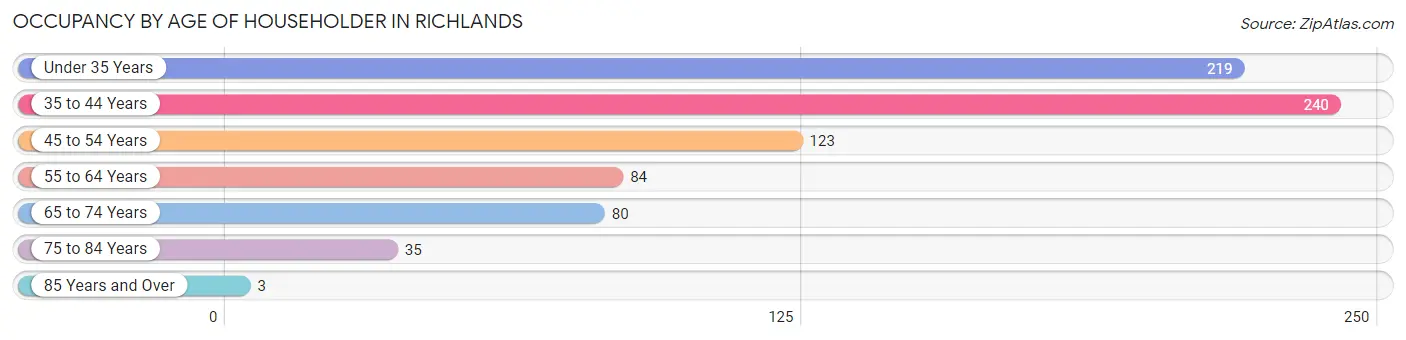
| Age Bracket | # Households | % Households |
| Under 35 Years | 219 | 27.9% |
| 35 to 44 Years | 240 | 30.6% |
| 45 to 54 Years | 123 | 15.7% |
| 55 to 64 Years | 84 | 10.7% |
| 65 to 74 Years | 80 | 10.2% |
| 75 to 84 Years | 35 | 4.5% |
| 85 Years and Over | 3 | 0.4% |
| Total | 784 | 100.0% |
Housing Finances in Richlands
Median Income by Occupancy in Richlands
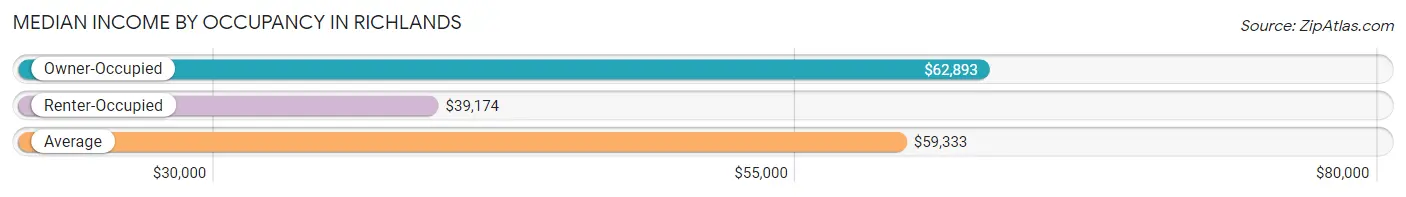
| Occupancy Type | # Households | Median Income |
| Owner-Occupied | 511 (65.2%) | $62,893 |
| Renter-Occupied | 273 (34.8%) | $39,174 |
| Average | 784 (100.0%) | $59,333 |
Occupancy by Householder Income Bracket in Richlands
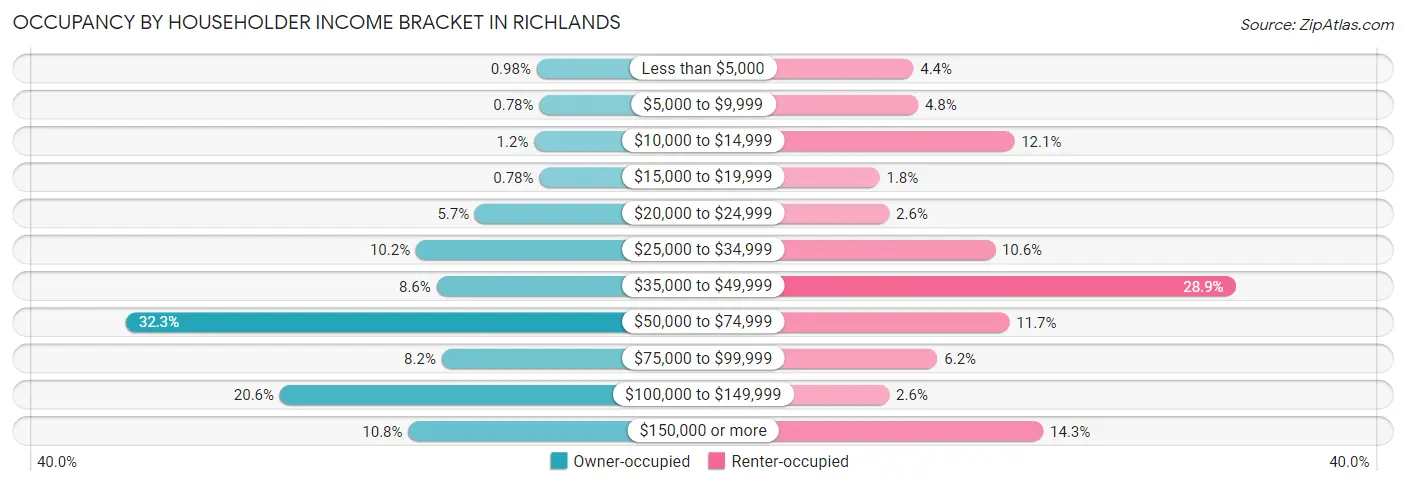
| Income Bracket | Owner-occupied | Renter-occupied |
| Less than $5,000 | 5 (1.0%) | 12 (4.4%) |
| $5,000 to $9,999 | 4 (0.8%) | 13 (4.8%) |
| $10,000 to $14,999 | 6 (1.2%) | 33 (12.1%) |
| $15,000 to $19,999 | 4 (0.8%) | 5 (1.8%) |
| $20,000 to $24,999 | 29 (5.7%) | 7 (2.6%) |
| $25,000 to $34,999 | 52 (10.2%) | 29 (10.6%) |
| $35,000 to $49,999 | 44 (8.6%) | 79 (28.9%) |
| $50,000 to $74,999 | 165 (32.3%) | 32 (11.7%) |
| $75,000 to $99,999 | 42 (8.2%) | 17 (6.2%) |
| $100,000 to $149,999 | 105 (20.5%) | 7 (2.6%) |
| $150,000 or more | 55 (10.8%) | 39 (14.3%) |
| Total | 511 (100.0%) | 273 (100.0%) |
Monthly Housing Cost Tiers in Richlands
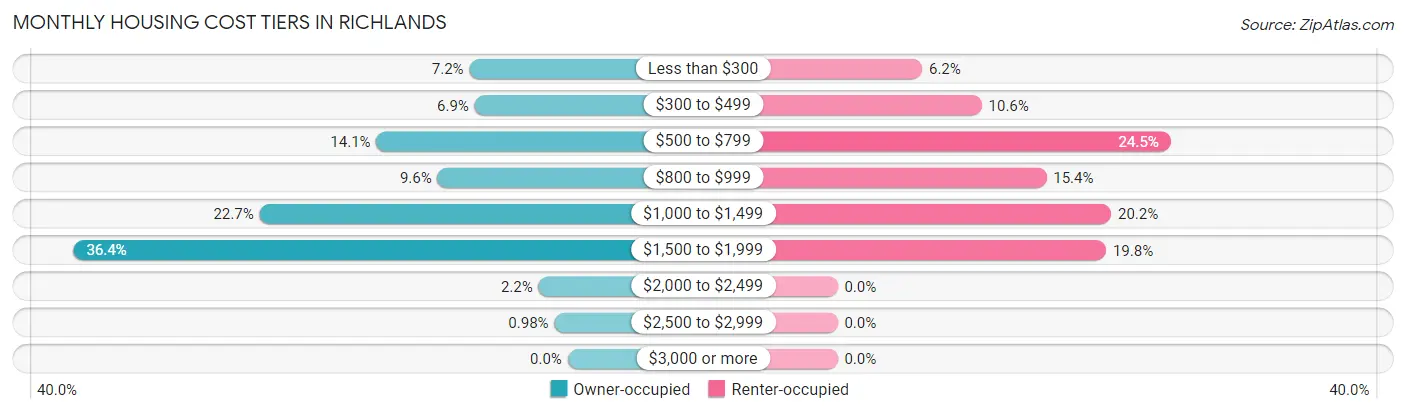
| Monthly Cost | Owner-occupied | Renter-occupied |
| Less than $300 | 37 (7.2%) | 17 (6.2%) |
| $300 to $499 | 35 (6.9%) | 29 (10.6%) |
| $500 to $799 | 72 (14.1%) | 67 (24.5%) |
| $800 to $999 | 49 (9.6%) | 42 (15.4%) |
| $1,000 to $1,499 | 116 (22.7%) | 55 (20.2%) |
| $1,500 to $1,999 | 186 (36.4%) | 54 (19.8%) |
| $2,000 to $2,499 | 11 (2.1%) | 0 (0.0%) |
| $2,500 to $2,999 | 5 (1.0%) | 0 (0.0%) |
| $3,000 or more | 0 (0.0%) | 0 (0.0%) |
| Total | 511 (100.0%) | 273 (100.0%) |
Physical Housing Characteristics in Richlands
Housing Structures in Richlands
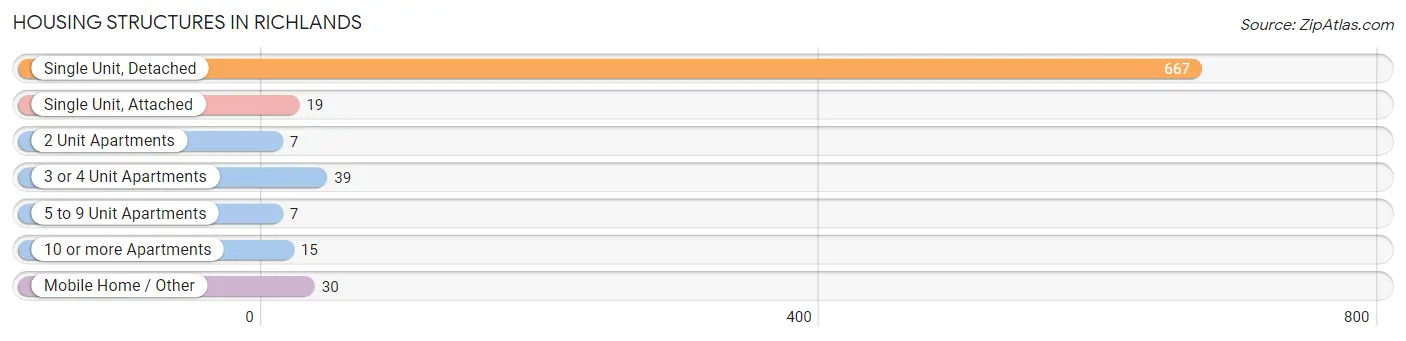
| Structure Type | # Housing Units | % Housing Units |
| Single Unit, Detached | 667 | 85.1% |
| Single Unit, Attached | 19 | 2.4% |
| 2 Unit Apartments | 7 | 0.9% |
| 3 or 4 Unit Apartments | 39 | 5.0% |
| 5 to 9 Unit Apartments | 7 | 0.9% |
| 10 or more Apartments | 15 | 1.9% |
| Mobile Home / Other | 30 | 3.8% |
| Total | 784 | 100.0% |
Housing Structures by Occupancy in Richlands
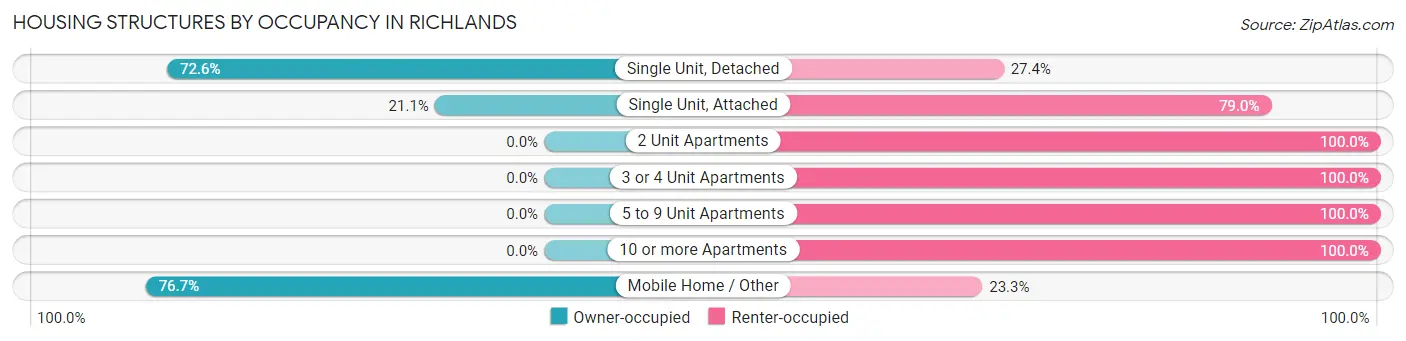
| Structure Type | Owner-occupied | Renter-occupied |
| Single Unit, Detached | 484 (72.6%) | 183 (27.4%) |
| Single Unit, Attached | 4 (21.0%) | 15 (78.9%) |
| 2 Unit Apartments | 0 (0.0%) | 7 (100.0%) |
| 3 or 4 Unit Apartments | 0 (0.0%) | 39 (100.0%) |
| 5 to 9 Unit Apartments | 0 (0.0%) | 7 (100.0%) |
| 10 or more Apartments | 0 (0.0%) | 15 (100.0%) |
| Mobile Home / Other | 23 (76.7%) | 7 (23.3%) |
| Total | 511 (65.2%) | 273 (34.8%) |
Housing Structures by Number of Rooms in Richlands
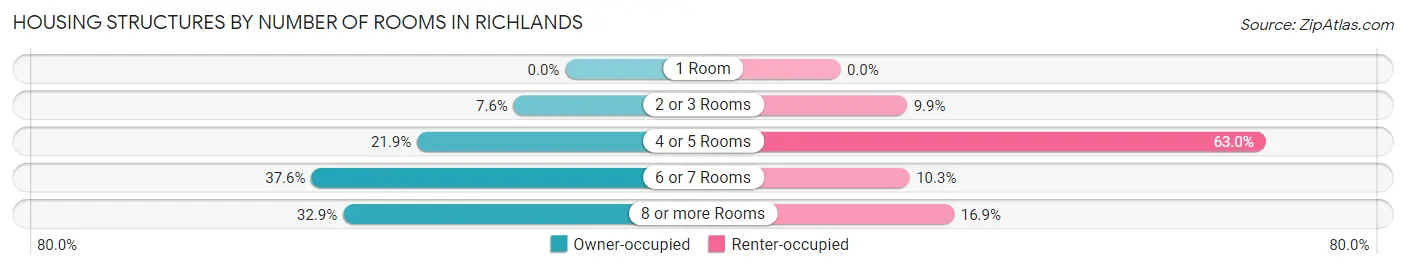
| Number of Rooms | Owner-occupied | Renter-occupied |
| 1 Room | 0 (0.0%) | 0 (0.0%) |
| 2 or 3 Rooms | 39 (7.6%) | 27 (9.9%) |
| 4 or 5 Rooms | 112 (21.9%) | 172 (63.0%) |
| 6 or 7 Rooms | 192 (37.6%) | 28 (10.3%) |
| 8 or more Rooms | 168 (32.9%) | 46 (16.9%) |
| Total | 511 (100.0%) | 273 (100.0%) |
Housing Structure by Heating Type in Richlands
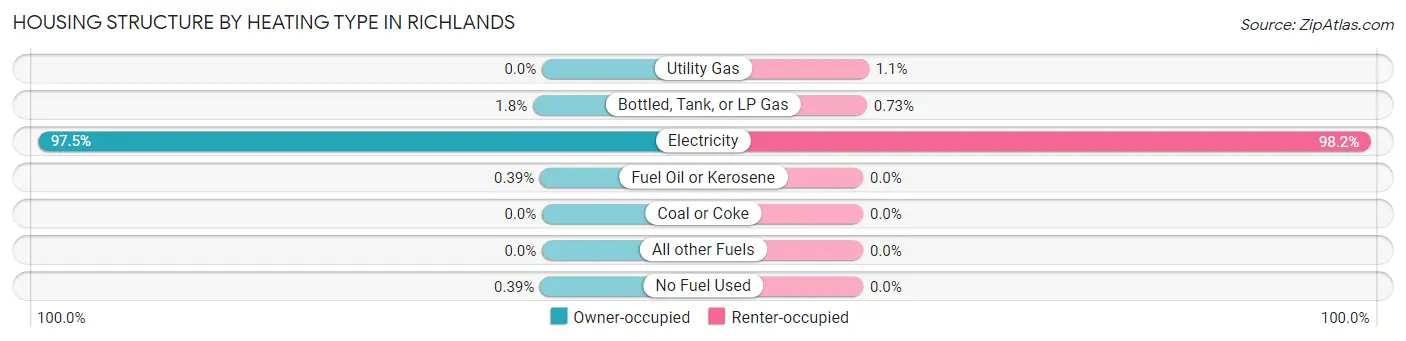
| Heating Type | Owner-occupied | Renter-occupied |
| Utility Gas | 0 (0.0%) | 3 (1.1%) |
| Bottled, Tank, or LP Gas | 9 (1.8%) | 2 (0.7%) |
| Electricity | 498 (97.5%) | 268 (98.2%) |
| Fuel Oil or Kerosene | 2 (0.4%) | 0 (0.0%) |
| Coal or Coke | 0 (0.0%) | 0 (0.0%) |
| All other Fuels | 0 (0.0%) | 0 (0.0%) |
| No Fuel Used | 2 (0.4%) | 0 (0.0%) |
| Total | 511 (100.0%) | 273 (100.0%) |
Household Vehicle Usage in Richlands
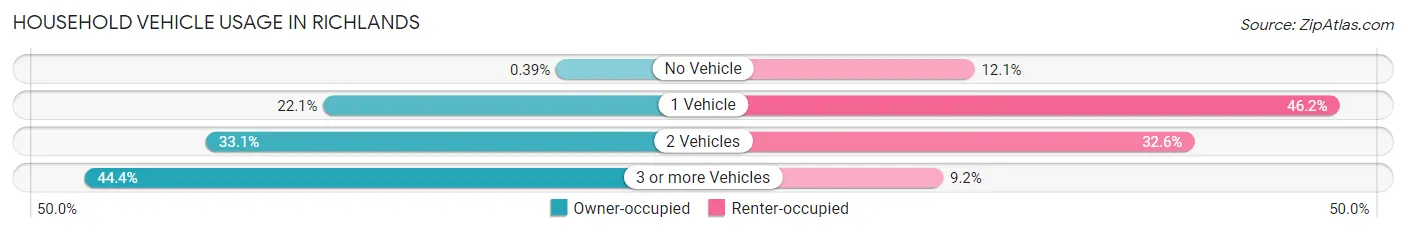
| Vehicles per Household | Owner-occupied | Renter-occupied |
| No Vehicle | 2 (0.4%) | 33 (12.1%) |
| 1 Vehicle | 113 (22.1%) | 126 (46.2%) |
| 2 Vehicles | 169 (33.1%) | 89 (32.6%) |
| 3 or more Vehicles | 227 (44.4%) | 25 (9.2%) |
| Total | 511 (100.0%) | 273 (100.0%) |
Real Estate & Mortgages in Richlands
Real Estate and Mortgage Overview in Richlands
| Characteristic | Without Mortgage | With Mortgage |
| Housing Units | 109 | 402 |
| Median Property Value | $177,500 | $203,500 |
| Median Household Income | $61,875 | $47 |
| Monthly Housing Costs | $378 | $0 |
| Real Estate Taxes | $1,274 | $0 |
Property Value by Mortgage Status in Richlands
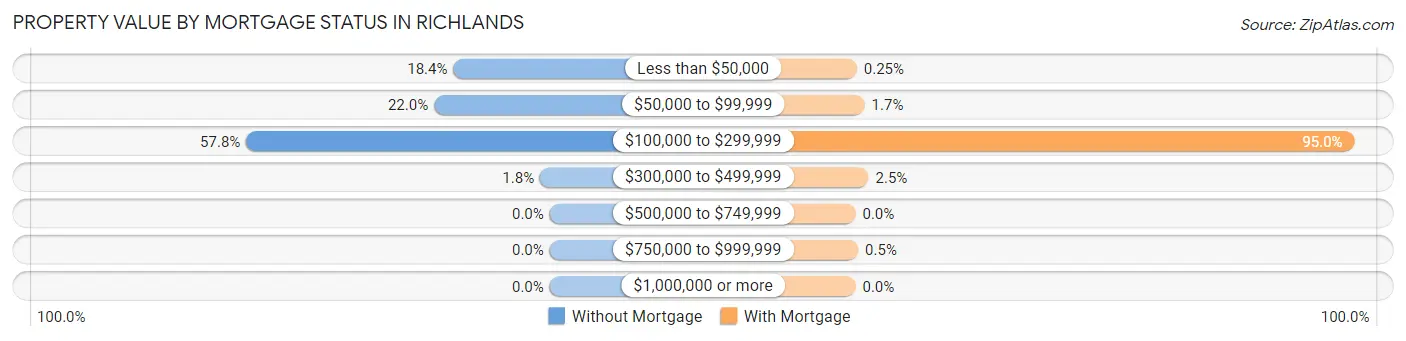
| Property Value | Without Mortgage | With Mortgage |
| Less than $50,000 | 20 (18.3%) | 1 (0.3%) |
| $50,000 to $99,999 | 24 (22.0%) | 7 (1.7%) |
| $100,000 to $299,999 | 63 (57.8%) | 382 (95.0%) |
| $300,000 to $499,999 | 2 (1.8%) | 10 (2.5%) |
| $500,000 to $749,999 | 0 (0.0%) | 0 (0.0%) |
| $750,000 to $999,999 | 0 (0.0%) | 2 (0.5%) |
| $1,000,000 or more | 0 (0.0%) | 0 (0.0%) |
| Total | 109 (100.0%) | 402 (100.0%) |
Household Income by Mortgage Status in Richlands
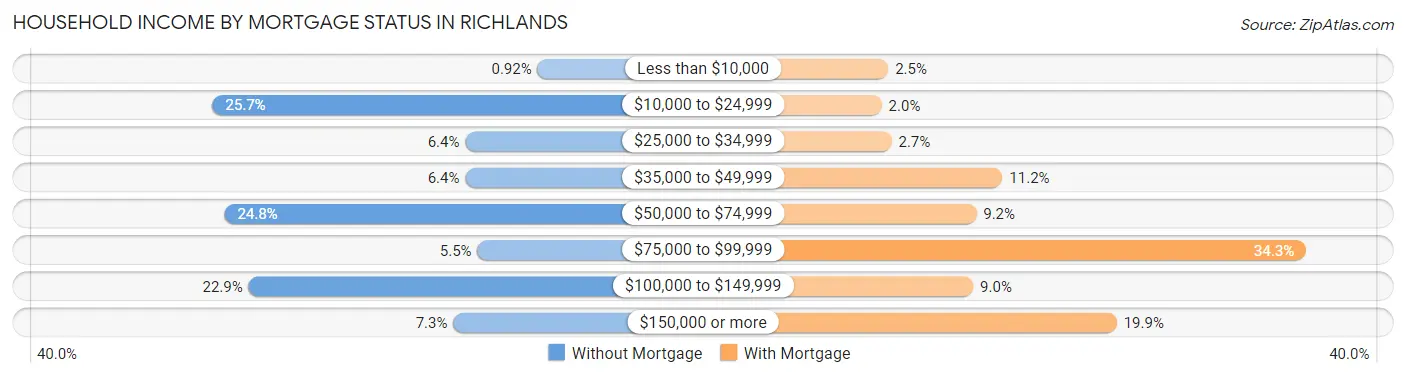
| Household Income | Without Mortgage | With Mortgage |
| Less than $10,000 | 1 (0.9%) | 10 (2.5%) |
| $10,000 to $24,999 | 28 (25.7%) | 8 (2.0%) |
| $25,000 to $34,999 | 7 (6.4%) | 11 (2.7%) |
| $35,000 to $49,999 | 7 (6.4%) | 45 (11.2%) |
| $50,000 to $74,999 | 27 (24.8%) | 37 (9.2%) |
| $75,000 to $99,999 | 6 (5.5%) | 138 (34.3%) |
| $100,000 to $149,999 | 25 (22.9%) | 36 (9.0%) |
| $150,000 or more | 8 (7.3%) | 80 (19.9%) |
| Total | 109 (100.0%) | 402 (100.0%) |
Property Value to Household Income Ratio in Richlands
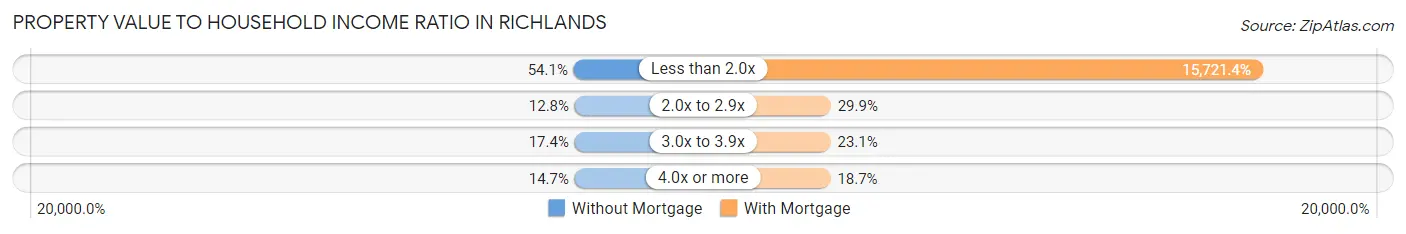
| Value-to-Income Ratio | Without Mortgage | With Mortgage |
| Less than 2.0x | 59 (54.1%) | 63,200 (15,721.4%) |
| 2.0x to 2.9x | 14 (12.8%) | 120 (29.8%) |
| 3.0x to 3.9x | 19 (17.4%) | 93 (23.1%) |
| 4.0x or more | 16 (14.7%) | 75 (18.7%) |
| Total | 109 (100.0%) | 402 (100.0%) |
Real Estate Taxes by Mortgage Status in Richlands
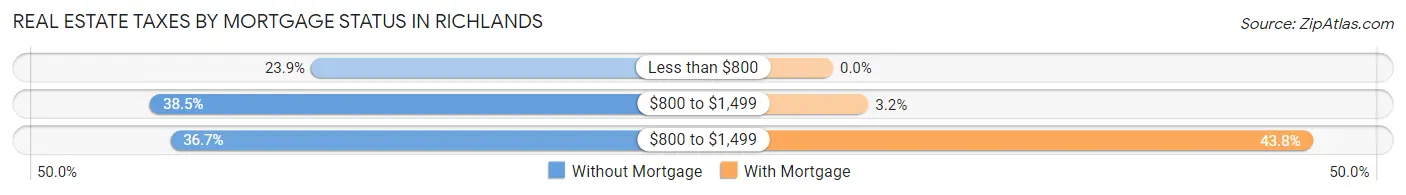
| Property Taxes | Without Mortgage | With Mortgage |
| Less than $800 | 26 (23.8%) | 0 (0.0%) |
| $800 to $1,499 | 42 (38.5%) | 13 (3.2%) |
| $800 to $1,499 | 40 (36.7%) | 176 (43.8%) |
| Total | 109 (100.0%) | 402 (100.0%) |
Health & Disability in Richlands
Health Insurance Coverage by Age in Richlands
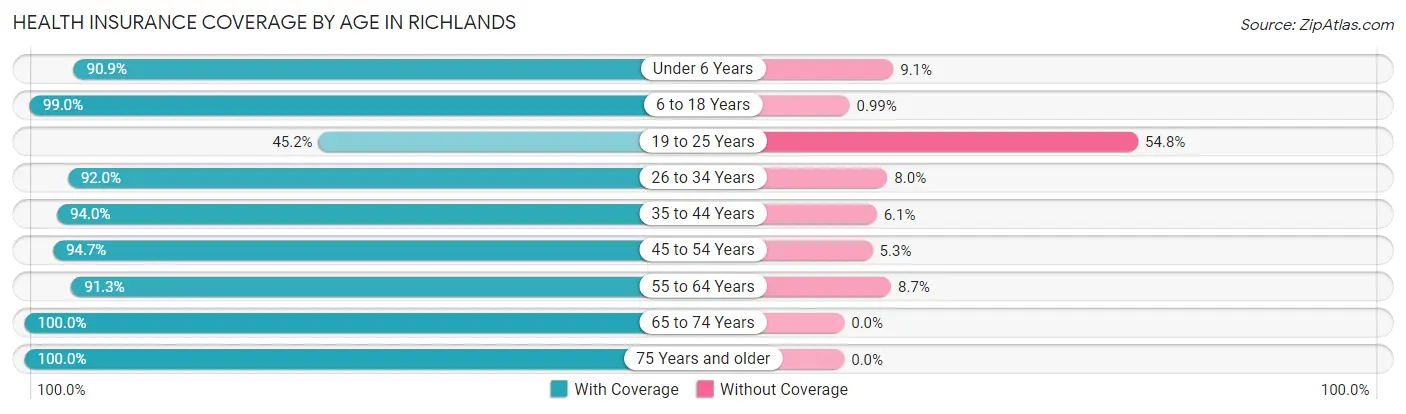
| Age Bracket | With Coverage | Without Coverage |
| Under 6 Years | 169 (90.9%) | 17 (9.1%) |
| 6 to 18 Years | 701 (99.0%) | 7 (1.0%) |
| 19 to 25 Years | 127 (45.2%) | 154 (54.8%) |
| 26 to 34 Years | 206 (92.0%) | 18 (8.0%) |
| 35 to 44 Years | 481 (94.0%) | 31 (6.0%) |
| 45 to 54 Years | 215 (94.7%) | 12 (5.3%) |
| 55 to 64 Years | 136 (91.3%) | 13 (8.7%) |
| 65 to 74 Years | 129 (100.0%) | 0 (0.0%) |
| 75 Years and older | 52 (100.0%) | 0 (0.0%) |
| Total | 2,216 (89.8%) | 252 (10.2%) |
Health Insurance Coverage by Citizenship Status in Richlands
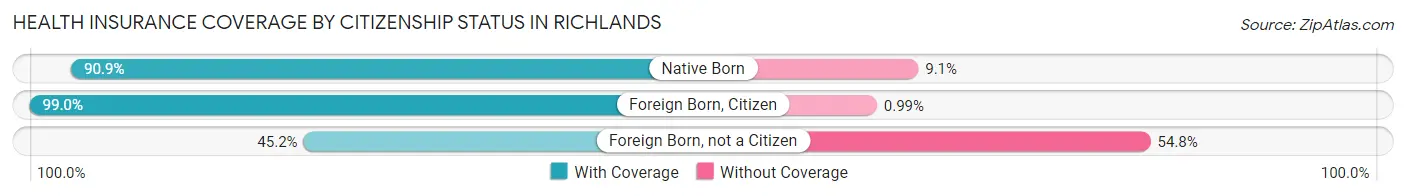
| Citizenship Status | With Coverage | Without Coverage |
| Native Born | 169 (90.9%) | 17 (9.1%) |
| Foreign Born, Citizen | 701 (99.0%) | 7 (1.0%) |
| Foreign Born, not a Citizen | 127 (45.2%) | 154 (54.8%) |
Health Insurance Coverage by Household Income in Richlands
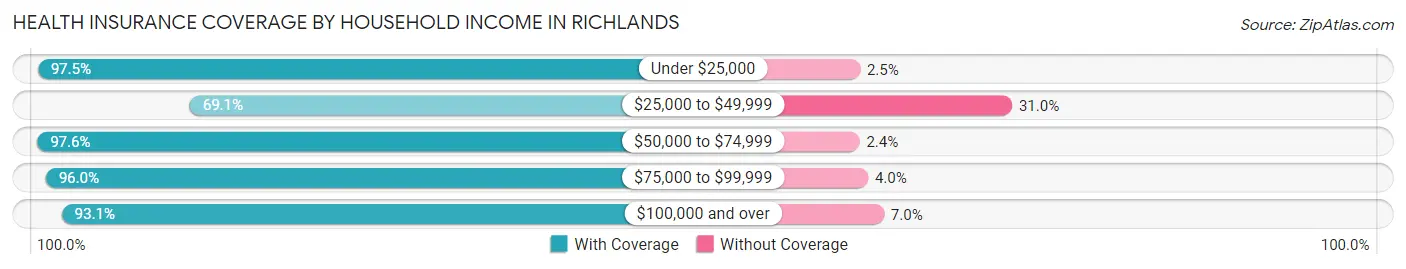
| Household Income | With Coverage | Without Coverage |
| Under $25,000 | 237 (97.5%) | 6 (2.5%) |
| $25,000 to $49,999 | 348 (69.1%) | 156 (30.9%) |
| $50,000 to $74,999 | 536 (97.6%) | 13 (2.4%) |
| $75,000 to $99,999 | 145 (96.0%) | 6 (4.0%) |
| $100,000 and over | 950 (93.0%) | 71 (7.0%) |
Public vs Private Health Insurance Coverage by Age in Richlands
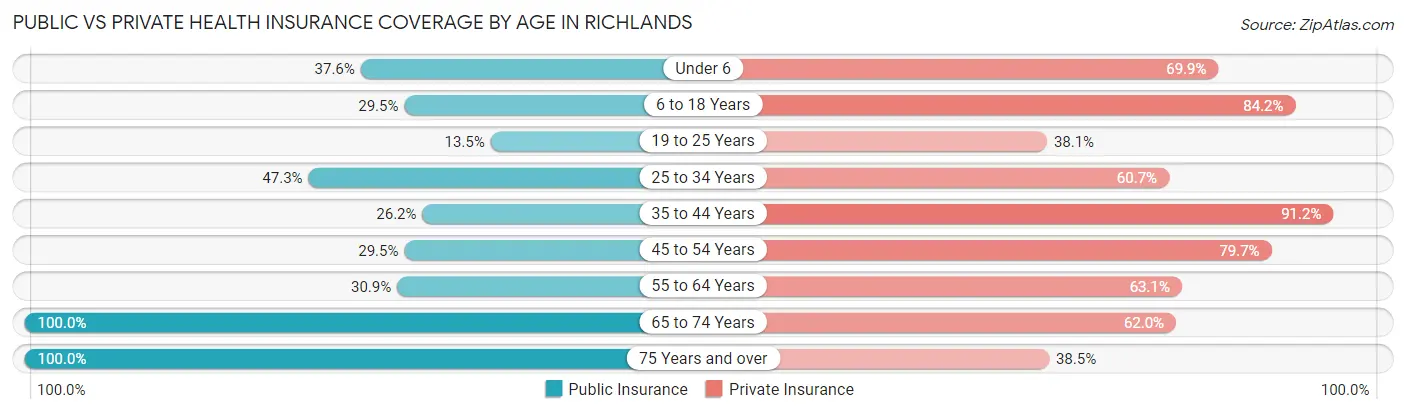
| Age Bracket | Public Insurance | Private Insurance |
| Under 6 | 70 (37.6%) | 130 (69.9%) |
| 6 to 18 Years | 209 (29.5%) | 596 (84.2%) |
| 19 to 25 Years | 38 (13.5%) | 107 (38.1%) |
| 25 to 34 Years | 106 (47.3%) | 136 (60.7%) |
| 35 to 44 Years | 134 (26.2%) | 467 (91.2%) |
| 45 to 54 Years | 67 (29.5%) | 181 (79.7%) |
| 55 to 64 Years | 46 (30.9%) | 94 (63.1%) |
| 65 to 74 Years | 129 (100.0%) | 80 (62.0%) |
| 75 Years and over | 52 (100.0%) | 20 (38.5%) |
| Total | 851 (34.5%) | 1,811 (73.4%) |
Disability Status by Sex by Age in Richlands
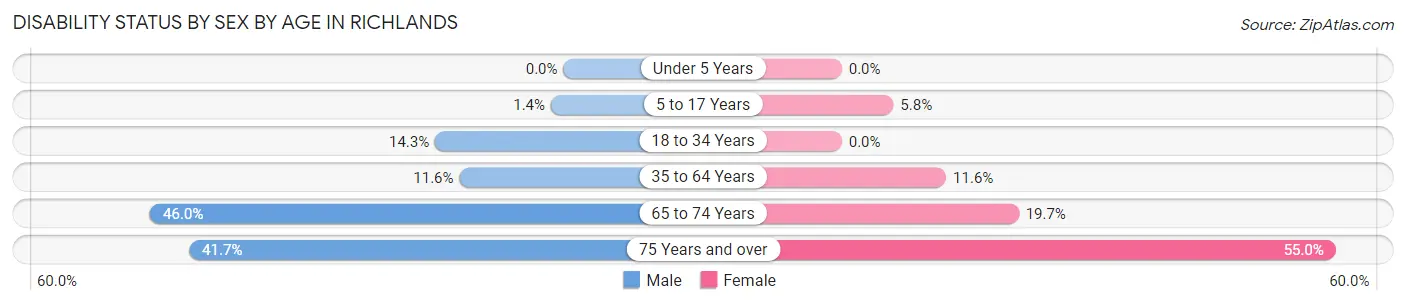
| Age Bracket | Male | Female |
| Under 5 Years | 0 (0.0%) | 0 (0.0%) |
| 5 to 17 Years | 5 (1.4%) | 20 (5.8%) |
| 18 to 34 Years | 42 (14.3%) | 0 (0.0%) |
| 35 to 64 Years | 55 (11.6%) | 48 (11.6%) |
| 65 to 74 Years | 29 (46.0%) | 13 (19.7%) |
| 75 Years and over | 5 (41.7%) | 22 (55.0%) |
Disability Class by Sex by Age in Richlands
Disability Class: Hearing Difficulty
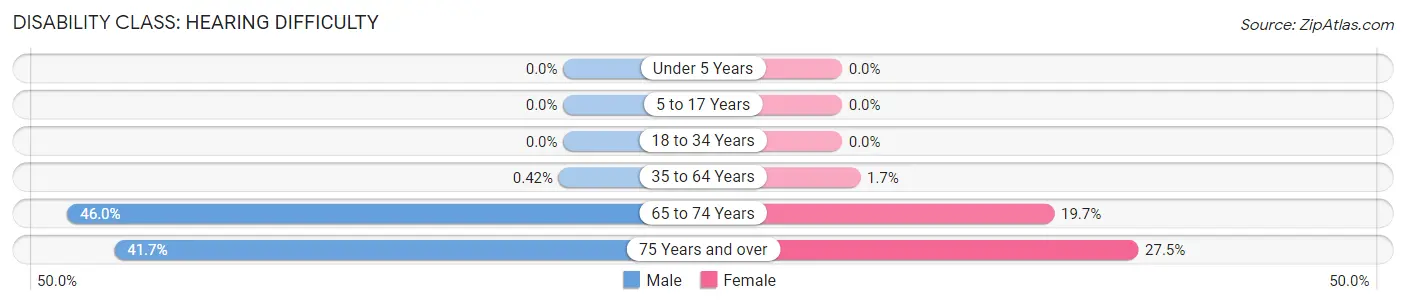
| Age Bracket | Male | Female |
| Under 5 Years | 0 (0.0%) | 0 (0.0%) |
| 5 to 17 Years | 0 (0.0%) | 0 (0.0%) |
| 18 to 34 Years | 0 (0.0%) | 0 (0.0%) |
| 35 to 64 Years | 2 (0.4%) | 7 (1.7%) |
| 65 to 74 Years | 29 (46.0%) | 13 (19.7%) |
| 75 Years and over | 5 (41.7%) | 11 (27.5%) |
Disability Class: Vision Difficulty
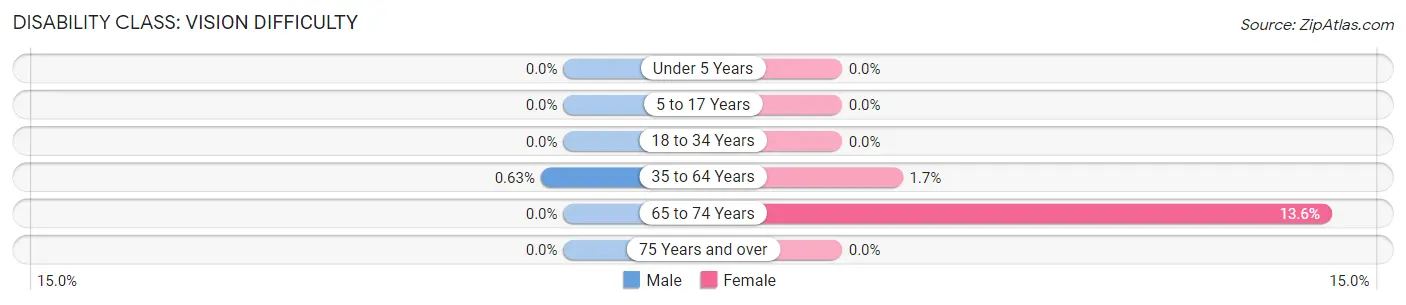
| Age Bracket | Male | Female |
| Under 5 Years | 0 (0.0%) | 0 (0.0%) |
| 5 to 17 Years | 0 (0.0%) | 0 (0.0%) |
| 18 to 34 Years | 0 (0.0%) | 0 (0.0%) |
| 35 to 64 Years | 3 (0.6%) | 7 (1.7%) |
| 65 to 74 Years | 0 (0.0%) | 9 (13.6%) |
| 75 Years and over | 0 (0.0%) | 0 (0.0%) |
Disability Class: Cognitive Difficulty
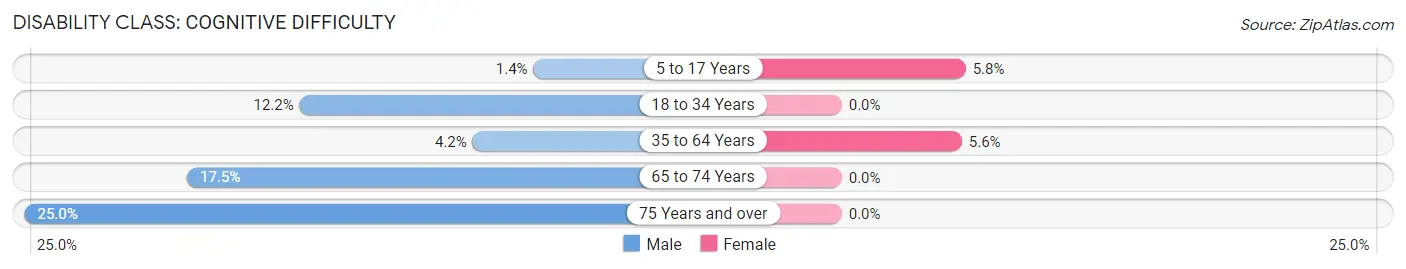
| Age Bracket | Male | Female |
| 5 to 17 Years | 5 (1.4%) | 20 (5.8%) |
| 18 to 34 Years | 36 (12.2%) | 0 (0.0%) |
| 35 to 64 Years | 20 (4.2%) | 23 (5.6%) |
| 65 to 74 Years | 11 (17.5%) | 0 (0.0%) |
| 75 Years and over | 3 (25.0%) | 0 (0.0%) |
Disability Class: Ambulatory Difficulty
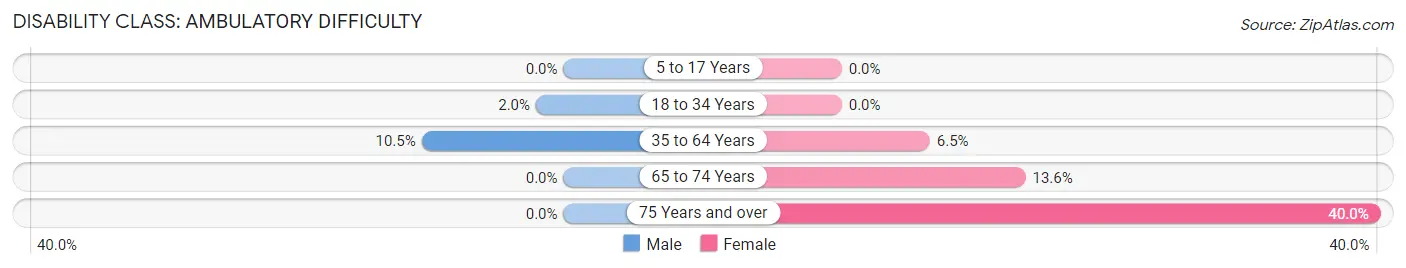
| Age Bracket | Male | Female |
| 5 to 17 Years | 0 (0.0%) | 0 (0.0%) |
| 18 to 34 Years | 6 (2.0%) | 0 (0.0%) |
| 35 to 64 Years | 50 (10.5%) | 27 (6.5%) |
| 65 to 74 Years | 0 (0.0%) | 9 (13.6%) |
| 75 Years and over | 0 (0.0%) | 16 (40.0%) |
Disability Class: Self-Care Difficulty
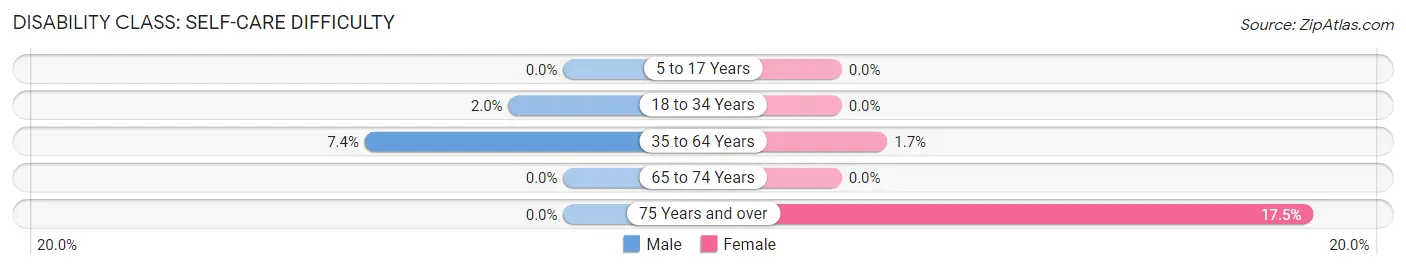
| Age Bracket | Male | Female |
| 5 to 17 Years | 0 (0.0%) | 0 (0.0%) |
| 18 to 34 Years | 6 (2.0%) | 0 (0.0%) |
| 35 to 64 Years | 35 (7.4%) | 7 (1.7%) |
| 65 to 74 Years | 0 (0.0%) | 0 (0.0%) |
| 75 Years and over | 0 (0.0%) | 7 (17.5%) |
Technology Access in Richlands
Computing Device Access in Richlands
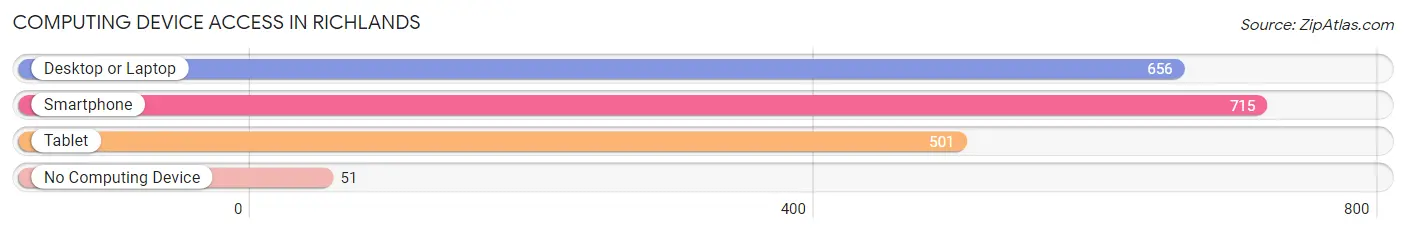
| Device Type | # Households | % Households |
| Desktop or Laptop | 656 | 83.7% |
| Smartphone | 715 | 91.2% |
| Tablet | 501 | 63.9% |
| No Computing Device | 51 | 6.5% |
| Total | 784 | 100.0% |
Internet Access in Richlands
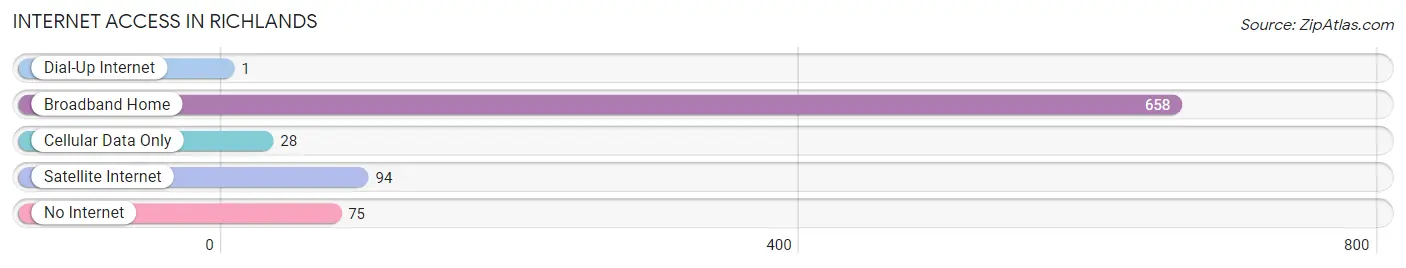
| Internet Type | # Households | % Households |
| Dial-Up Internet | 1 | 0.1% |
| Broadband Home | 658 | 83.9% |
| Cellular Data Only | 28 | 3.6% |
| Satellite Internet | 94 | 12.0% |
| No Internet | 75 | 9.6% |
| Total | 784 | 100.0% |
Richlands Summary
Richlands, NC is a small town located in Onslow County, North Carolina. It is situated on the banks of the New River, approximately 20 miles from the Atlantic Ocean. The town has a population of approximately 2,500 people and is part of the Jacksonville, NC Metropolitan Statistical Area.
History
Richlands was first settled in the late 1700s by a group of settlers from Scotland. The town was originally known as “Richland” and was incorporated in 1883. The town was named after the rich soil in the area, which was ideal for farming. The town was a major agricultural center in the late 19th and early 20th centuries, with tobacco, cotton, and corn being the main crops.
In the early 20th century, Richlands began to experience a period of growth and development. The town was connected to the railroad in 1912, which allowed for the transportation of goods and people. The town also experienced a population boom, with the population increasing from 1,000 in 1910 to 2,500 in 1930.
Geography
Richlands is located in Onslow County, North Carolina. It is situated on the banks of the New River, approximately 20 miles from the Atlantic Ocean. The town is located in the Coastal Plain region of North Carolina, which is characterized by flat terrain and sandy soils. The town is located in a humid subtropical climate zone, with hot, humid summers and mild winters.
Economy
Richlands’ economy is largely based on agriculture and manufacturing. The town is home to several large farms, which produce a variety of crops, including tobacco, cotton, corn, soybeans, and wheat. The town is also home to several manufacturing companies, which produce a variety of products, including furniture, textiles, and electronics.
Demographics
As of the 2010 census, Richlands had a population of 2,500 people. The racial makeup of the town was 79.2% White, 15.2% African American, 0.8% Native American, 0.4% Asian, and 4.4% from other races. The median household income was $35,000, and the median family income was $41,000. The town had a poverty rate of 17.2%.
Conclusion
Richlands, NC is a small town located in Onslow County, North Carolina. It is situated on the banks of the New River, approximately 20 miles from the Atlantic Ocean. The town has a population of approximately 2,500 people and is part of the Jacksonville, NC Metropolitan Statistical Area. Richlands’ economy is largely based on agriculture and manufacturing, and the town is home to several large farms and manufacturing companies. The town has a diverse population, with a median household income of $35,000 and a poverty rate of 17.2%. Richlands is a small town with a rich history and a bright future.
Common Questions
What is Per Capita Income in Richlands?
Per Capita income in Richlands is $24,407.
What is the Median Family Income in Richlands?
Median Family Income in Richlands is $68,611.
What is the Median Household income in Richlands?
Median Household Income in Richlands is $59,333.
What is Income or Wage Gap in Richlands?
Income or Wage Gap in Richlands is 41.2%.
Women in Richlands earn 58.8 cents for every dollar earned by a man.
What is Inequality or Gini Index in Richlands?
Inequality or Gini Index in Richlands is 0.41.
What is the Total Population of Richlands?
Total Population of Richlands is 2,577.
What is the Total Male Population of Richlands?
Total Male Population of Richlands is 1,408.
What is the Total Female Population of Richlands?
Total Female Population of Richlands is 1,169.
What is the Ratio of Males per 100 Females in Richlands?
There are 120.44 Males per 100 Females in Richlands.
What is the Ratio of Females per 100 Males in Richlands?
There are 83.03 Females per 100 Males in Richlands.
What is the Median Population Age in Richlands?
Median Population Age in Richlands is 28.9 Years.
What is the Average Family Size in Richlands
Average Family Size in Richlands is 4.2 People.
What is the Average Household Size in Richlands
Average Household Size in Richlands is 3.3 People.
How Large is the Labor Force in Richlands?
There are 1,178 People in the Labor Forcein in Richlands.
What is the Percentage of People in the Labor Force in Richlands?
65.0% of People are in the Labor Force in Richlands.
What is the Unemployment Rate in Richlands?
Unemployment Rate in Richlands is 13.6%.