Wanchese, NC Map & Demographics
Wanchese Map
Wanchese Overview
$34,049
PER CAPITA INCOME
$78,661
AVG FAMILY INCOME
$71,484
AVG HOUSEHOLD INCOME
19.8%
WAGE / INCOME GAP [ % ]
80.2¢/ $1
WAGE / INCOME GAP [ $ ]
$4,743
FAMILY INCOME DEFICIT
0.41
INEQUALITY / GINI INDEX
2,005
TOTAL POPULATION
989
MALE POPULATION
1,016
FEMALE POPULATION
97.34
MALES / 100 FEMALES
102.73
FEMALES / 100 MALES
37.6
MEDIAN AGE
3.1
AVG FAMILY SIZE
2.8
AVG HOUSEHOLD SIZE
1,097
LABOR FORCE [ PEOPLE ]
75.2%
PERCENT IN LABOR FORCE
0.8%
UNEMPLOYMENT RATE
Wanchese Zip Codes
Wanchese Area Codes
Income in Wanchese
Income Overview in Wanchese
Per Capita Income in Wanchese is $34,049, while median incomes of families and households are $78,661 and $71,484 respectively.
| Characteristic | Number | Measure |
| Per Capita Income | 2,005 | $34,049 |
| Median Family Income | 553 | $78,661 |
| Mean Family Income | 553 | $94,466 |
| Median Household Income | 723 | $71,484 |
| Mean Household Income | 723 | $92,374 |
| Income Deficit | 553 | $4,743 |
| Wage / Income Gap (%) | 2,005 | 19.84% |
| Wage / Income Gap ($) | 2,005 | 80.16¢ per $1 |
| Gini / Inequality Index | 2,005 | 0.41 |
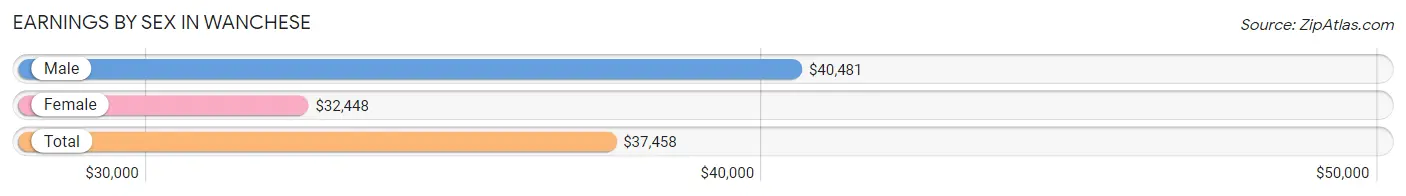
Earnings by Sex in Wanchese
Average Earnings in Wanchese are $37,458, $40,481 for men and $32,448 for women, a difference of 19.8%.
| Sex | Number | Average Earnings |
| Male | 556 (49.5%) | $40,481 |
| Female | 568 (50.5%) | $32,448 |
| Total | 1,124 (100.0%) | $37,458 |
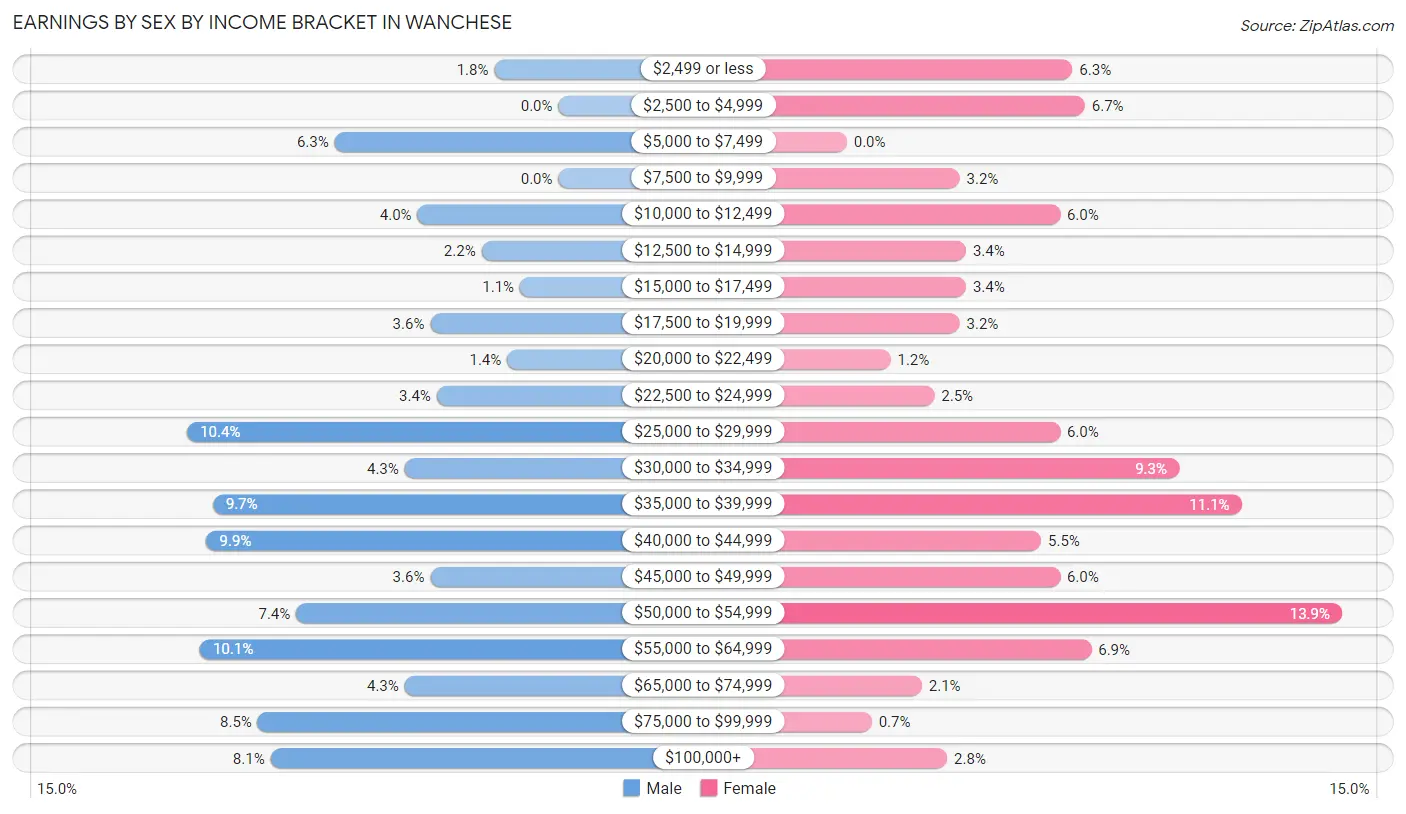
Earnings by Sex by Income Bracket in Wanchese
The most common earnings brackets in Wanchese are $25,000 to $29,999 for men (58 | 10.4%) and $50,000 to $54,999 for women (79 | 13.9%).
| Income | Male | Female |
| $2,499 or less | 10 (1.8%) | 36 (6.3%) |
| $2,500 to $4,999 | 0 (0.0%) | 38 (6.7%) |
| $5,000 to $7,499 | 35 (6.3%) | 0 (0.0%) |
| $7,500 to $9,999 | 0 (0.0%) | 18 (3.2%) |
| $10,000 to $12,499 | 22 (4.0%) | 34 (6.0%) |
| $12,500 to $14,999 | 12 (2.2%) | 19 (3.4%) |
| $15,000 to $17,499 | 6 (1.1%) | 19 (3.4%) |
| $17,500 to $19,999 | 20 (3.6%) | 18 (3.2%) |
| $20,000 to $22,499 | 8 (1.4%) | 7 (1.2%) |
| $22,500 to $24,999 | 19 (3.4%) | 14 (2.5%) |
| $25,000 to $29,999 | 58 (10.4%) | 34 (6.0%) |
| $30,000 to $34,999 | 24 (4.3%) | 53 (9.3%) |
| $35,000 to $39,999 | 54 (9.7%) | 63 (11.1%) |
| $40,000 to $44,999 | 55 (9.9%) | 31 (5.5%) |
| $45,000 to $49,999 | 20 (3.6%) | 34 (6.0%) |
| $50,000 to $54,999 | 41 (7.4%) | 79 (13.9%) |
| $55,000 to $64,999 | 56 (10.1%) | 39 (6.9%) |
| $65,000 to $74,999 | 24 (4.3%) | 12 (2.1%) |
| $75,000 to $99,999 | 47 (8.5%) | 4 (0.7%) |
| $100,000+ | 45 (8.1%) | 16 (2.8%) |
| Total | 556 (100.0%) | 568 (100.0%) |
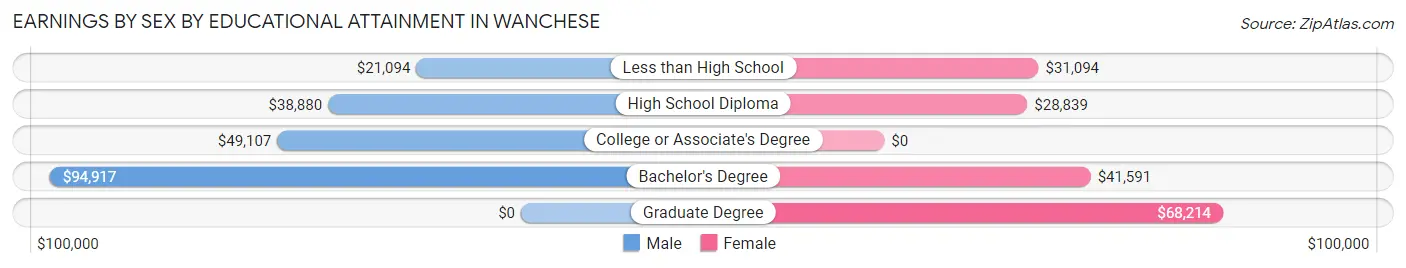
Earnings by Sex by Educational Attainment in Wanchese
Average earnings in Wanchese are $40,865 for men and $35,826 for women, a difference of 12.3%. Men with an educational attainment of bachelor's degree enjoy the highest average annual earnings of $94,917, while those with less than high school education earn the least with $21,094. Women with an educational attainment of graduate degree earn the most with the average annual earnings of $68,214, while those with high school diploma education have the smallest earnings of $28,839.
| Educational Attainment | Male Income | Female Income |
| Less than High School | $21,094 | $31,094 |
| High School Diploma | $38,880 | $28,839 |
| College or Associate's Degree | $49,107 | $0 |
| Bachelor's Degree | $94,917 | $41,591 |
| Graduate Degree | - | - |
| Total | $40,865 | $35,826 |
Family Income in Wanchese
Family Income Brackets in Wanchese
According to the Wanchese family income data, there are 121 families falling into the $100,000 to $149,999 income range, which is the most common income bracket and makes up 21.9% of all families.
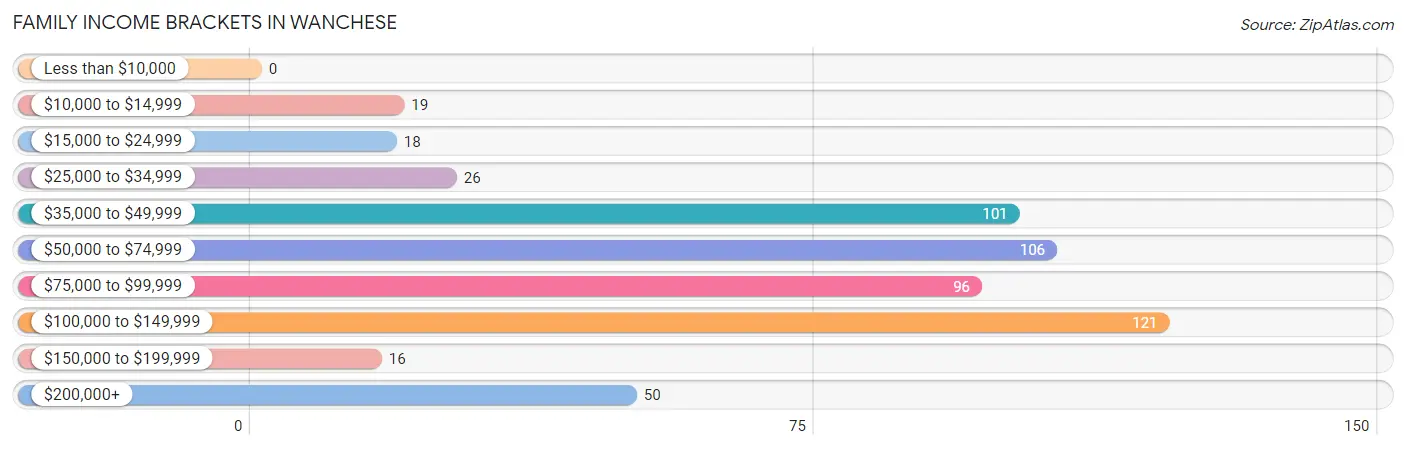
| Income Bracket | # Families | % Families |
| Less than $10,000 | 0 | 0.0% |
| $10,000 to $14,999 | 19 | 3.4% |
| $15,000 to $24,999 | 18 | 3.3% |
| $25,000 to $34,999 | 26 | 4.7% |
| $35,000 to $49,999 | 101 | 18.3% |
| $50,000 to $74,999 | 106 | 19.2% |
| $75,000 to $99,999 | 96 | 17.4% |
| $100,000 to $149,999 | 121 | 21.9% |
| $150,000 to $199,999 | 16 | 2.9% |
| $200,000+ | 50 | 9.0% |
Family Income by Famaliy Size in Wanchese
3-person families (140 | 25.3%) account for the highest median family income in Wanchese with $96,458 per family, while 2-person families (287 | 51.9%) have the highest median income of $33,125 per family member.
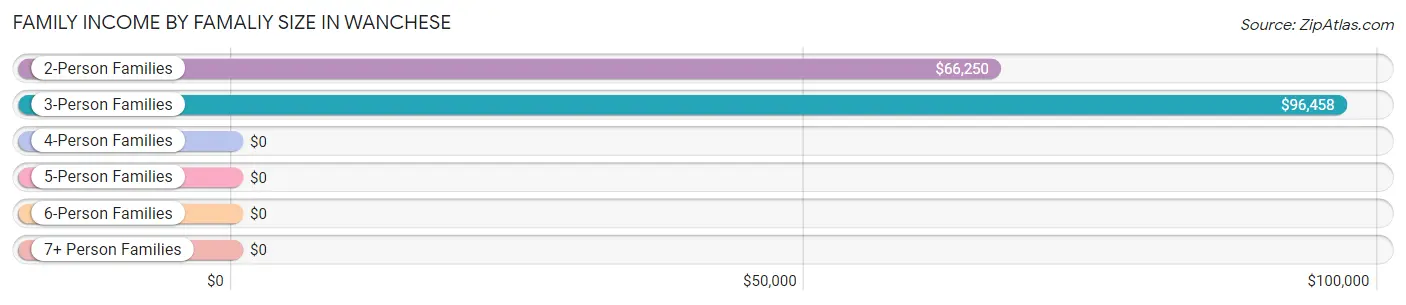
| Income Bracket | # Families | Median Income |
| 2-Person Families | 287 (51.9%) | $66,250 |
| 3-Person Families | 140 (25.3%) | $96,458 |
| 4-Person Families | 110 (19.9%) | $0 |
| 5-Person Families | 4 (0.7%) | $0 |
| 6-Person Families | 5 (0.9%) | $0 |
| 7+ Person Families | 7 (1.3%) | $0 |
| Total | 553 (100.0%) | $78,661 |
Family Income by Number of Earners in Wanchese
The median family income in Wanchese is $78,661, with families comprising 3+ earners (32) having the highest median family income of $125,455, while families with 1 earner (214) have the lowest median family income of $37,217, accounting for 5.8% and 38.7% of families, respectively.
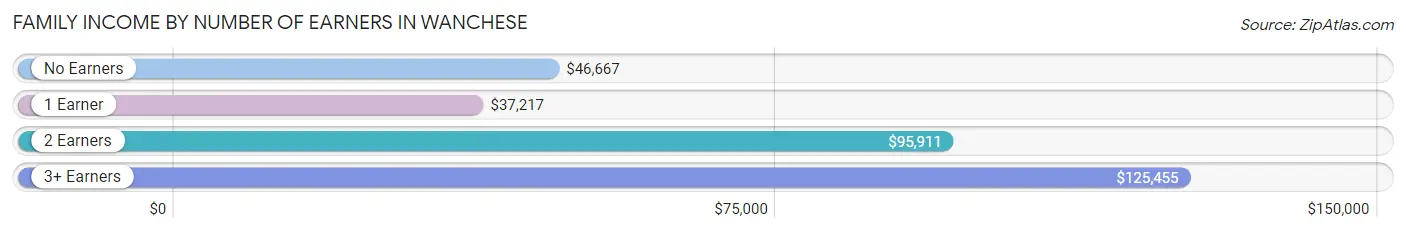
| Number of Earners | # Families | Median Income |
| No Earners | 34 (6.1%) | $46,667 |
| 1 Earner | 214 (38.7%) | $37,217 |
| 2 Earners | 273 (49.4%) | $95,911 |
| 3+ Earners | 32 (5.8%) | $125,455 |
| Total | 553 (100.0%) | $78,661 |
Household Income in Wanchese
Household Income Brackets in Wanchese
With 149 households falling in the category, the $75,000 to $99,999 income range is the most frequent in Wanchese, accounting for 20.6% of all households.
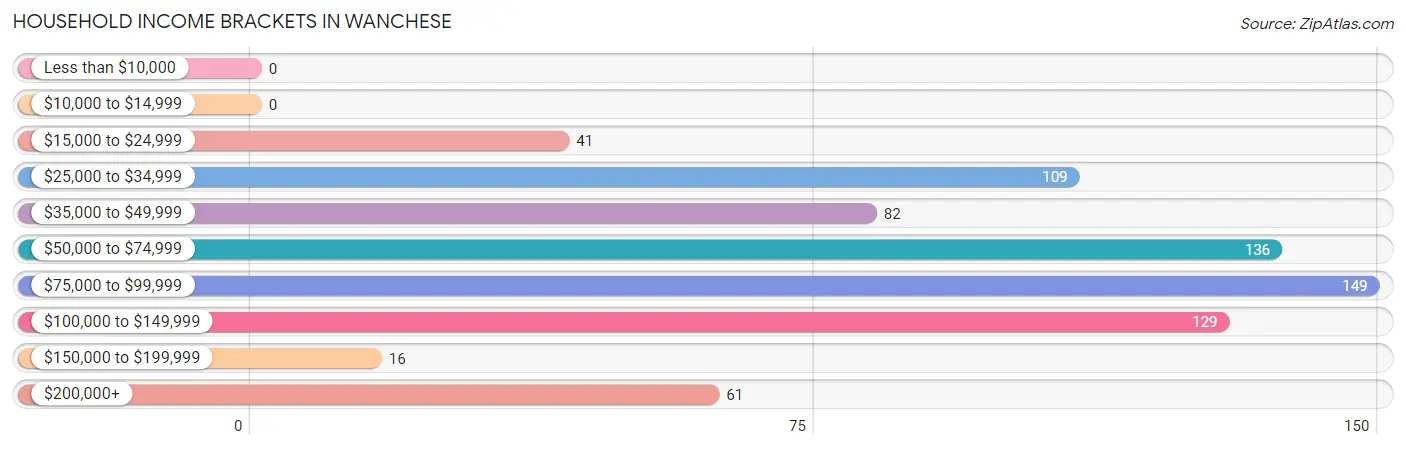
| Income Bracket | # Households | % Households |
| Less than $10,000 | 0 | 0.0% |
| $10,000 to $14,999 | 0 | 0.0% |
| $15,000 to $24,999 | 41 | 5.7% |
| $25,000 to $34,999 | 109 | 15.1% |
| $35,000 to $49,999 | 82 | 11.3% |
| $50,000 to $74,999 | 136 | 18.8% |
| $75,000 to $99,999 | 149 | 20.6% |
| $100,000 to $149,999 | 129 | 17.8% |
| $150,000 to $199,999 | 16 | 2.2% |
| $200,000+ | 61 | 8.4% |
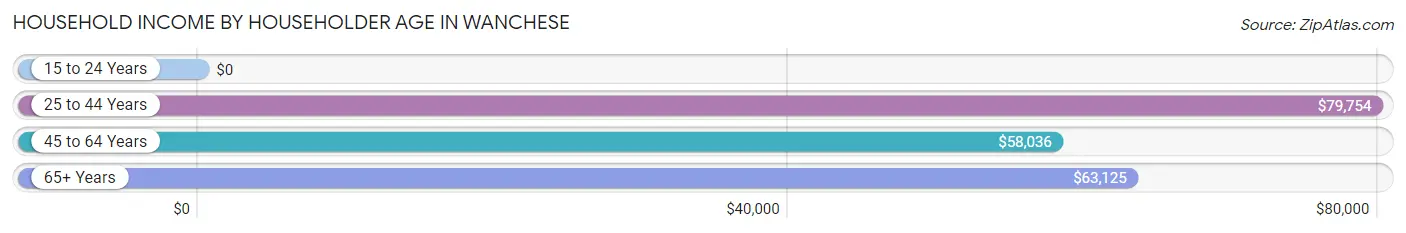
Household Income by Householder Age in Wanchese
The median household income in Wanchese is $71,484, with the highest median household income of $79,754 found in the 25 to 44 years age bracket for the primary householder. A total of 236 households (32.6%) fall into this category. Meanwhile, the 15 to 24 years age bracket for the primary householder has the lowest median household income of $0, with 3 households (0.4%) in this group.
| Income Bracket | # Households | Median Income |
| 15 to 24 Years | 3 (0.4%) | $0 |
| 25 to 44 Years | 236 (32.6%) | $79,754 |
| 45 to 64 Years | 253 (35.0%) | $58,036 |
| 65+ Years | 231 (32.0%) | $63,125 |
| Total | 723 (100.0%) | $71,484 |
Poverty in Wanchese
Income Below Poverty by Sex and Age in Wanchese
With 4.5% poverty level for males and 5.1% for females among the residents of Wanchese, 25 to 34 year old males and 18 to 24 year old females are the most vulnerable to poverty, with 20 males (16.7%) and 12 females (20.3%) in their respective age groups living below the poverty level.
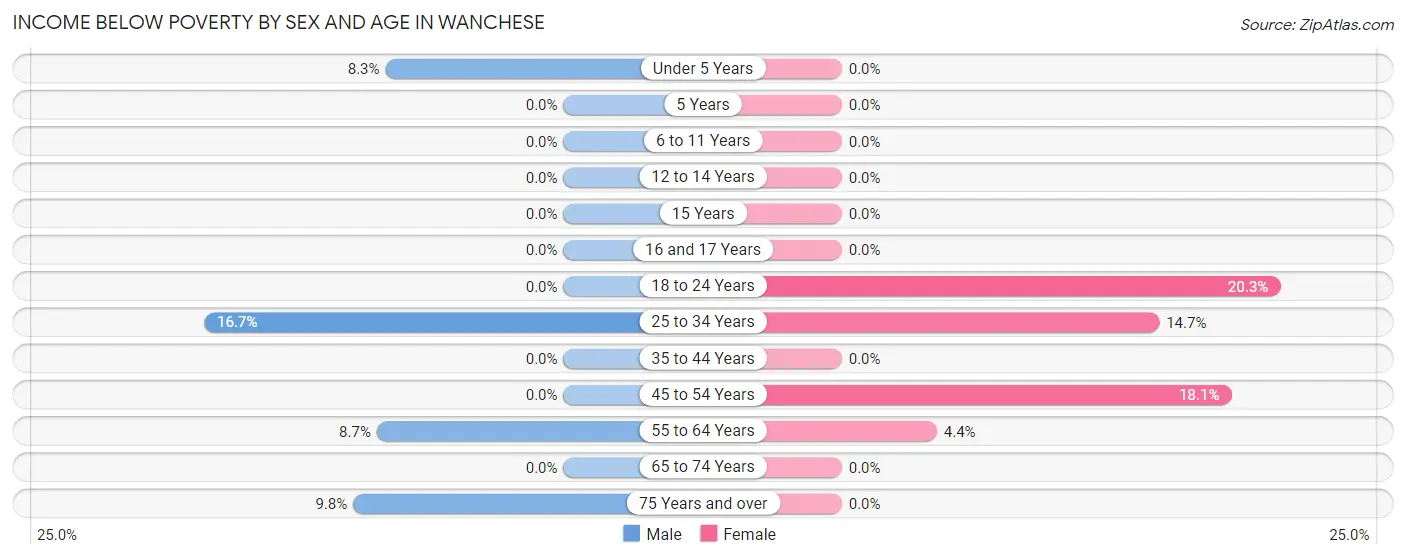
| Age Bracket | Male | Female |
| Under 5 Years | 9 (8.3%) | 0 (0.0%) |
| 5 Years | 0 (0.0%) | 0 (0.0%) |
| 6 to 11 Years | 0 (0.0%) | 0 (0.0%) |
| 12 to 14 Years | 0 (0.0%) | 0 (0.0%) |
| 15 Years | 0 (0.0%) | 0 (0.0%) |
| 16 and 17 Years | 0 (0.0%) | 0 (0.0%) |
| 18 to 24 Years | 0 (0.0%) | 12 (20.3%) |
| 25 to 34 Years | 20 (16.7%) | 19 (14.7%) |
| 35 to 44 Years | 0 (0.0%) | 0 (0.0%) |
| 45 to 54 Years | 0 (0.0%) | 15 (18.1%) |
| 55 to 64 Years | 11 (8.7%) | 6 (4.4%) |
| 65 to 74 Years | 0 (0.0%) | 0 (0.0%) |
| 75 Years and over | 4 (9.8%) | 0 (0.0%) |
| Total | 44 (4.5%) | 52 (5.1%) |
Income Above Poverty by Sex and Age in Wanchese
According to the poverty statistics in Wanchese, males aged 5 years and females aged under 5 years are the age groups that are most secure financially, with 100.0% of males and 100.0% of females in these age groups living above the poverty line.
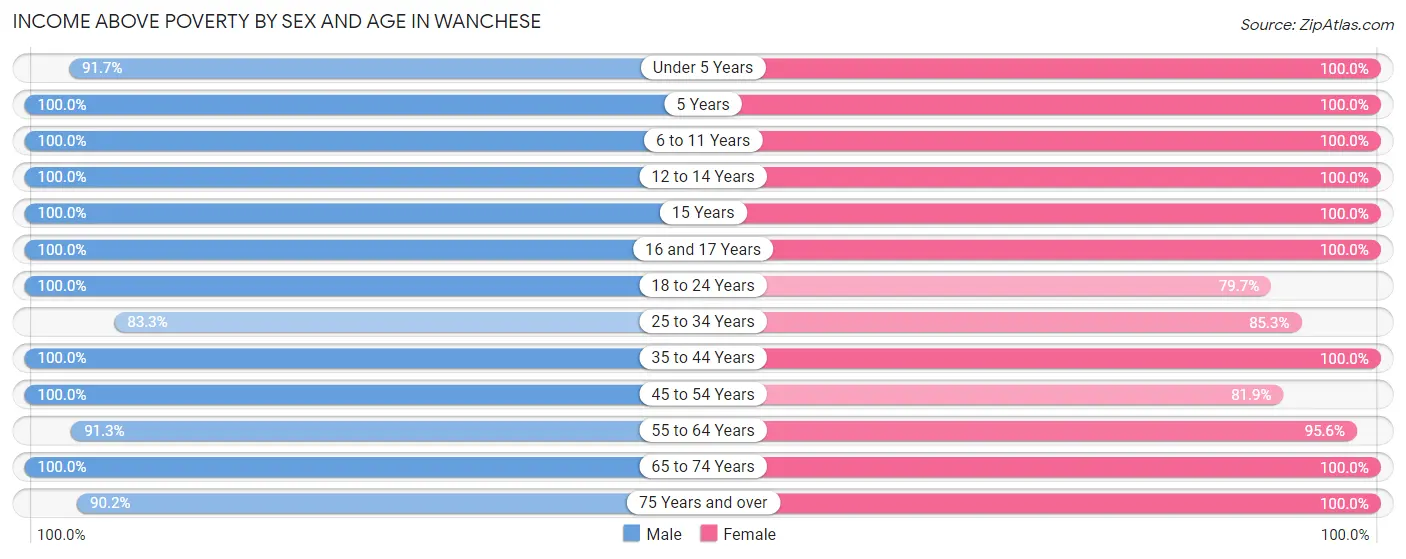
| Age Bracket | Male | Female |
| Under 5 Years | 100 (91.7%) | 21 (100.0%) |
| 5 Years | 95 (100.0%) | 7 (100.0%) |
| 6 to 11 Years | 32 (100.0%) | 32 (100.0%) |
| 12 to 14 Years | 70 (100.0%) | 141 (100.0%) |
| 15 Years | 17 (100.0%) | 12 (100.0%) |
| 16 and 17 Years | 9 (100.0%) | 23 (100.0%) |
| 18 to 24 Years | 13 (100.0%) | 47 (79.7%) |
| 25 to 34 Years | 100 (83.3%) | 110 (85.3%) |
| 35 to 44 Years | 183 (100.0%) | 129 (100.0%) |
| 45 to 54 Years | 107 (100.0%) | 68 (81.9%) |
| 55 to 64 Years | 116 (91.3%) | 130 (95.6%) |
| 65 to 74 Years | 62 (100.0%) | 188 (100.0%) |
| 75 Years and over | 37 (90.2%) | 50 (100.0%) |
| Total | 941 (95.5%) | 958 (94.9%) |
Income Below Poverty Among Married-Couple Families in Wanchese
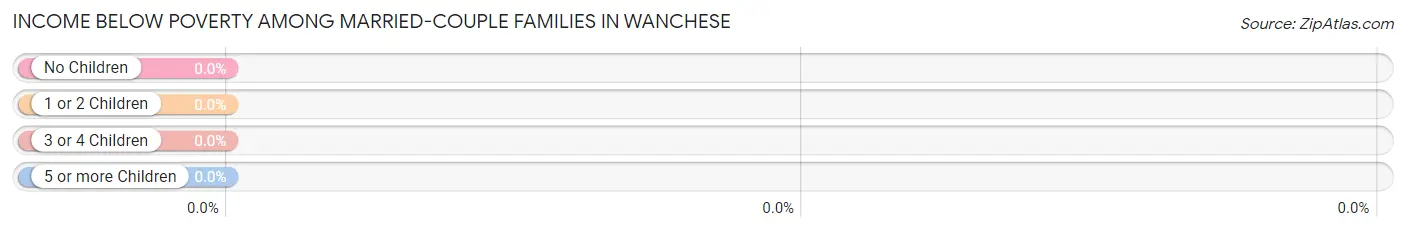
| Children | Above Poverty | Below Poverty |
| No Children | 214 (100.0%) | 0 (0.0%) |
| 1 or 2 Children | 116 (100.0%) | 0 (0.0%) |
| 3 or 4 Children | 0 (0.0%) | 0 (0.0%) |
| 5 or more Children | 7 (100.0%) | 0 (0.0%) |
| Total | 337 (100.0%) | 0 (0.0%) |
Income Below Poverty Among Single-Parent Households in Wanchese
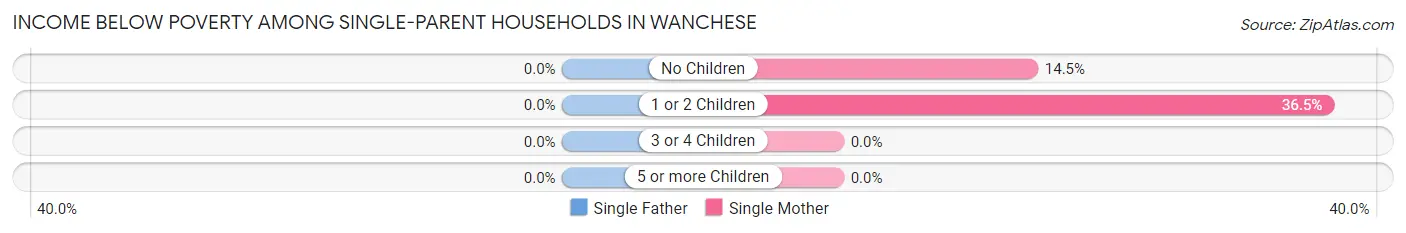
| Children | Single Father | Single Mother |
| No Children | 0 (0.0%) | 11 (14.5%) |
| 1 or 2 Children | 0 (0.0%) | 19 (36.5%) |
| 3 or 4 Children | 0 (0.0%) | 0 (0.0%) |
| 5 or more Children | 0 (0.0%) | 0 (0.0%) |
| Total | 0 (0.0%) | 30 (16.7%) |
Income Below Poverty Among Married-Couple vs Single-Parent Households in Wanchese
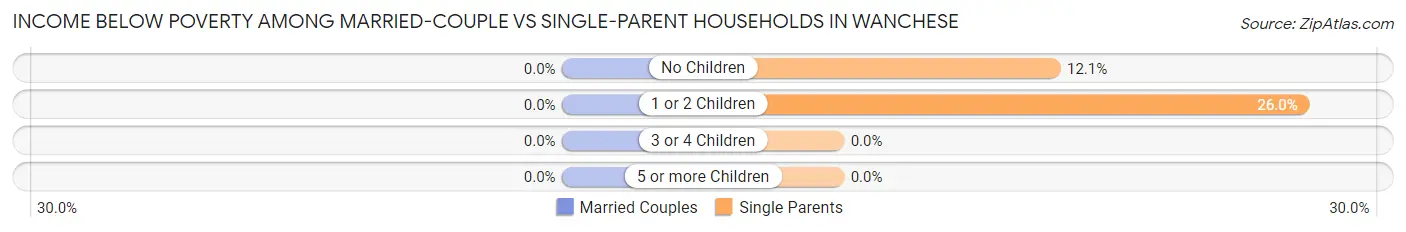
| Children | Married-Couple Families | Single-Parent Households |
| No Children | 0 (0.0%) | 11 (12.1%) |
| 1 or 2 Children | 0 (0.0%) | 19 (26.0%) |
| 3 or 4 Children | 0 (0.0%) | 0 (0.0%) |
| 5 or more Children | 0 (0.0%) | 0 (0.0%) |
| Total | 0 (0.0%) | 30 (13.9%) |
Race in Wanchese
The most populous races in Wanchese are White / Caucasian (1,932 | 96.4%), Hispanic or Latino (104 | 5.2%), and Some other Race (41 | 2.0%).
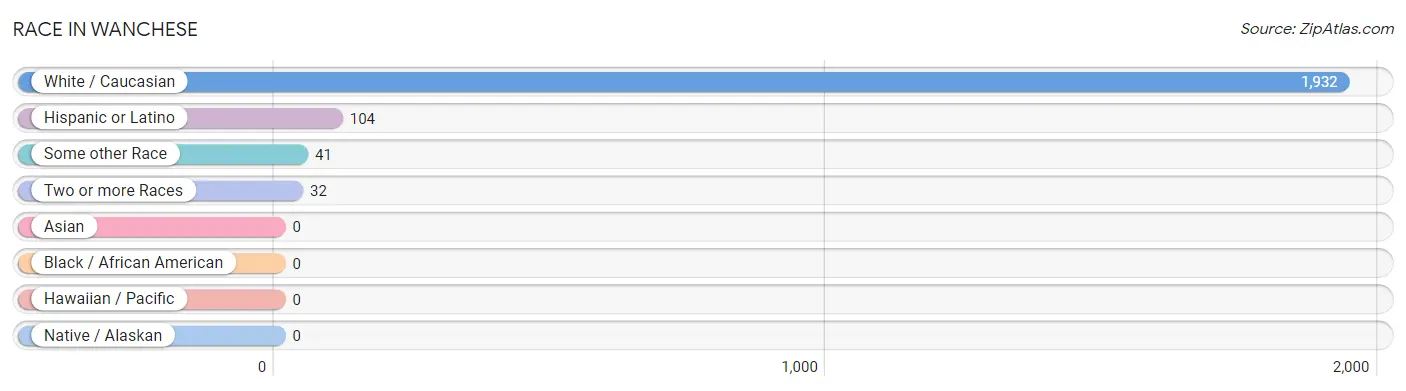
| Race | # Population | % Population |
| Asian | 0 | 0.0% |
| Black / African American | 0 | 0.0% |
| Hawaiian / Pacific | 0 | 0.0% |
| Hispanic or Latino | 104 | 5.2% |
| Native / Alaskan | 0 | 0.0% |
| White / Caucasian | 1,932 | 96.4% |
| Two or more Races | 32 | 1.6% |
| Some other Race | 41 | 2.0% |
| Total | 2,005 | 100.0% |
Ancestry in Wanchese
The most populous ancestries reported in Wanchese are English (546 | 27.2%), American (275 | 13.7%), Irish (210 | 10.5%), Scotch-Irish (162 | 8.1%), and German (63 | 3.1%), together accounting for 62.6% of all Wanchese residents.
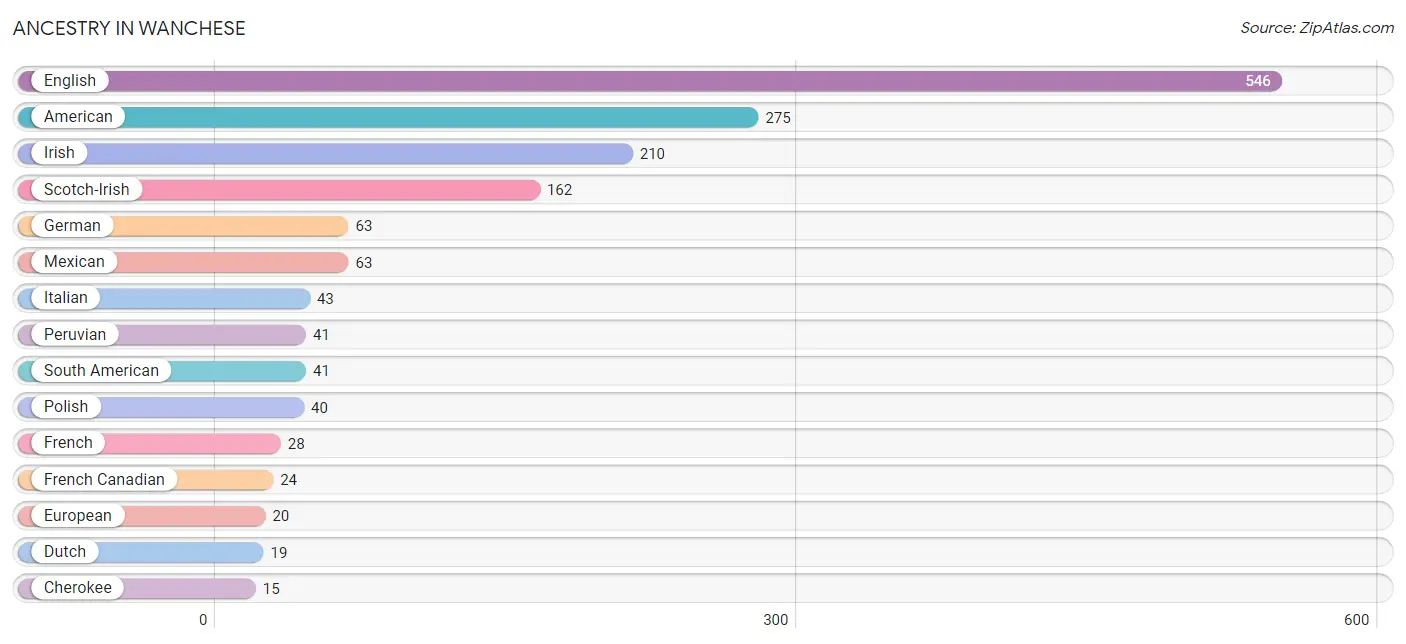
| Ancestry | # Population | % Population |
| American | 275 | 13.7% |
| British | 5 | 0.3% |
| Canadian | 7 | 0.4% |
| Cherokee | 15 | 0.7% |
| Dutch | 19 | 0.9% |
| English | 546 | 27.2% |
| European | 20 | 1.0% |
| French | 28 | 1.4% |
| French Canadian | 24 | 1.2% |
| German | 63 | 3.1% |
| Irish | 210 | 10.5% |
| Italian | 43 | 2.1% |
| Korean | 12 | 0.6% |
| Mexican | 63 | 3.1% |
| Norwegian | 5 | 0.3% |
| Peruvian | 41 | 2.0% |
| Polish | 40 | 2.0% |
| Romanian | 5 | 0.3% |
| Scotch-Irish | 162 | 8.1% |
| South American | 41 | 2.0% |
| Welsh | 5 | 0.3% | View All 21 Rows |
Immigrants in Wanchese
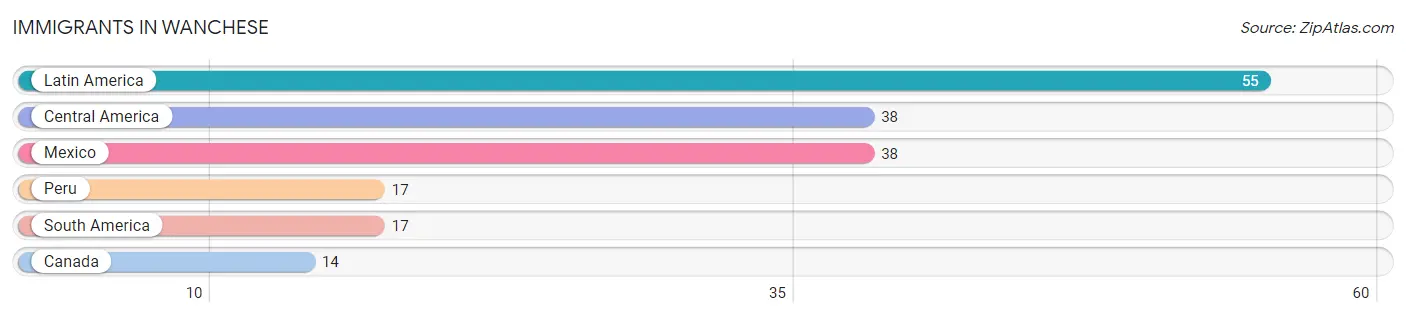
The most numerous immigrant groups reported in Wanchese came from Latin America (55 | 2.7%), Central America (38 | 1.9%), Mexico (38 | 1.9%), Peru (17 | 0.9%), and South America (17 | 0.9%), together accounting for 8.2% of all Wanchese residents.
| Immigration Origin | # Population | % Population |
| Canada | 14 | 0.7% |
| Central America | 38 | 1.9% |
| Latin America | 55 | 2.7% |
| Mexico | 38 | 1.9% |
| Peru | 17 | 0.9% |
| South America | 17 | 0.9% | View All 6 Rows |
Sex and Age in Wanchese
Sex and Age in Wanchese
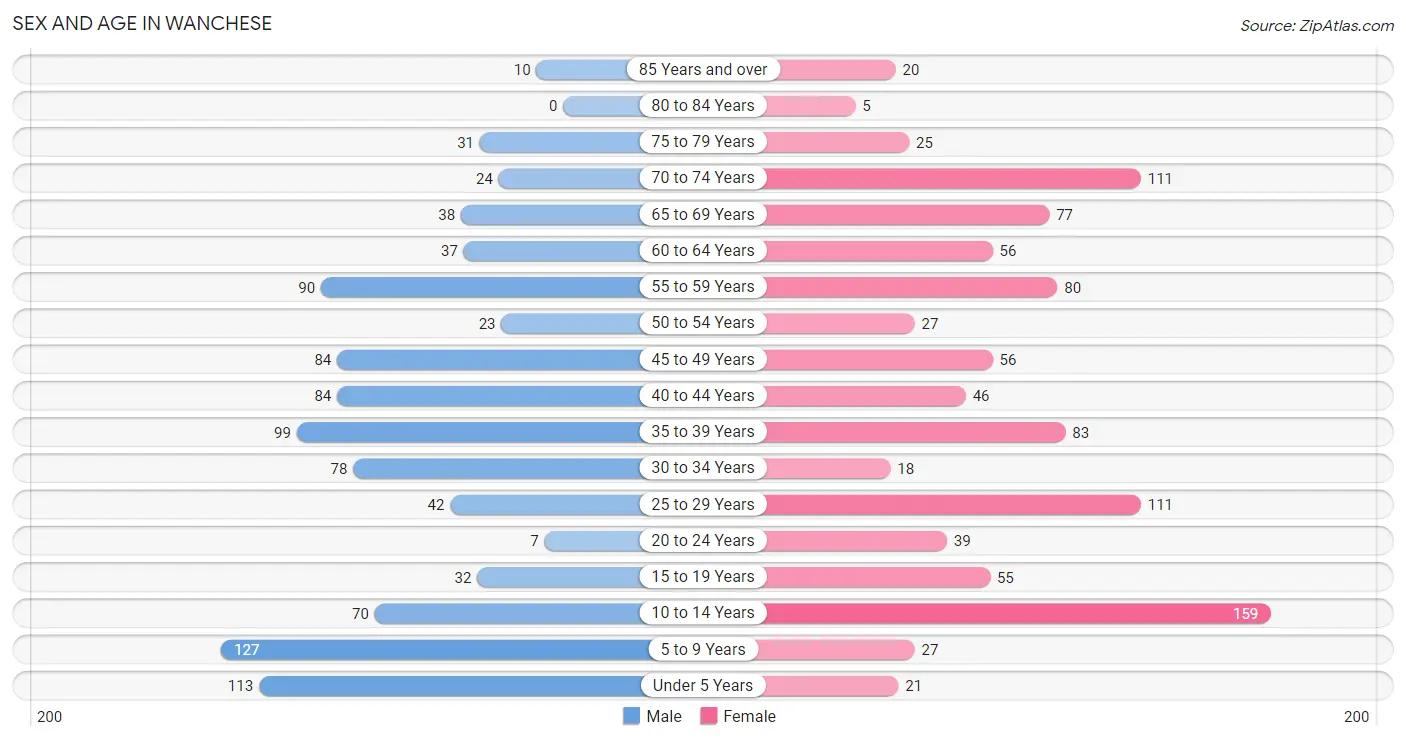
The most populous age groups in Wanchese are 5 to 9 Years (127 | 12.8%) for men and 10 to 14 Years (159 | 15.7%) for women.
| Age Bracket | Male | Female |
| Under 5 Years | 113 (11.4%) | 21 (2.1%) |
| 5 to 9 Years | 127 (12.8%) | 27 (2.7%) |
| 10 to 14 Years | 70 (7.1%) | 159 (15.7%) |
| 15 to 19 Years | 32 (3.2%) | 55 (5.4%) |
| 20 to 24 Years | 7 (0.7%) | 39 (3.8%) |
| 25 to 29 Years | 42 (4.3%) | 111 (10.9%) |
| 30 to 34 Years | 78 (7.9%) | 18 (1.8%) |
| 35 to 39 Years | 99 (10.0%) | 83 (8.2%) |
| 40 to 44 Years | 84 (8.5%) | 46 (4.5%) |
| 45 to 49 Years | 84 (8.5%) | 56 (5.5%) |
| 50 to 54 Years | 23 (2.3%) | 27 (2.7%) |
| 55 to 59 Years | 90 (9.1%) | 80 (7.9%) |
| 60 to 64 Years | 37 (3.7%) | 56 (5.5%) |
| 65 to 69 Years | 38 (3.8%) | 77 (7.6%) |
| 70 to 74 Years | 24 (2.4%) | 111 (10.9%) |
| 75 to 79 Years | 31 (3.1%) | 25 (2.5%) |
| 80 to 84 Years | 0 (0.0%) | 5 (0.5%) |
| 85 Years and over | 10 (1.0%) | 20 (2.0%) |
| Total | 989 (100.0%) | 1,016 (100.0%) |
Families and Households in Wanchese
Median Family Size in Wanchese
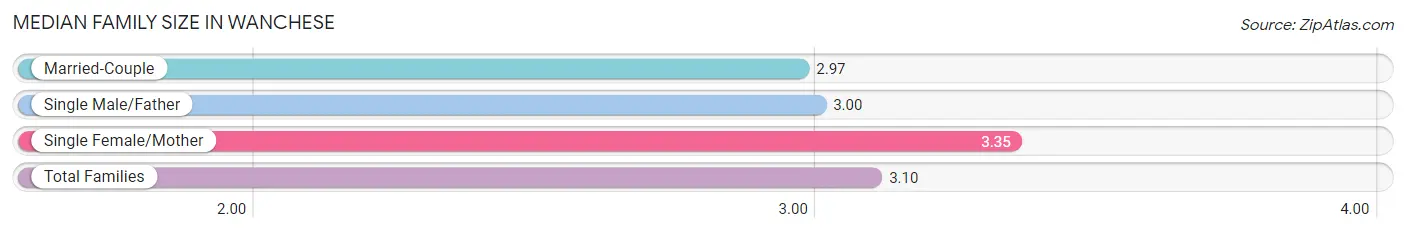
The median family size in Wanchese is 3.10 persons per family, with single female/mother families (180 | 32.6%) accounting for the largest median family size of 3.35 persons per family. On the other hand, married-couple families (337 | 60.9%) represent the smallest median family size with 2.97 persons per family.
| Family Type | # Families | Family Size |
| Married-Couple | 337 (60.9%) | 2.97 |
| Single Male/Father | 36 (6.5%) | 3.00 |
| Single Female/Mother | 180 (32.6%) | 3.35 |
| Total Families | 553 (100.0%) | 3.10 |
Median Household Size in Wanchese
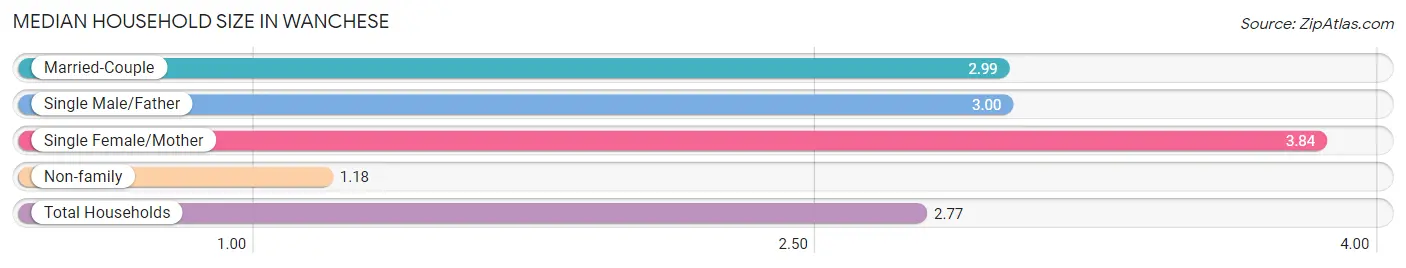
The median household size in Wanchese is 2.77 persons per household, with single female/mother households (180 | 24.9%) accounting for the largest median household size of 3.84 persons per household. non-family households (170 | 23.5%) represent the smallest median household size with 1.18 persons per household.
| Household Type | # Households | Household Size |
| Married-Couple | 337 (46.6%) | 2.99 |
| Single Male/Father | 36 (5.0%) | 3.00 |
| Single Female/Mother | 180 (24.9%) | 3.84 |
| Non-family | 170 (23.5%) | 1.18 |
| Total Households | 723 (100.0%) | 2.77 |
Household Size by Marriage Status in Wanchese
Out of a total of 723 households in Wanchese, 553 (76.5%) are family households, while 170 (23.5%) are nonfamily households. The most numerous type of family households are 2-person households, comprising 248, and the most common type of nonfamily households are 1-person households, comprising 150.
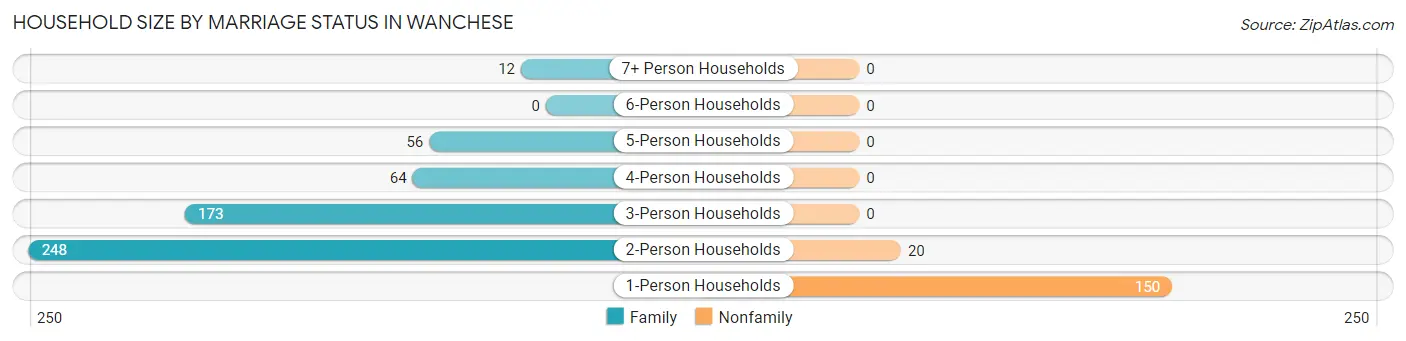
| Household Size | Family Households | Nonfamily Households |
| 1-Person Households | - | 150 (20.7%) |
| 2-Person Households | 248 (34.3%) | 20 (2.8%) |
| 3-Person Households | 173 (23.9%) | 0 (0.0%) |
| 4-Person Households | 64 (8.8%) | 0 (0.0%) |
| 5-Person Households | 56 (7.7%) | 0 (0.0%) |
| 6-Person Households | 0 (0.0%) | 0 (0.0%) |
| 7+ Person Households | 12 (1.7%) | 0 (0.0%) |
| Total | 553 (76.5%) | 170 (23.5%) |
Female Fertility in Wanchese
Fertility by Age in Wanchese
Average fertility rate in Wanchese is 83.0 births per 1,000 women. Women in the age bracket of 20 to 34 years have the highest fertility rate with 179.0 births per 1,000 women. Women in the age bracket of 20 to 34 years acount for 88.2% of all women with births.
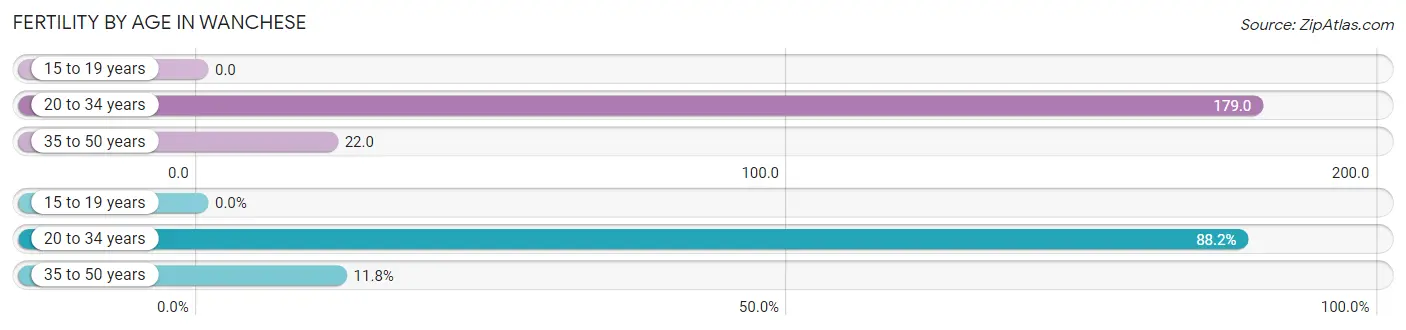
| Age Bracket | Women with Births | Births / 1,000 Women |
| 15 to 19 years | 0 (0.0%) | 0.0 |
| 20 to 34 years | 30 (88.2%) | 179.0 |
| 35 to 50 years | 4 (11.8%) | 22.0 |
| Total | 34 (100.0%) | 83.0 |
Fertility by Age by Marriage Status in Wanchese
23.5% of women with births (34) in Wanchese are married. The highest percentage of unmarried women with births falls into 20 to 34 years age bracket with 86.7% of them unmarried at the time of birth, while the lowest percentage of unmarried women with births belong to 35 to 50 years age bracket with 0.0% of them unmarried.
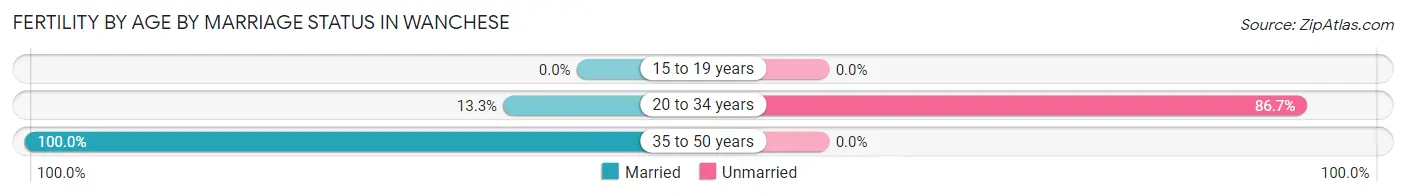
| Age Bracket | Married | Unmarried |
| 15 to 19 years | 0 (0.0%) | 0 (0.0%) |
| 20 to 34 years | 4 (13.3%) | 26 (86.7%) |
| 35 to 50 years | 4 (100.0%) | 0 (0.0%) |
| Total | 8 (23.5%) | 26 (76.5%) |
Fertility by Education in Wanchese
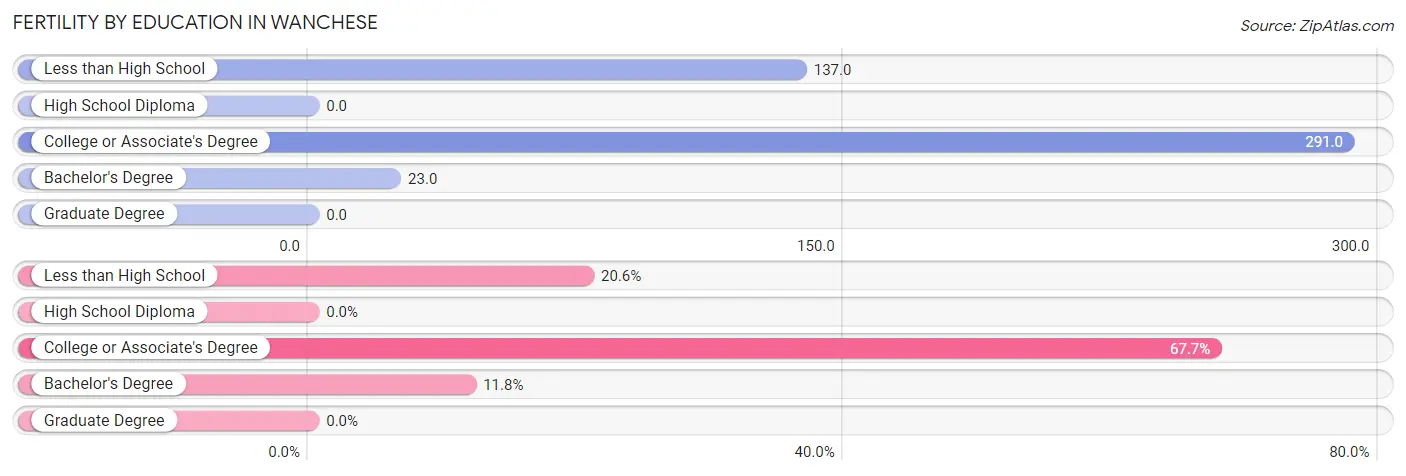
| Educational Attainment | Women with Births | Births / 1,000 Women |
| Less than High School | 7 (20.6%) | 137.0 |
| High School Diploma | 0 (0.0%) | 0.0 |
| College or Associate's Degree | 23 (67.6%) | 291.0 |
| Bachelor's Degree | 4 (11.8%) | 23.0 |
| Graduate Degree | 0 (0.0%) | 0.0 |
| Total | 34 (100.0%) | 83.0 |
Fertility by Education by Marriage Status in Wanchese
76.5% of women with births in Wanchese are unmarried. Women with the educational attainment of bachelor's degree are most likely to be married with 100.0% of them married at childbirth, while women with the educational attainment of less than high school are least likely to be married with 100.0% of them unmarried at childbirth.
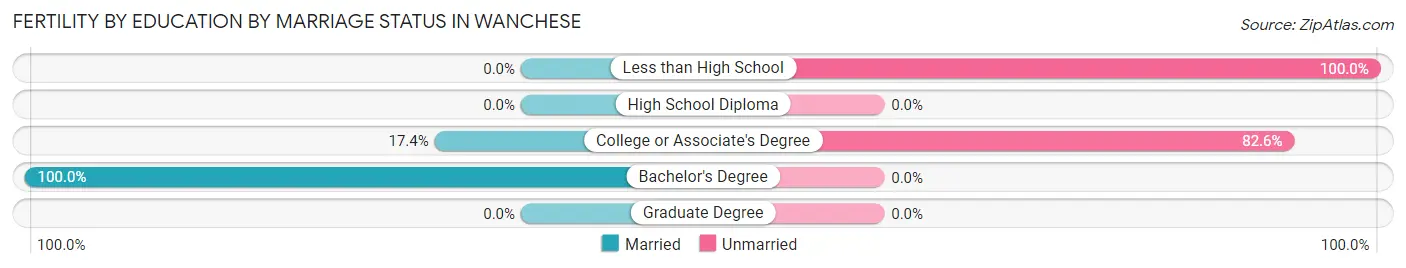
| Educational Attainment | Married | Unmarried |
| Less than High School | 0 (0.0%) | 7 (100.0%) |
| High School Diploma | 0 (0.0%) | 0 (0.0%) |
| College or Associate's Degree | 4 (17.4%) | 19 (82.6%) |
| Bachelor's Degree | 4 (100.0%) | 0 (0.0%) |
| Graduate Degree | 0 (0.0%) | 0 (0.0%) |
| Total | 8 (23.5%) | 26 (76.5%) |
Employment Characteristics in Wanchese
Employment by Class of Employer in Wanchese
Among the 1,066 employed individuals in Wanchese, private company employees (577 | 54.1%), self-employed (not incorporated) (169 | 15.9%), and state government employees (129 | 12.1%) make up the most common classes of employment.
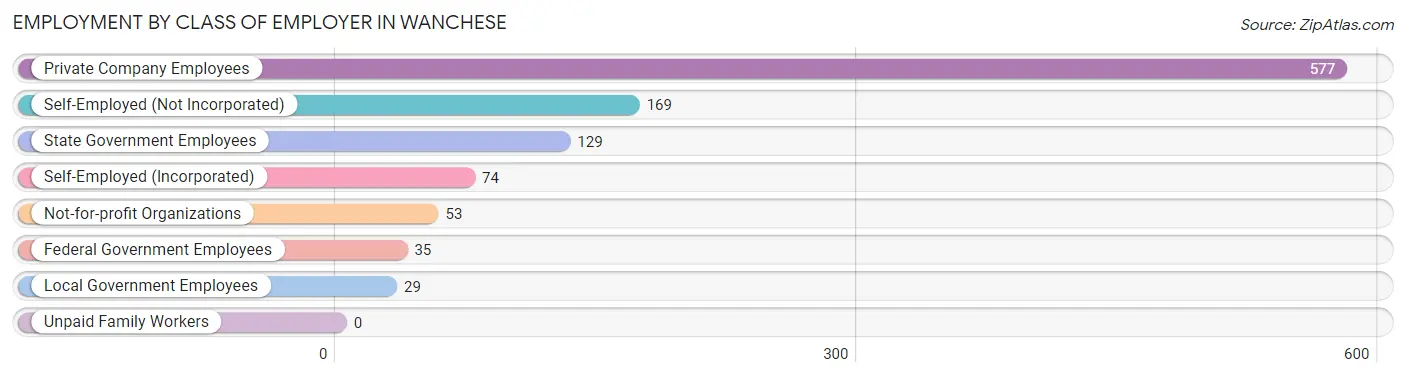
| Employer Class | # Employees | % Employees |
| Private Company Employees | 577 | 54.1% |
| Self-Employed (Incorporated) | 74 | 6.9% |
| Self-Employed (Not Incorporated) | 169 | 15.9% |
| Not-for-profit Organizations | 53 | 5.0% |
| Local Government Employees | 29 | 2.7% |
| State Government Employees | 129 | 12.1% |
| Federal Government Employees | 35 | 3.3% |
| Unpaid Family Workers | 0 | 0.0% |
| Total | 1,066 | 100.0% |
Employment Status by Age in Wanchese
According to the labor force statistics for Wanchese, out of the total population over 16 years of age (1,459), 75.2% or 1,097 individuals are in the labor force, with 0.8% or 9 of them unemployed. The age group with the highest labor force participation rate is 20 to 24 years, with 100.0% or 46 individuals in the labor force. Within the labor force, the 30 to 34 years age range has the highest percentage of unemployed individuals, with 5.4% or 5 of them being unemployed.
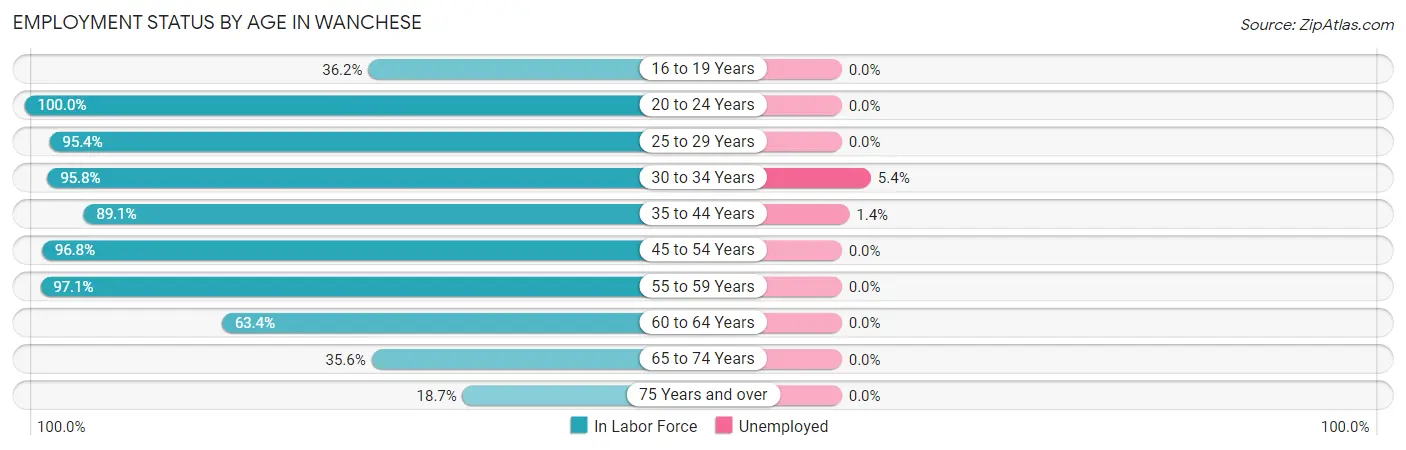
| Age Bracket | In Labor Force | Unemployed |
| 16 to 19 Years | 21 (36.2%) | 0 (0.0%) |
| 20 to 24 Years | 46 (100.0%) | 0 (0.0%) |
| 25 to 29 Years | 146 (95.4%) | 0 (0.0%) |
| 30 to 34 Years | 92 (95.8%) | 5 (5.4%) |
| 35 to 44 Years | 278 (89.1%) | 4 (1.4%) |
| 45 to 54 Years | 184 (96.8%) | 0 (0.0%) |
| 55 to 59 Years | 165 (97.1%) | 0 (0.0%) |
| 60 to 64 Years | 59 (63.4%) | 0 (0.0%) |
| 65 to 74 Years | 89 (35.6%) | 0 (0.0%) |
| 75 Years and over | 17 (18.7%) | 0 (0.0%) |
| Total | 1,097 (75.2%) | 9 (0.8%) |
Employment Status by Educational Attainment in Wanchese
According to labor force statistics for Wanchese, 91.1% of individuals (924) out of the total population between 25 and 64 years of age (1,014) are in the labor force, with 1.0% or 9 of them being unemployed. The group with the highest labor force participation rate are those with the educational attainment of bachelor's degree or higher, with 96.3% or 309 individuals in the labor force. Within the labor force, individuals with college / associate degree education have the highest percentage of unemployment, with 4.3% or 9 of them being unemployed.
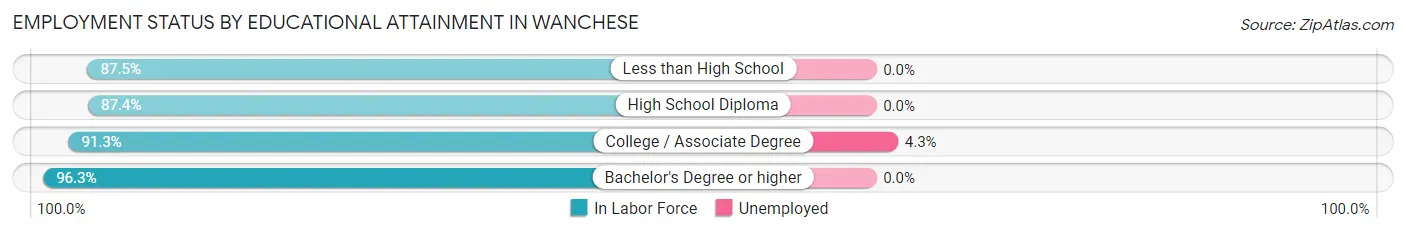
| Educational Attainment | In Labor Force | Unemployed |
| Less than High School | 77 (87.5%) | 0 (0.0%) |
| High School Diploma | 327 (87.4%) | 0 (0.0%) |
| College / Associate Degree | 211 (91.3%) | 10 (4.3%) |
| Bachelor's Degree or higher | 309 (96.3%) | 0 (0.0%) |
| Total | 924 (91.1%) | 10 (1.0%) |
Employment Occupations by Sex in Wanchese
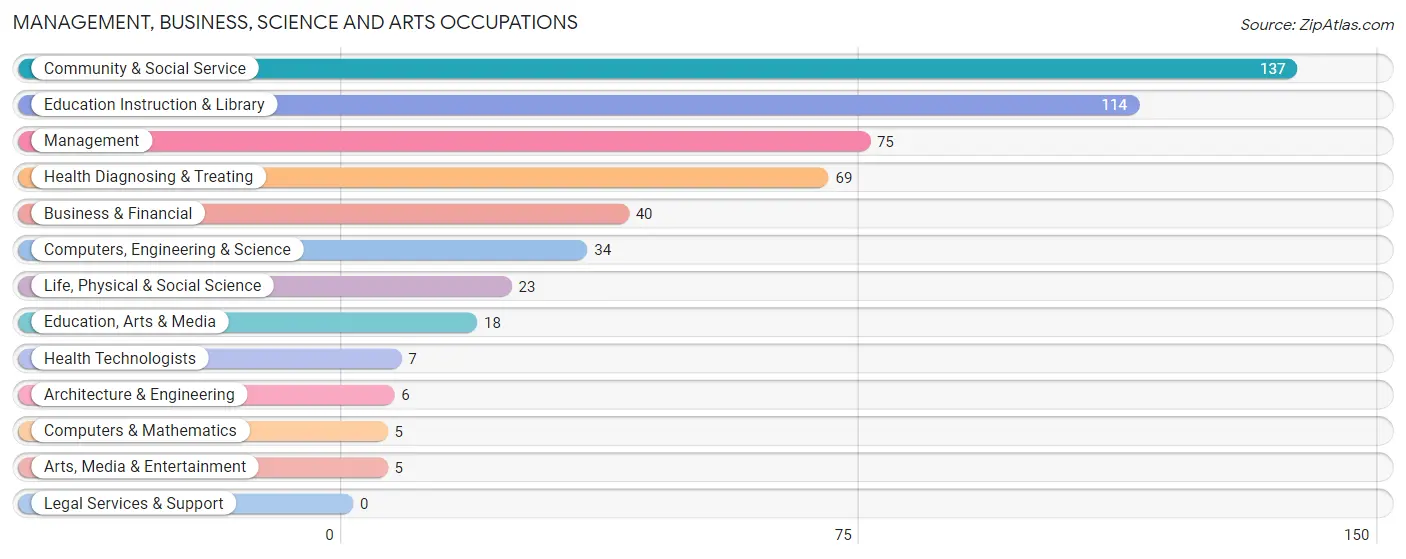
Management, Business, Science and Arts Occupations
The most common Management, Business, Science and Arts occupations in Wanchese are Community & Social Service (137 | 12.6%), Education Instruction & Library (114 | 10.5%), Management (75 | 6.9%), Health Diagnosing & Treating (69 | 6.3%), and Business & Financial (40 | 3.7%).
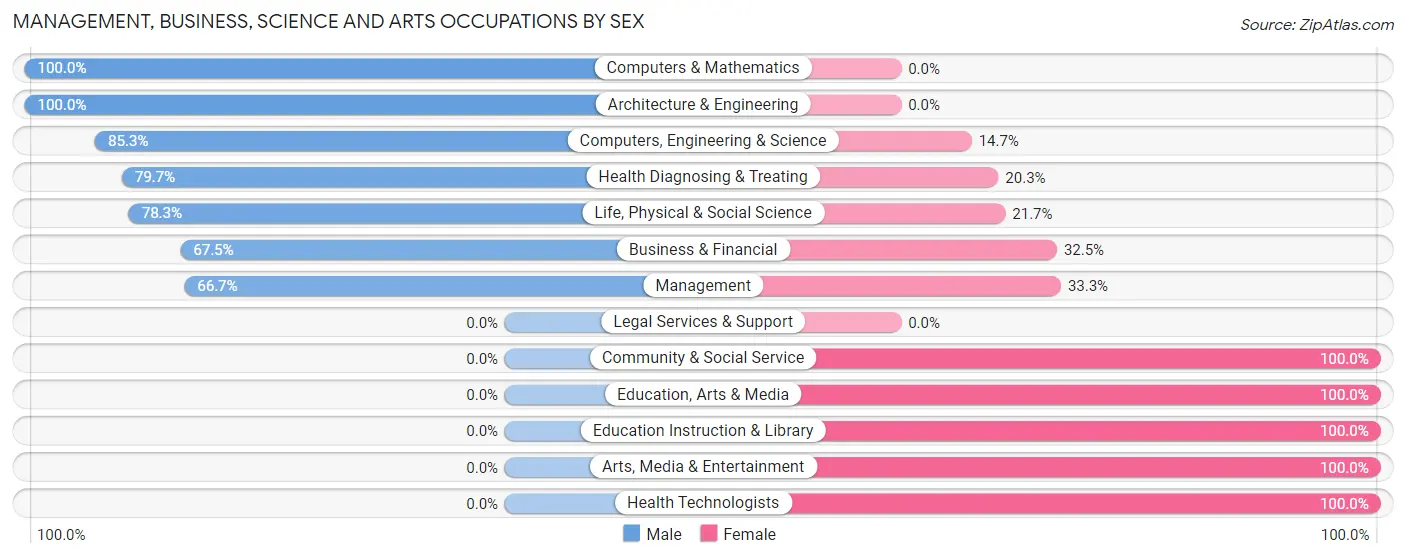
Management, Business, Science and Arts Occupations by Sex
Within the Management, Business, Science and Arts occupations in Wanchese, the most male-oriented occupations are Computers & Mathematics (100.0%), Architecture & Engineering (100.0%), and Computers, Engineering & Science (85.3%), while the most female-oriented occupations are Community & Social Service (100.0%), Education, Arts & Media (100.0%), and Education Instruction & Library (100.0%).
| Occupation | Male | Female |
| Management | 50 (66.7%) | 25 (33.3%) |
| Business & Financial | 27 (67.5%) | 13 (32.5%) |
| Computers, Engineering & Science | 29 (85.3%) | 5 (14.7%) |
| Computers & Mathematics | 5 (100.0%) | 0 (0.0%) |
| Architecture & Engineering | 6 (100.0%) | 0 (0.0%) |
| Life, Physical & Social Science | 18 (78.3%) | 5 (21.7%) |
| Community & Social Service | 0 (0.0%) | 137 (100.0%) |
| Education, Arts & Media | 0 (0.0%) | 18 (100.0%) |
| Legal Services & Support | 0 (0.0%) | 0 (0.0%) |
| Education Instruction & Library | 0 (0.0%) | 114 (100.0%) |
| Arts, Media & Entertainment | 0 (0.0%) | 5 (100.0%) |
| Health Diagnosing & Treating | 55 (79.7%) | 14 (20.3%) |
| Health Technologists | 0 (0.0%) | 7 (100.0%) |
| Total (Category) | 161 (45.4%) | 194 (54.6%) |
| Total (Overall) | 550 (50.5%) | 538 (49.4%) |
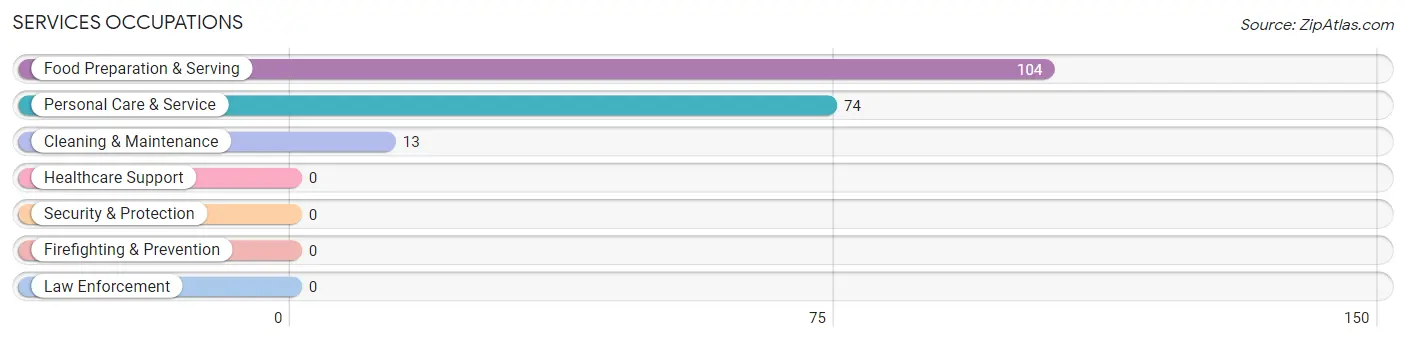
Services Occupations
The most common Services occupations in Wanchese are Food Preparation & Serving (104 | 9.6%), Personal Care & Service (74 | 6.8%), and Cleaning & Maintenance (13 | 1.2%).
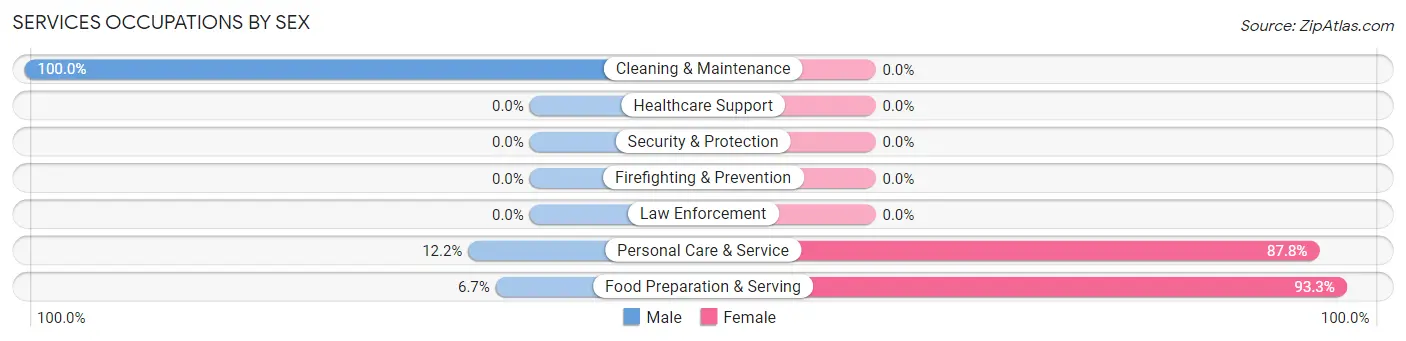
Services Occupations by Sex
Within the Services occupations in Wanchese, the most male-oriented occupations are Cleaning & Maintenance (100.0%), Personal Care & Service (12.2%), and Food Preparation & Serving (6.7%), while the most female-oriented occupations are Food Preparation & Serving (93.3%), and Personal Care & Service (87.8%).
| Occupation | Male | Female |
| Healthcare Support | 0 (0.0%) | 0 (0.0%) |
| Security & Protection | 0 (0.0%) | 0 (0.0%) |
| Firefighting & Prevention | 0 (0.0%) | 0 (0.0%) |
| Law Enforcement | 0 (0.0%) | 0 (0.0%) |
| Food Preparation & Serving | 7 (6.7%) | 97 (93.3%) |
| Cleaning & Maintenance | 13 (100.0%) | 0 (0.0%) |
| Personal Care & Service | 9 (12.2%) | 65 (87.8%) |
| Total (Category) | 29 (15.2%) | 162 (84.8%) |
| Total (Overall) | 550 (50.5%) | 538 (49.4%) |
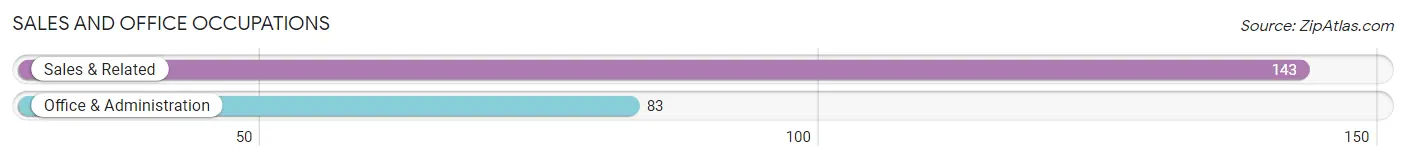
Sales and Office Occupations
The most common Sales and Office occupations in Wanchese are Sales & Related (143 | 13.1%), and Office & Administration (83 | 7.6%).
Sales and Office Occupations by Sex
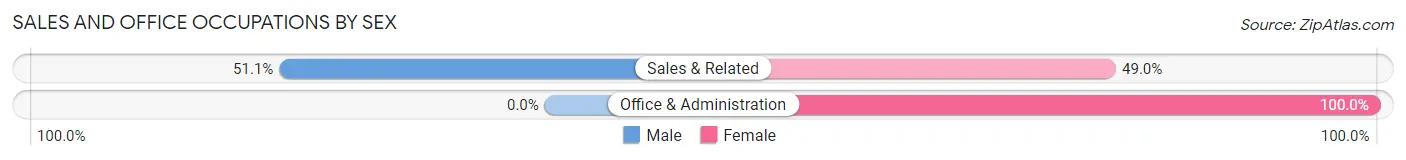
| Occupation | Male | Female |
| Sales & Related | 73 (51.0%) | 70 (48.9%) |
| Office & Administration | 0 (0.0%) | 83 (100.0%) |
| Total (Category) | 73 (32.3%) | 153 (67.7%) |
| Total (Overall) | 550 (50.5%) | 538 (49.4%) |
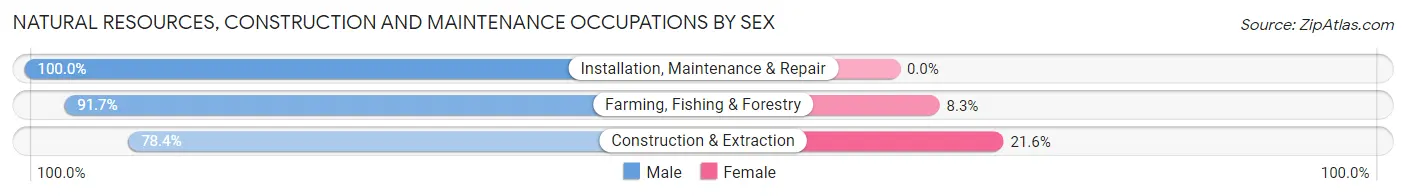
Natural Resources, Construction and Maintenance Occupations
The most common Natural Resources, Construction and Maintenance occupations in Wanchese are Farming, Fishing & Forestry (121 | 11.1%), Construction & Extraction (51 | 4.7%), and Installation, Maintenance & Repair (48 | 4.4%).

Natural Resources, Construction and Maintenance Occupations by Sex
| Occupation | Male | Female |
| Farming, Fishing & Forestry | 111 (91.7%) | 10 (8.3%) |
| Construction & Extraction | 40 (78.4%) | 11 (21.6%) |
| Installation, Maintenance & Repair | 48 (100.0%) | 0 (0.0%) |
| Total (Category) | 199 (90.4%) | 21 (9.6%) |
| Total (Overall) | 550 (50.5%) | 538 (49.4%) |
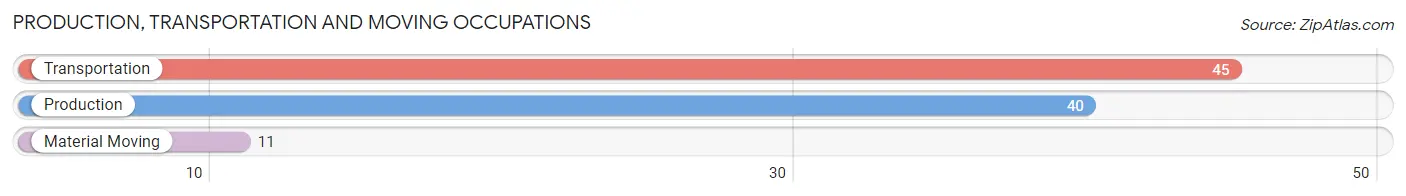
Production, Transportation and Moving Occupations
The most common Production, Transportation and Moving occupations in Wanchese are Transportation (45 | 4.1%), Production (40 | 3.7%), and Material Moving (11 | 1.0%).
Production, Transportation and Moving Occupations by Sex
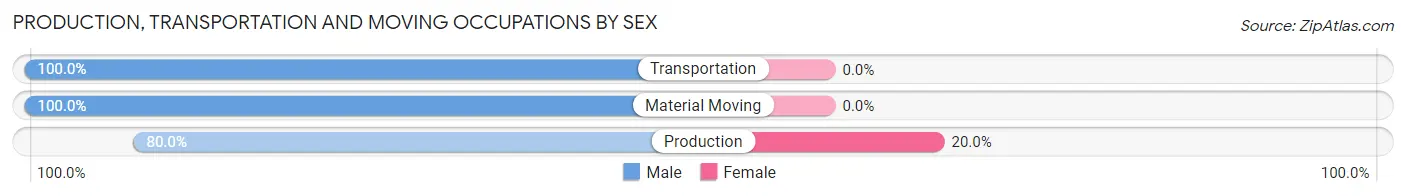
| Occupation | Male | Female |
| Production | 32 (80.0%) | 8 (20.0%) |
| Transportation | 45 (100.0%) | 0 (0.0%) |
| Material Moving | 11 (100.0%) | 0 (0.0%) |
| Total (Category) | 88 (91.7%) | 8 (8.3%) |
| Total (Overall) | 550 (50.5%) | 538 (49.4%) |
Employment Industries by Sex in Wanchese
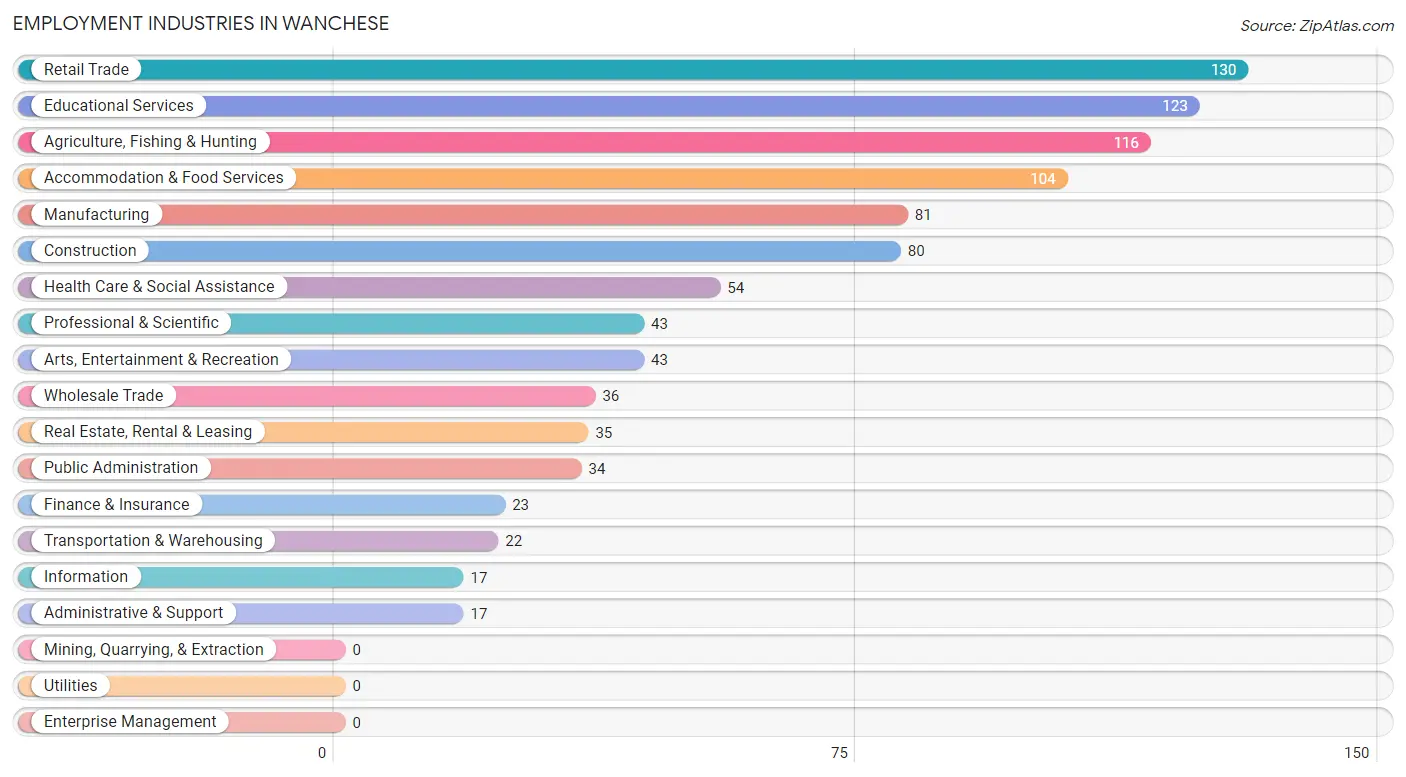
Employment Industries in Wanchese
The major employment industries in Wanchese include Retail Trade (130 | 11.9%), Educational Services (123 | 11.3%), Agriculture, Fishing & Hunting (116 | 10.7%), Accommodation & Food Services (104 | 9.6%), and Manufacturing (81 | 7.4%).
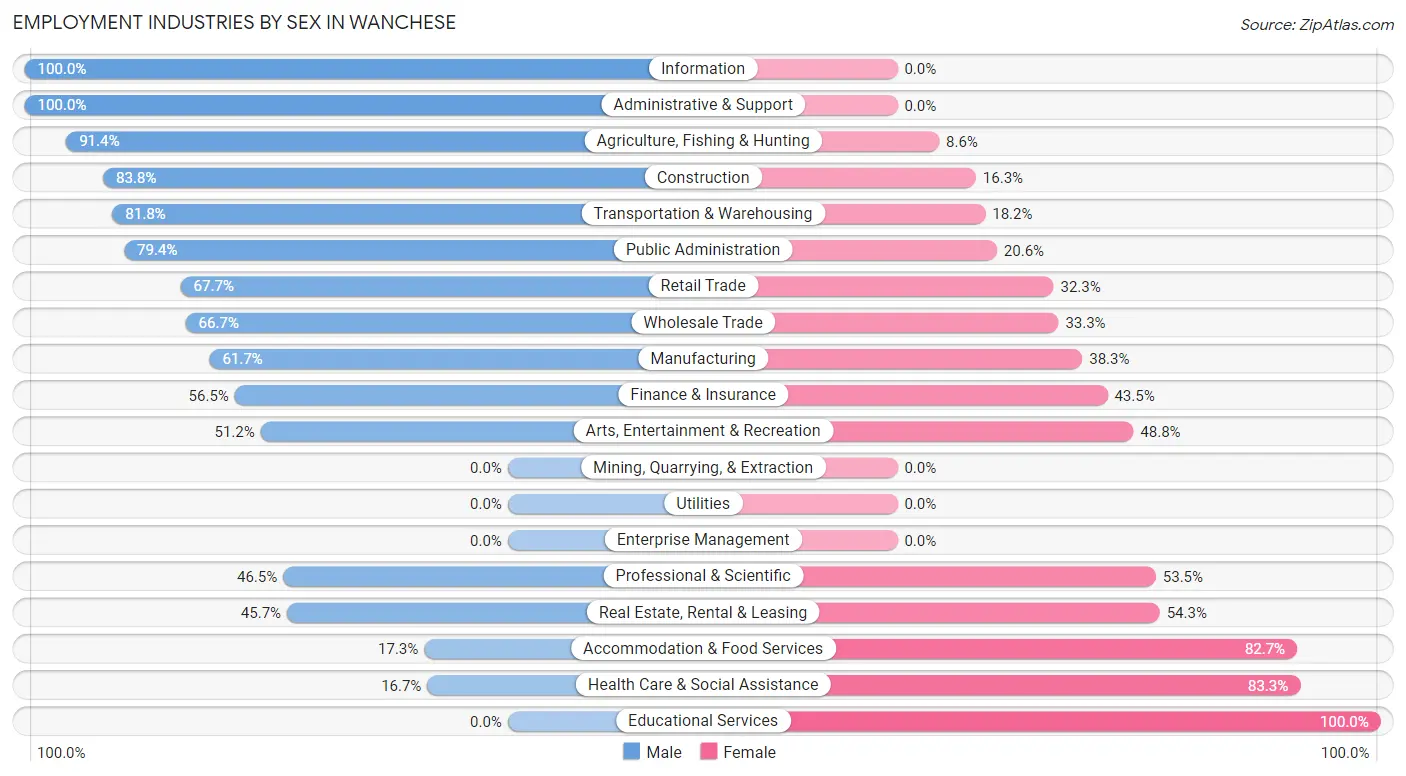
Employment Industries by Sex in Wanchese
The Wanchese industries that see more men than women are Information (100.0%), Administrative & Support (100.0%), and Agriculture, Fishing & Hunting (91.4%), whereas the industries that tend to have a higher number of women are Educational Services (100.0%), Health Care & Social Assistance (83.3%), and Accommodation & Food Services (82.7%).
| Industry | Male | Female |
| Agriculture, Fishing & Hunting | 106 (91.4%) | 10 (8.6%) |
| Mining, Quarrying, & Extraction | 0 (0.0%) | 0 (0.0%) |
| Construction | 67 (83.8%) | 13 (16.3%) |
| Manufacturing | 50 (61.7%) | 31 (38.3%) |
| Wholesale Trade | 24 (66.7%) | 12 (33.3%) |
| Retail Trade | 88 (67.7%) | 42 (32.3%) |
| Transportation & Warehousing | 18 (81.8%) | 4 (18.2%) |
| Utilities | 0 (0.0%) | 0 (0.0%) |
| Information | 17 (100.0%) | 0 (0.0%) |
| Finance & Insurance | 13 (56.5%) | 10 (43.5%) |
| Real Estate, Rental & Leasing | 16 (45.7%) | 19 (54.3%) |
| Professional & Scientific | 20 (46.5%) | 23 (53.5%) |
| Enterprise Management | 0 (0.0%) | 0 (0.0%) |
| Administrative & Support | 17 (100.0%) | 0 (0.0%) |
| Educational Services | 0 (0.0%) | 123 (100.0%) |
| Health Care & Social Assistance | 9 (16.7%) | 45 (83.3%) |
| Arts, Entertainment & Recreation | 22 (51.2%) | 21 (48.8%) |
| Accommodation & Food Services | 18 (17.3%) | 86 (82.7%) |
| Public Administration | 27 (79.4%) | 7 (20.6%) |
| Total | 550 (50.5%) | 538 (49.4%) |
Education in Wanchese
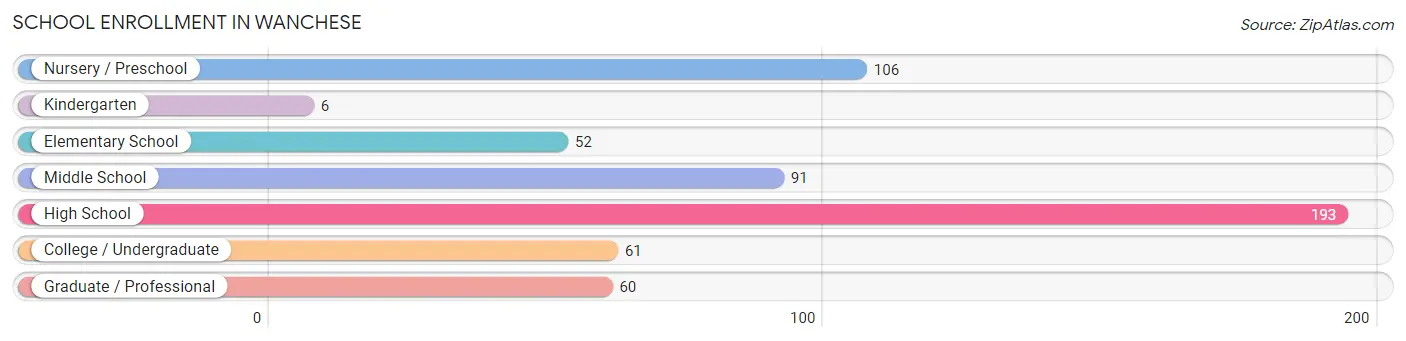
School Enrollment in Wanchese
The most common levels of schooling among the 569 students in Wanchese are high school (193 | 33.9%), nursery / preschool (106 | 18.6%), and middle school (91 | 16.0%).
| School Level | # Students | % Students |
| Nursery / Preschool | 106 | 18.6% |
| Kindergarten | 6 | 1.1% |
| Elementary School | 52 | 9.1% |
| Middle School | 91 | 16.0% |
| High School | 193 | 33.9% |
| College / Undergraduate | 61 | 10.7% |
| Graduate / Professional | 60 | 10.5% |
| Total | 569 | 100.0% |
School Enrollment by Age by Funding Source in Wanchese
Out of a total of 569 students who are enrolled in schools in Wanchese, 193 (33.9%) attend a private institution, while the remaining 376 (66.1%) are enrolled in public schools. The age group of 3 to 4 year olds has the highest likelihood of being enrolled in private schools, with 4 (100.0% in the age bracket) enrolled. Conversely, the age group of 10 to 14 year olds has the lowest likelihood of being enrolled in a private school, with 229 (100.0% in the age bracket) attending a public institution.
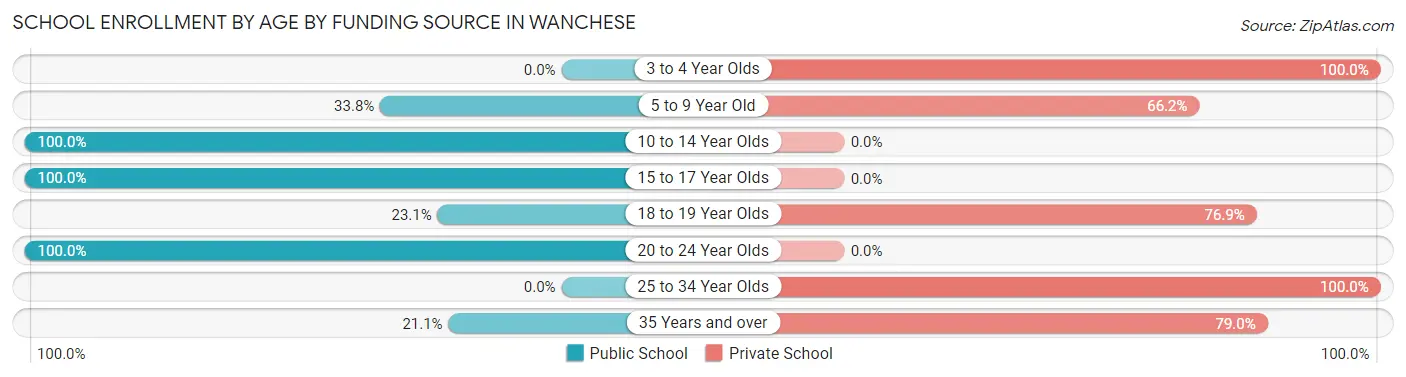
| Age Bracket | Public School | Private School |
| 3 to 4 Year Olds | 0 (0.0%) | 4 (100.0%) |
| 5 to 9 Year Old | 52 (33.8%) | 102 (66.2%) |
| 10 to 14 Year Olds | 229 (100.0%) | 0 (0.0%) |
| 15 to 17 Year Olds | 61 (100.0%) | 0 (0.0%) |
| 18 to 19 Year Olds | 6 (23.1%) | 20 (76.9%) |
| 20 to 24 Year Olds | 12 (100.0%) | 0 (0.0%) |
| 25 to 34 Year Olds | 0 (0.0%) | 7 (100.0%) |
| 35 Years and over | 16 (21.0%) | 60 (78.9%) |
| Total | 376 (66.1%) | 193 (33.9%) |
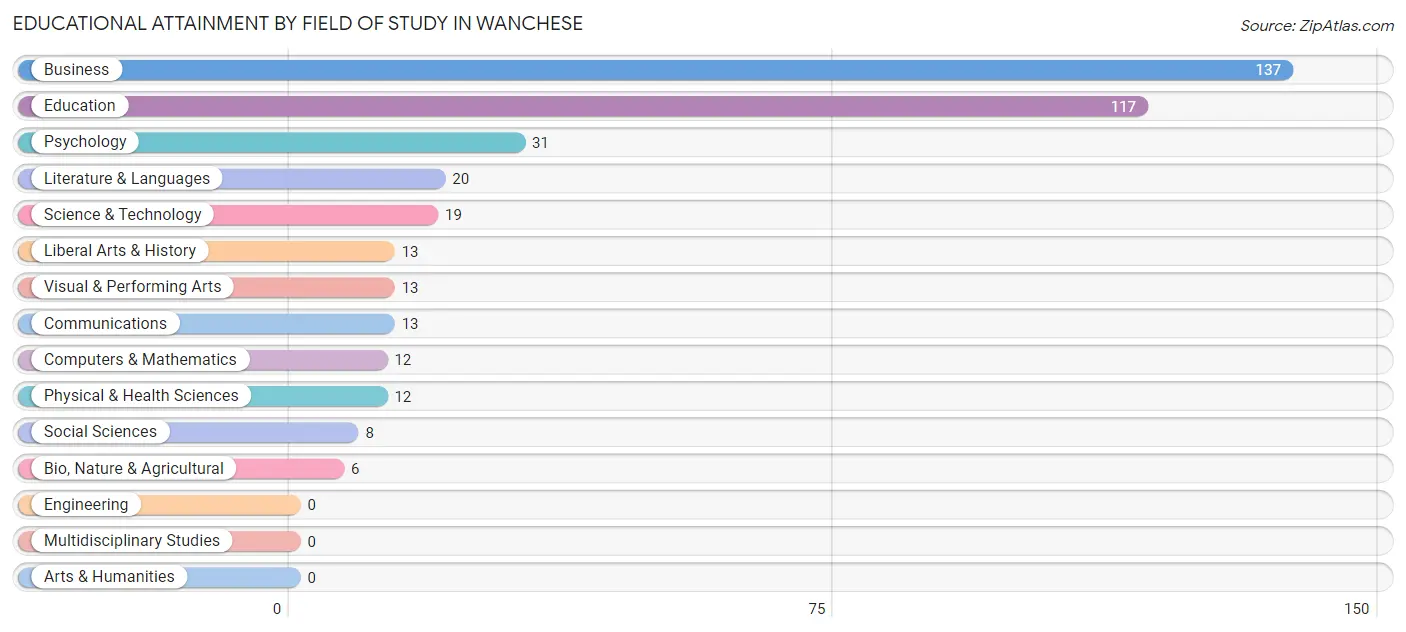
Educational Attainment by Field of Study in Wanchese
Business (137 | 34.2%), education (117 | 29.2%), psychology (31 | 7.7%), literature & languages (20 | 5.0%), and science & technology (19 | 4.7%) are the most common fields of study among 401 individuals in Wanchese who have obtained a bachelor's degree or higher.
| Field of Study | # Graduates | % Graduates |
| Computers & Mathematics | 12 | 3.0% |
| Bio, Nature & Agricultural | 6 | 1.5% |
| Physical & Health Sciences | 12 | 3.0% |
| Psychology | 31 | 7.7% |
| Social Sciences | 8 | 2.0% |
| Engineering | 0 | 0.0% |
| Multidisciplinary Studies | 0 | 0.0% |
| Science & Technology | 19 | 4.7% |
| Business | 137 | 34.2% |
| Education | 117 | 29.2% |
| Literature & Languages | 20 | 5.0% |
| Liberal Arts & History | 13 | 3.2% |
| Visual & Performing Arts | 13 | 3.2% |
| Communications | 13 | 3.2% |
| Arts & Humanities | 0 | 0.0% |
| Total | 401 | 100.0% |
Transportation & Commute in Wanchese
Vehicle Availability by Sex in Wanchese
The most prevalent vehicle ownership categories in Wanchese are males with 2 vehicles (245, accounting for 44.9%) and females with 2 vehicles (189, making up 47.1%).
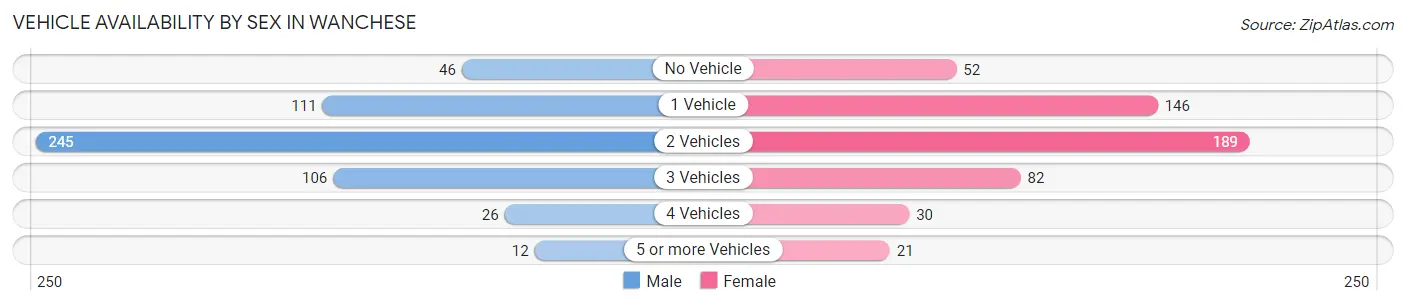
| Vehicles Available | Male | Female |
| No Vehicle | 46 (8.4%) | 52 (10.0%) |
| 1 Vehicle | 111 (20.3%) | 146 (28.1%) |
| 2 Vehicles | 245 (44.9%) | 189 (36.3%) |
| 3 Vehicles | 106 (19.4%) | 82 (15.8%) |
| 4 Vehicles | 26 (4.8%) | 30 (5.8%) |
| 5 or more Vehicles | 12 (2.2%) | 21 (4.0%) |
| Total | 546 (100.0%) | 520 (100.0%) |
Commute Time in Wanchese
The most frequently occuring commute durations in Wanchese are 15 to 19 minutes (276 commuters, 27.1%), 5 to 9 minutes (153 commuters, 15.0%), and less than 5 minutes (133 commuters, 13.1%).
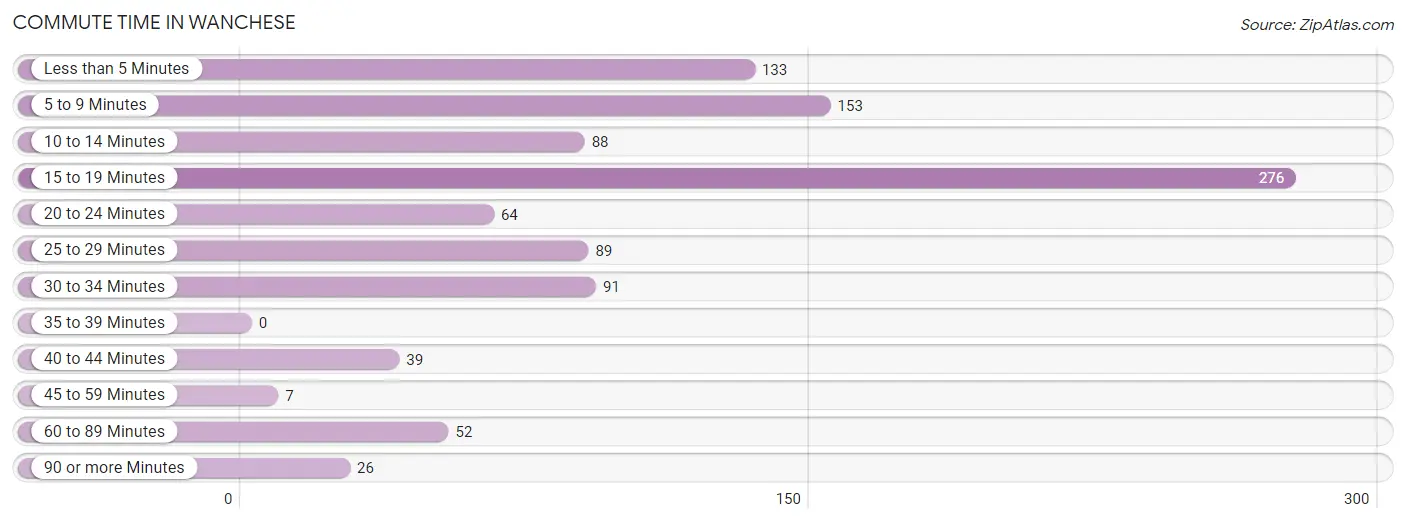
| Commute Time | # Commuters | % Commuters |
| Less than 5 Minutes | 133 | 13.1% |
| 5 to 9 Minutes | 153 | 15.0% |
| 10 to 14 Minutes | 88 | 8.6% |
| 15 to 19 Minutes | 276 | 27.1% |
| 20 to 24 Minutes | 64 | 6.3% |
| 25 to 29 Minutes | 89 | 8.7% |
| 30 to 34 Minutes | 91 | 8.9% |
| 35 to 39 Minutes | 0 | 0.0% |
| 40 to 44 Minutes | 39 | 3.8% |
| 45 to 59 Minutes | 7 | 0.7% |
| 60 to 89 Minutes | 52 | 5.1% |
| 90 or more Minutes | 26 | 2.5% |
Commute Time by Sex in Wanchese
The most common commute times in Wanchese are 15 to 19 minutes (110 commuters, 20.8%) for males and 15 to 19 minutes (166 commuters, 33.9%) for females.
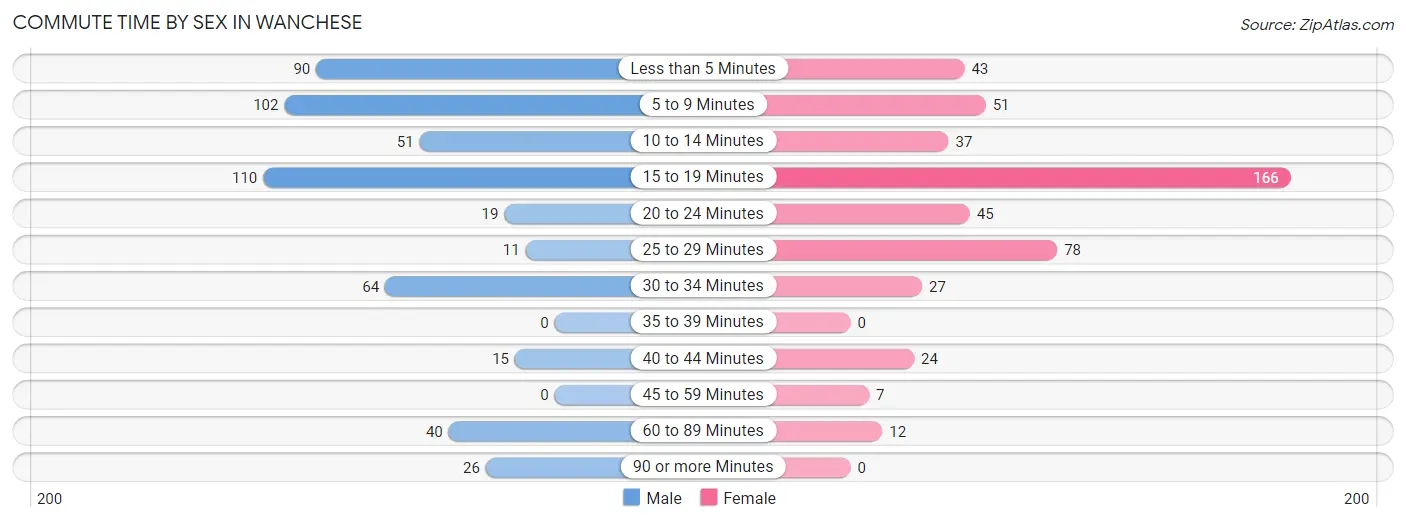
| Commute Time | Male | Female |
| Less than 5 Minutes | 90 (17.1%) | 43 (8.8%) |
| 5 to 9 Minutes | 102 (19.3%) | 51 (10.4%) |
| 10 to 14 Minutes | 51 (9.7%) | 37 (7.5%) |
| 15 to 19 Minutes | 110 (20.8%) | 166 (33.9%) |
| 20 to 24 Minutes | 19 (3.6%) | 45 (9.2%) |
| 25 to 29 Minutes | 11 (2.1%) | 78 (15.9%) |
| 30 to 34 Minutes | 64 (12.1%) | 27 (5.5%) |
| 35 to 39 Minutes | 0 (0.0%) | 0 (0.0%) |
| 40 to 44 Minutes | 15 (2.8%) | 24 (4.9%) |
| 45 to 59 Minutes | 0 (0.0%) | 7 (1.4%) |
| 60 to 89 Minutes | 40 (7.6%) | 12 (2.5%) |
| 90 or more Minutes | 26 (4.9%) | 0 (0.0%) |
Time of Departure to Work by Sex in Wanchese
The most frequent times of departure to work in Wanchese are 7:00 AM to 7:29 AM (157, 29.7%) for males and 8:00 AM to 8:29 AM (144, 29.4%) for females.
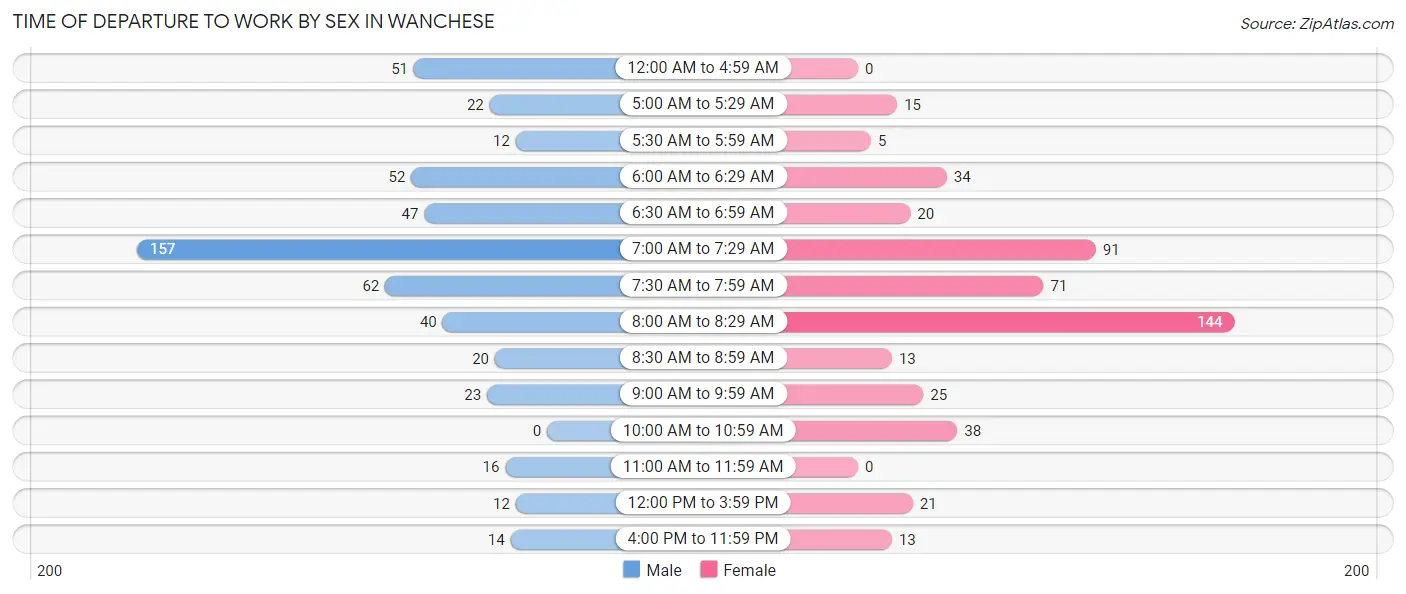
| Time of Departure | Male | Female |
| 12:00 AM to 4:59 AM | 51 (9.7%) | 0 (0.0%) |
| 5:00 AM to 5:29 AM | 22 (4.2%) | 15 (3.1%) |
| 5:30 AM to 5:59 AM | 12 (2.3%) | 5 (1.0%) |
| 6:00 AM to 6:29 AM | 52 (9.9%) | 34 (6.9%) |
| 6:30 AM to 6:59 AM | 47 (8.9%) | 20 (4.1%) |
| 7:00 AM to 7:29 AM | 157 (29.7%) | 91 (18.6%) |
| 7:30 AM to 7:59 AM | 62 (11.7%) | 71 (14.5%) |
| 8:00 AM to 8:29 AM | 40 (7.6%) | 144 (29.4%) |
| 8:30 AM to 8:59 AM | 20 (3.8%) | 13 (2.6%) |
| 9:00 AM to 9:59 AM | 23 (4.4%) | 25 (5.1%) |
| 10:00 AM to 10:59 AM | 0 (0.0%) | 38 (7.8%) |
| 11:00 AM to 11:59 AM | 16 (3.0%) | 0 (0.0%) |
| 12:00 PM to 3:59 PM | 12 (2.3%) | 21 (4.3%) |
| 4:00 PM to 11:59 PM | 14 (2.6%) | 13 (2.6%) |
| Total | 528 (100.0%) | 490 (100.0%) |
Housing Occupancy in Wanchese
Occupancy by Ownership in Wanchese
Of the total 723 dwellings in Wanchese, owner-occupied units account for 556 (76.9%), while renter-occupied units make up 167 (23.1%).
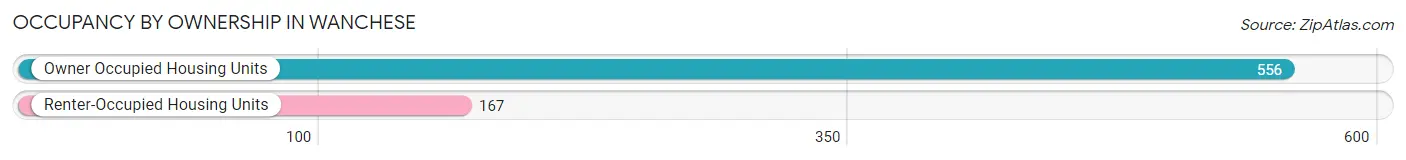
| Occupancy | # Housing Units | % Housing Units |
| Owner Occupied Housing Units | 556 | 76.9% |
| Renter-Occupied Housing Units | 167 | 23.1% |
| Total Occupied Housing Units | 723 | 100.0% |
Occupancy by Household Size in Wanchese
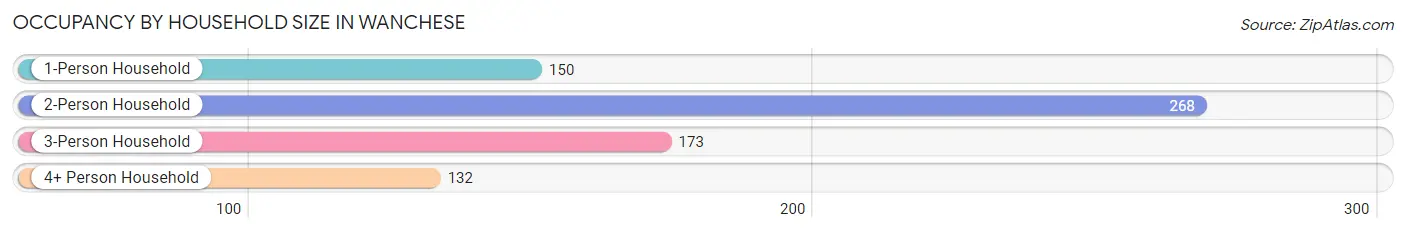
| Household Size | # Housing Units | % Housing Units |
| 1-Person Household | 150 | 20.7% |
| 2-Person Household | 268 | 37.1% |
| 3-Person Household | 173 | 23.9% |
| 4+ Person Household | 132 | 18.3% |
| Total Housing Units | 723 | 100.0% |
Occupancy by Ownership by Household Size in Wanchese
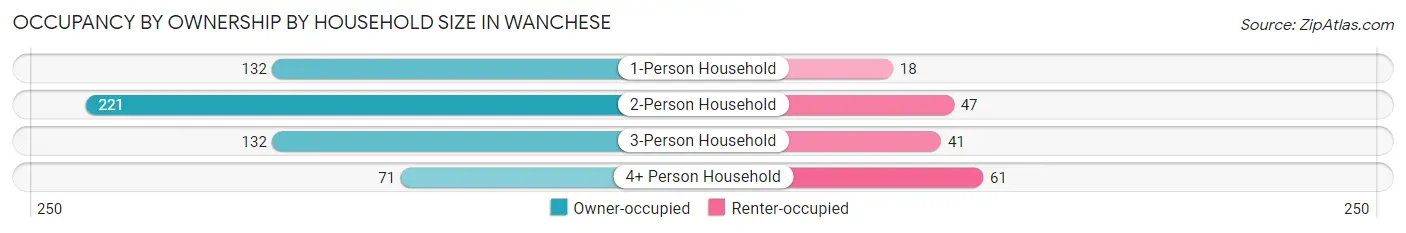
| Household Size | Owner-occupied | Renter-occupied |
| 1-Person Household | 132 (88.0%) | 18 (12.0%) |
| 2-Person Household | 221 (82.5%) | 47 (17.5%) |
| 3-Person Household | 132 (76.3%) | 41 (23.7%) |
| 4+ Person Household | 71 (53.8%) | 61 (46.2%) |
| Total Housing Units | 556 (76.9%) | 167 (23.1%) |
Occupancy by Educational Attainment in Wanchese
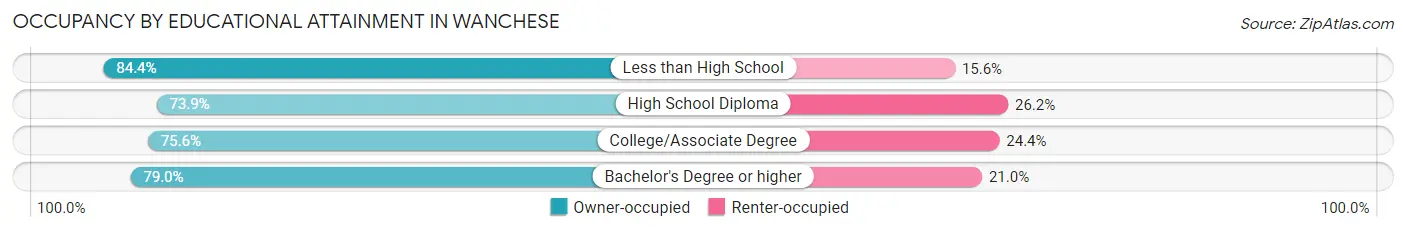
| Household Size | Owner-occupied | Renter-occupied |
| Less than High School | 54 (84.4%) | 10 (15.6%) |
| High School Diploma | 161 (73.9%) | 57 (26.2%) |
| College/Associate Degree | 164 (75.6%) | 53 (24.4%) |
| Bachelor's Degree or higher | 177 (79.0%) | 47 (21.0%) |
Occupancy by Age of Householder in Wanchese
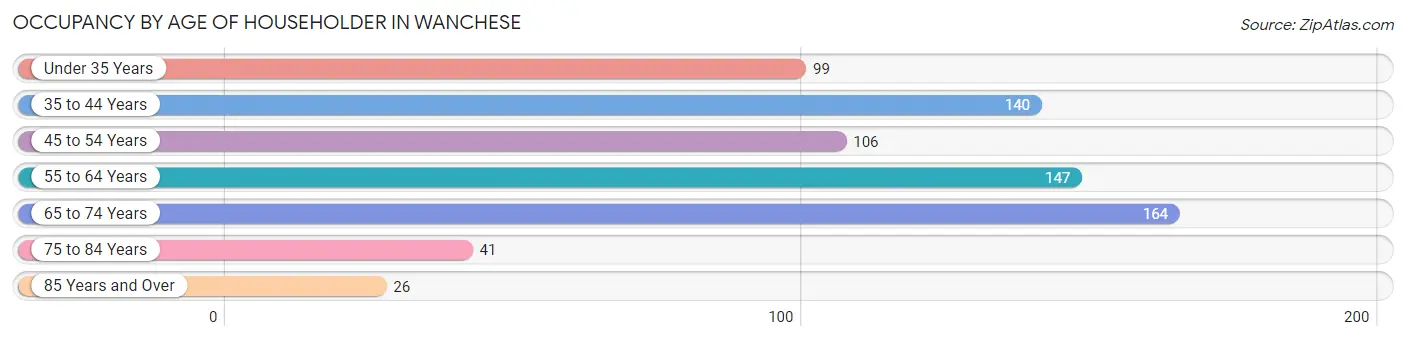
| Age Bracket | # Households | % Households |
| Under 35 Years | 99 | 13.7% |
| 35 to 44 Years | 140 | 19.4% |
| 45 to 54 Years | 106 | 14.7% |
| 55 to 64 Years | 147 | 20.3% |
| 65 to 74 Years | 164 | 22.7% |
| 75 to 84 Years | 41 | 5.7% |
| 85 Years and Over | 26 | 3.6% |
| Total | 723 | 100.0% |
Housing Finances in Wanchese
Median Income by Occupancy in Wanchese
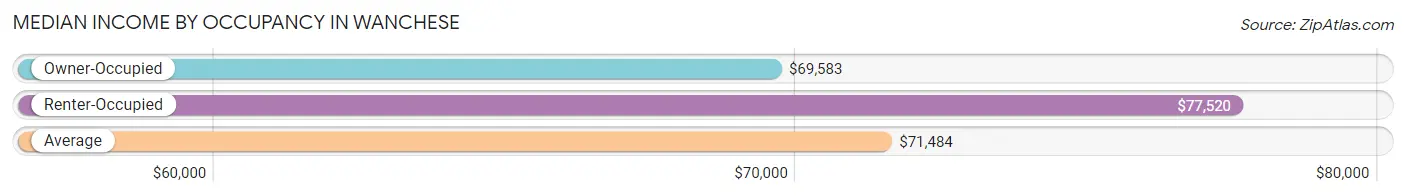
| Occupancy Type | # Households | Median Income |
| Owner-Occupied | 556 (76.9%) | $69,583 |
| Renter-Occupied | 167 (23.1%) | $77,520 |
| Average | 723 (100.0%) | $71,484 |
Occupancy by Householder Income Bracket in Wanchese
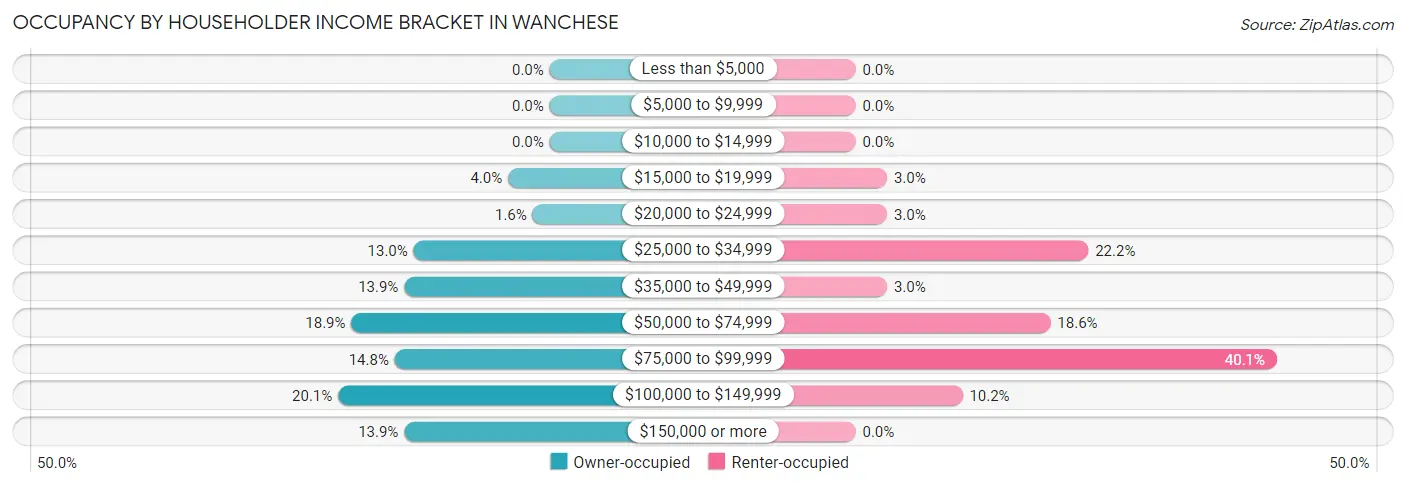
| Income Bracket | Owner-occupied | Renter-occupied |
| Less than $5,000 | 0 (0.0%) | 0 (0.0%) |
| $5,000 to $9,999 | 0 (0.0%) | 0 (0.0%) |
| $10,000 to $14,999 | 0 (0.0%) | 0 (0.0%) |
| $15,000 to $19,999 | 22 (4.0%) | 5 (3.0%) |
| $20,000 to $24,999 | 9 (1.6%) | 5 (3.0%) |
| $25,000 to $34,999 | 72 (13.0%) | 37 (22.2%) |
| $35,000 to $49,999 | 77 (13.9%) | 5 (3.0%) |
| $50,000 to $74,999 | 105 (18.9%) | 31 (18.6%) |
| $75,000 to $99,999 | 82 (14.7%) | 67 (40.1%) |
| $100,000 to $149,999 | 112 (20.1%) | 17 (10.2%) |
| $150,000 or more | 77 (13.9%) | 0 (0.0%) |
| Total | 556 (100.0%) | 167 (100.0%) |
Monthly Housing Cost Tiers in Wanchese
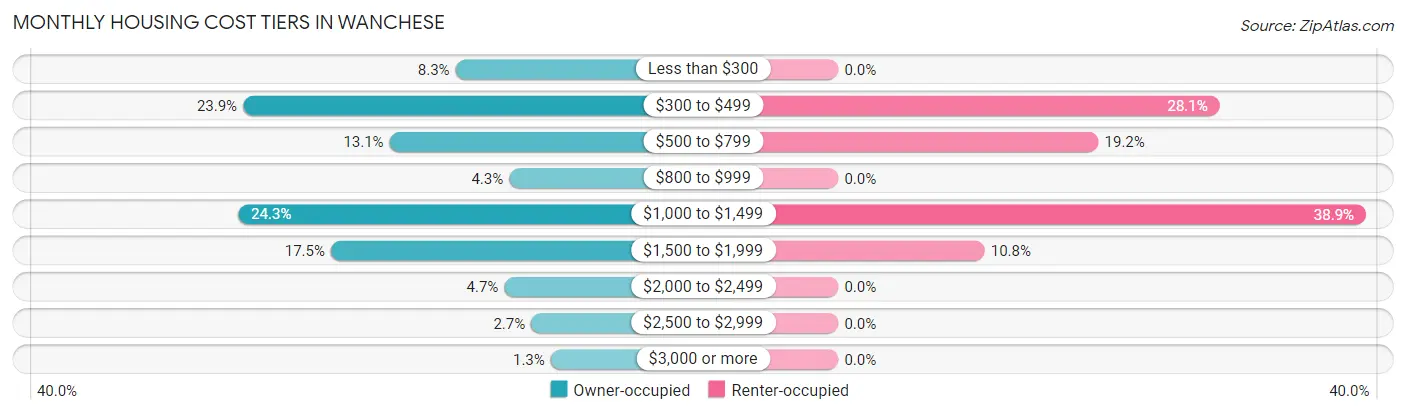
| Monthly Cost | Owner-occupied | Renter-occupied |
| Less than $300 | 46 (8.3%) | 0 (0.0%) |
| $300 to $499 | 133 (23.9%) | 47 (28.1%) |
| $500 to $799 | 73 (13.1%) | 32 (19.2%) |
| $800 to $999 | 24 (4.3%) | 0 (0.0%) |
| $1,000 to $1,499 | 135 (24.3%) | 65 (38.9%) |
| $1,500 to $1,999 | 97 (17.4%) | 18 (10.8%) |
| $2,000 to $2,499 | 26 (4.7%) | 0 (0.0%) |
| $2,500 to $2,999 | 15 (2.7%) | 0 (0.0%) |
| $3,000 or more | 7 (1.3%) | 0 (0.0%) |
| Total | 556 (100.0%) | 167 (100.0%) |
Physical Housing Characteristics in Wanchese
Housing Structures in Wanchese
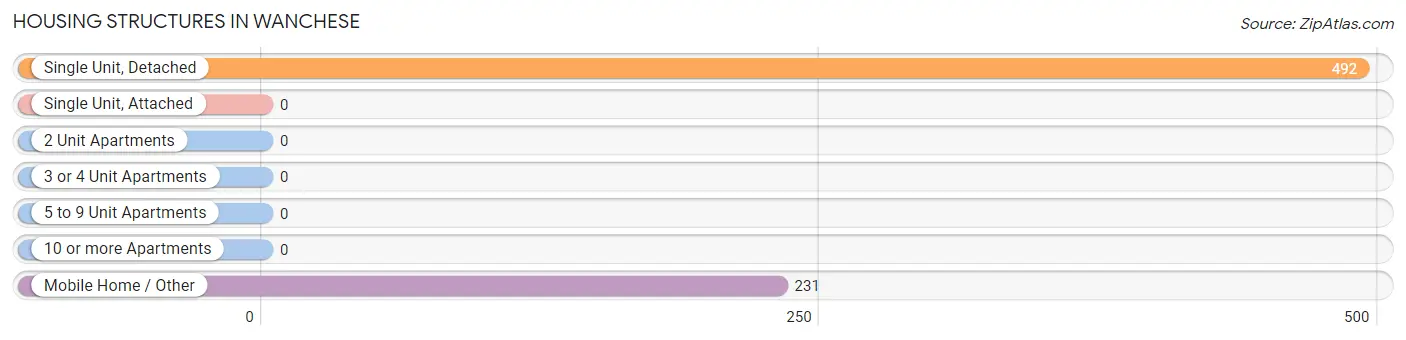
| Structure Type | # Housing Units | % Housing Units |
| Single Unit, Detached | 492 | 68.0% |
| Single Unit, Attached | 0 | 0.0% |
| 2 Unit Apartments | 0 | 0.0% |
| 3 or 4 Unit Apartments | 0 | 0.0% |
| 5 to 9 Unit Apartments | 0 | 0.0% |
| 10 or more Apartments | 0 | 0.0% |
| Mobile Home / Other | 231 | 32.0% |
| Total | 723 | 100.0% |
Housing Structures by Occupancy in Wanchese
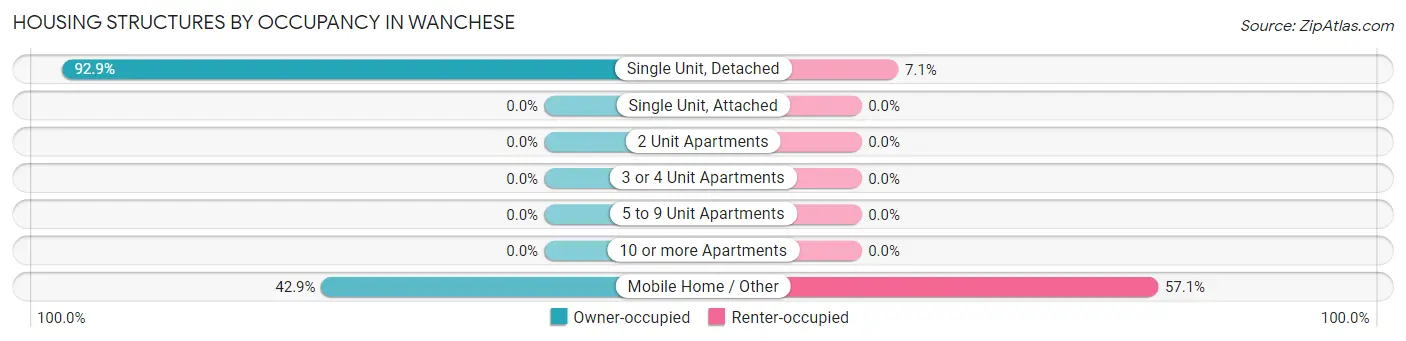
| Structure Type | Owner-occupied | Renter-occupied |
| Single Unit, Detached | 457 (92.9%) | 35 (7.1%) |
| Single Unit, Attached | 0 (0.0%) | 0 (0.0%) |
| 2 Unit Apartments | 0 (0.0%) | 0 (0.0%) |
| 3 or 4 Unit Apartments | 0 (0.0%) | 0 (0.0%) |
| 5 to 9 Unit Apartments | 0 (0.0%) | 0 (0.0%) |
| 10 or more Apartments | 0 (0.0%) | 0 (0.0%) |
| Mobile Home / Other | 99 (42.9%) | 132 (57.1%) |
| Total | 556 (76.9%) | 167 (23.1%) |
Housing Structures by Number of Rooms in Wanchese
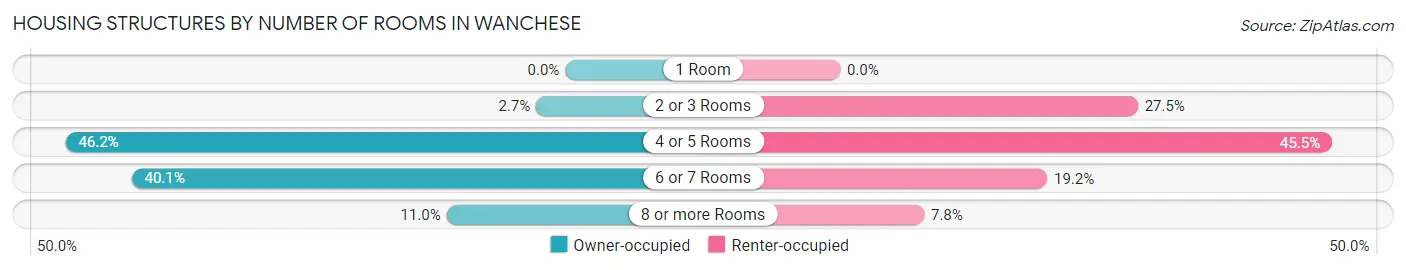
| Number of Rooms | Owner-occupied | Renter-occupied |
| 1 Room | 0 (0.0%) | 0 (0.0%) |
| 2 or 3 Rooms | 15 (2.7%) | 46 (27.5%) |
| 4 or 5 Rooms | 257 (46.2%) | 76 (45.5%) |
| 6 or 7 Rooms | 223 (40.1%) | 32 (19.2%) |
| 8 or more Rooms | 61 (11.0%) | 13 (7.8%) |
| Total | 556 (100.0%) | 167 (100.0%) |
Housing Structure by Heating Type in Wanchese
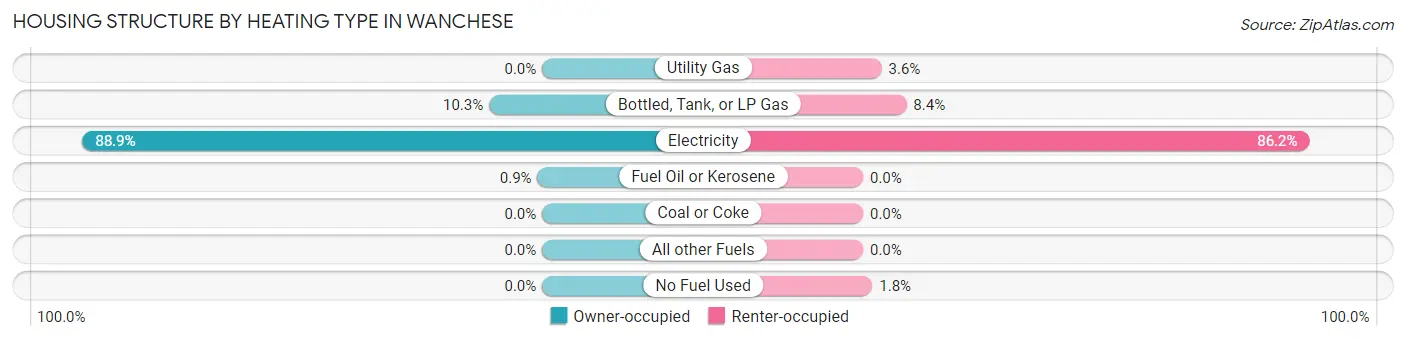
| Heating Type | Owner-occupied | Renter-occupied |
| Utility Gas | 0 (0.0%) | 6 (3.6%) |
| Bottled, Tank, or LP Gas | 57 (10.2%) | 14 (8.4%) |
| Electricity | 494 (88.8%) | 144 (86.2%) |
| Fuel Oil or Kerosene | 5 (0.9%) | 0 (0.0%) |
| Coal or Coke | 0 (0.0%) | 0 (0.0%) |
| All other Fuels | 0 (0.0%) | 0 (0.0%) |
| No Fuel Used | 0 (0.0%) | 3 (1.8%) |
| Total | 556 (100.0%) | 167 (100.0%) |
Household Vehicle Usage in Wanchese
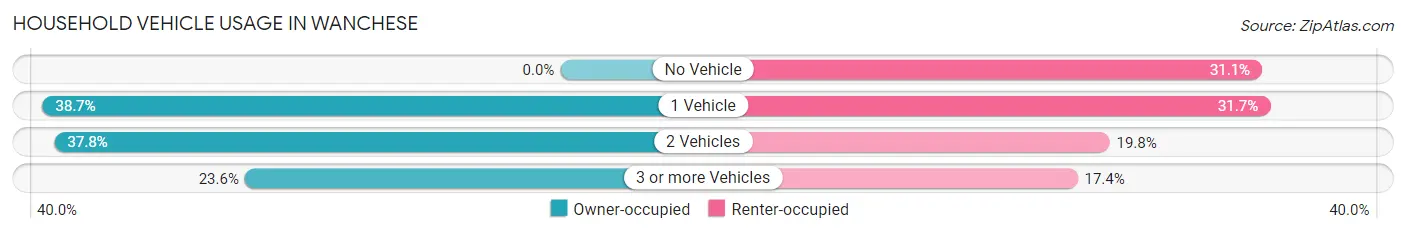
| Vehicles per Household | Owner-occupied | Renter-occupied |
| No Vehicle | 0 (0.0%) | 52 (31.1%) |
| 1 Vehicle | 215 (38.7%) | 53 (31.7%) |
| 2 Vehicles | 210 (37.8%) | 33 (19.8%) |
| 3 or more Vehicles | 131 (23.6%) | 29 (17.4%) |
| Total | 556 (100.0%) | 167 (100.0%) |
Real Estate & Mortgages in Wanchese
Real Estate and Mortgage Overview in Wanchese
| Characteristic | Without Mortgage | With Mortgage |
| Housing Units | 260 | 296 |
| Median Property Value | $234,500 | $305,400 |
| Median Household Income | $60,833 | $38 |
| Monthly Housing Costs | $453 | $7 |
| Real Estate Taxes | $1,214 | $3 |
Property Value by Mortgage Status in Wanchese
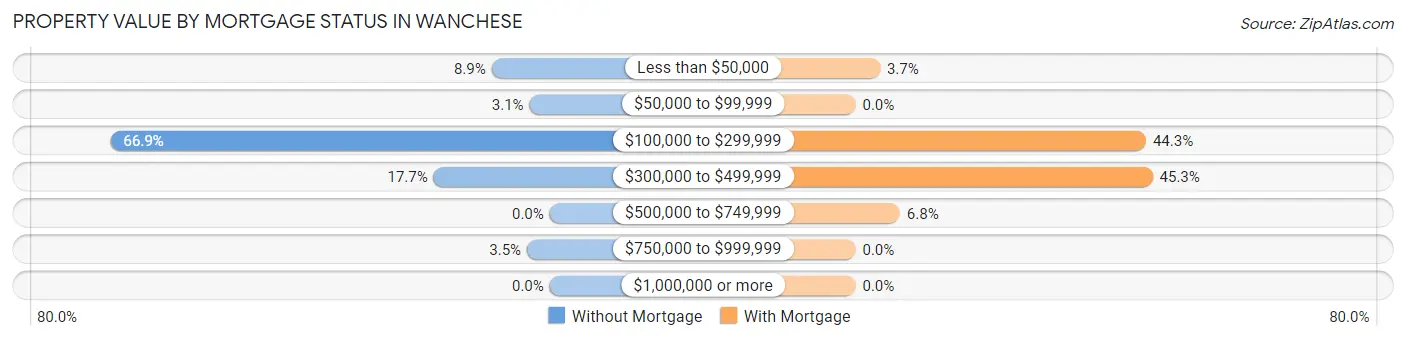
| Property Value | Without Mortgage | With Mortgage |
| Less than $50,000 | 23 (8.8%) | 11 (3.7%) |
| $50,000 to $99,999 | 8 (3.1%) | 0 (0.0%) |
| $100,000 to $299,999 | 174 (66.9%) | 131 (44.3%) |
| $300,000 to $499,999 | 46 (17.7%) | 134 (45.3%) |
| $500,000 to $749,999 | 0 (0.0%) | 20 (6.8%) |
| $750,000 to $999,999 | 9 (3.5%) | 0 (0.0%) |
| $1,000,000 or more | 0 (0.0%) | 0 (0.0%) |
| Total | 260 (100.0%) | 296 (100.0%) |
Household Income by Mortgage Status in Wanchese
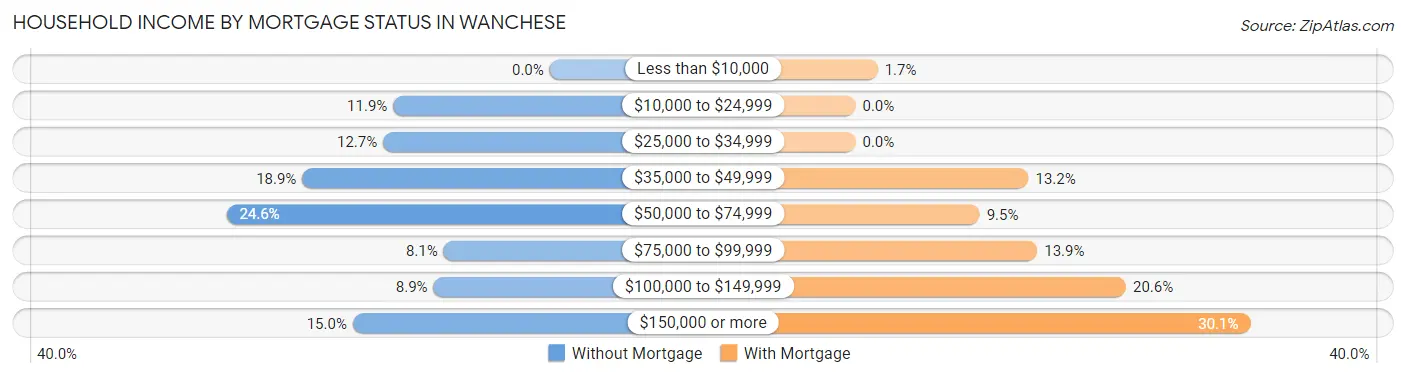
| Household Income | Without Mortgage | With Mortgage |
| Less than $10,000 | 0 (0.0%) | 5 (1.7%) |
| $10,000 to $24,999 | 31 (11.9%) | 0 (0.0%) |
| $25,000 to $34,999 | 33 (12.7%) | 0 (0.0%) |
| $35,000 to $49,999 | 49 (18.9%) | 39 (13.2%) |
| $50,000 to $74,999 | 64 (24.6%) | 28 (9.5%) |
| $75,000 to $99,999 | 21 (8.1%) | 41 (13.9%) |
| $100,000 to $149,999 | 23 (8.8%) | 61 (20.6%) |
| $150,000 or more | 39 (15.0%) | 89 (30.1%) |
| Total | 260 (100.0%) | 296 (100.0%) |
Property Value to Household Income Ratio in Wanchese
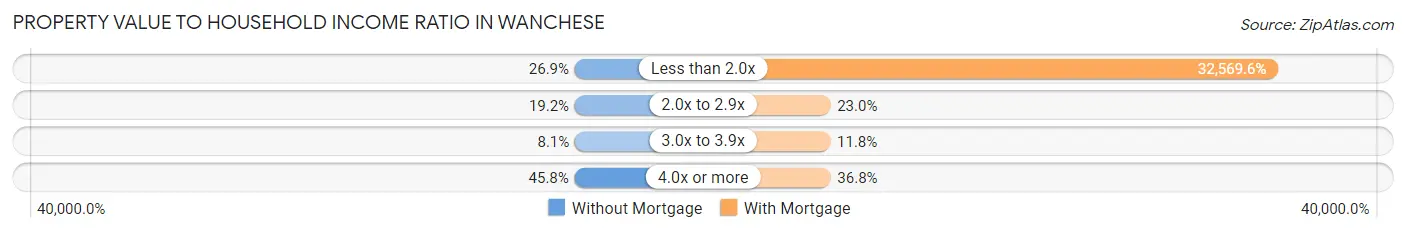
| Value-to-Income Ratio | Without Mortgage | With Mortgage |
| Less than 2.0x | 70 (26.9%) | 96,406 (32,569.6%) |
| 2.0x to 2.9x | 50 (19.2%) | 68 (23.0%) |
| 3.0x to 3.9x | 21 (8.1%) | 35 (11.8%) |
| 4.0x or more | 119 (45.8%) | 109 (36.8%) |
| Total | 260 (100.0%) | 296 (100.0%) |
Real Estate Taxes by Mortgage Status in Wanchese
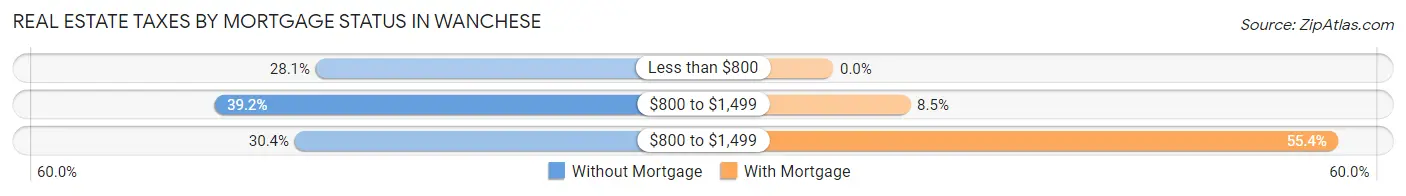
| Property Taxes | Without Mortgage | With Mortgage |
| Less than $800 | 73 (28.1%) | 0 (0.0%) |
| $800 to $1,499 | 102 (39.2%) | 25 (8.5%) |
| $800 to $1,499 | 79 (30.4%) | 164 (55.4%) |
| Total | 260 (100.0%) | 296 (100.0%) |
Health & Disability in Wanchese
Health Insurance Coverage by Age in Wanchese
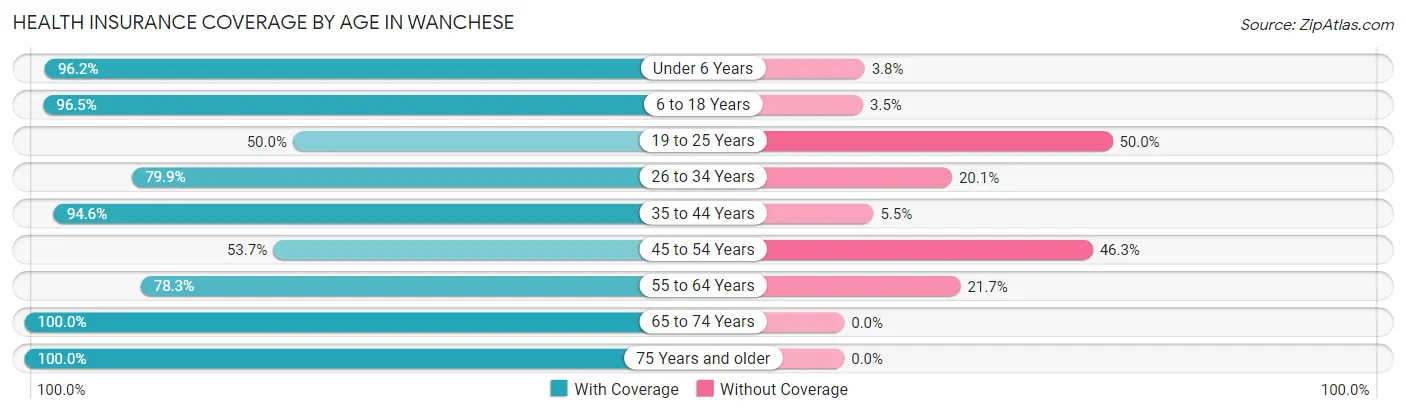
| Age Bracket | With Coverage | Without Coverage |
| Under 6 Years | 227 (96.2%) | 9 (3.8%) |
| 6 to 18 Years | 330 (96.5%) | 12 (3.5%) |
| 19 to 25 Years | 36 (50.0%) | 36 (50.0%) |
| 26 to 34 Years | 199 (79.9%) | 50 (20.1%) |
| 35 to 44 Years | 295 (94.6%) | 17 (5.4%) |
| 45 to 54 Years | 102 (53.7%) | 88 (46.3%) |
| 55 to 64 Years | 206 (78.3%) | 57 (21.7%) |
| 65 to 74 Years | 250 (100.0%) | 0 (0.0%) |
| 75 Years and older | 91 (100.0%) | 0 (0.0%) |
| Total | 1,736 (86.6%) | 269 (13.4%) |
Health Insurance Coverage by Citizenship Status in Wanchese
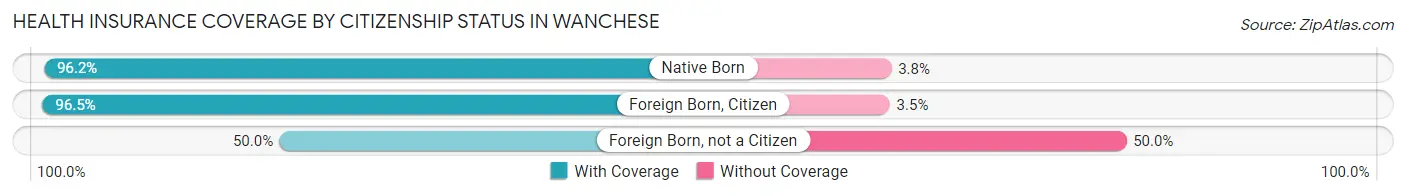
| Citizenship Status | With Coverage | Without Coverage |
| Native Born | 227 (96.2%) | 9 (3.8%) |
| Foreign Born, Citizen | 330 (96.5%) | 12 (3.5%) |
| Foreign Born, not a Citizen | 36 (50.0%) | 36 (50.0%) |
Health Insurance Coverage by Household Income in Wanchese
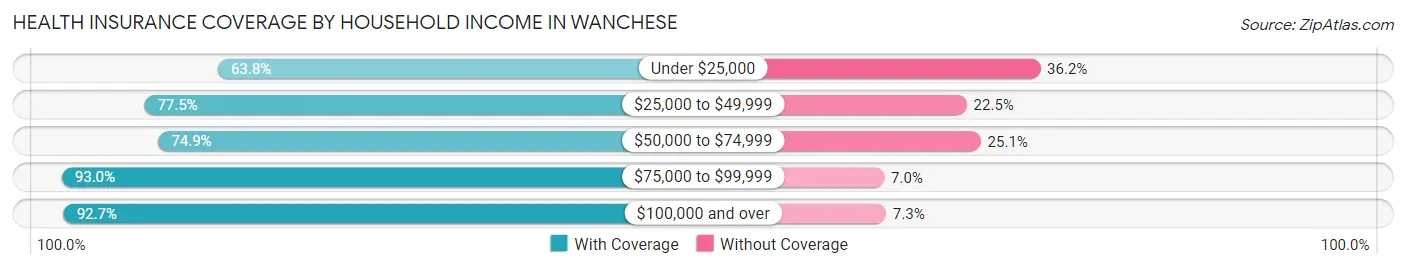
| Household Income | With Coverage | Without Coverage |
| Under $25,000 | 44 (63.8%) | 25 (36.2%) |
| $25,000 to $49,999 | 259 (77.5%) | 75 (22.5%) |
| $50,000 to $74,999 | 227 (74.9%) | 76 (25.1%) |
| $75,000 to $99,999 | 599 (93.0%) | 45 (7.0%) |
| $100,000 and over | 607 (92.7%) | 48 (7.3%) |
Public vs Private Health Insurance Coverage by Age in Wanchese
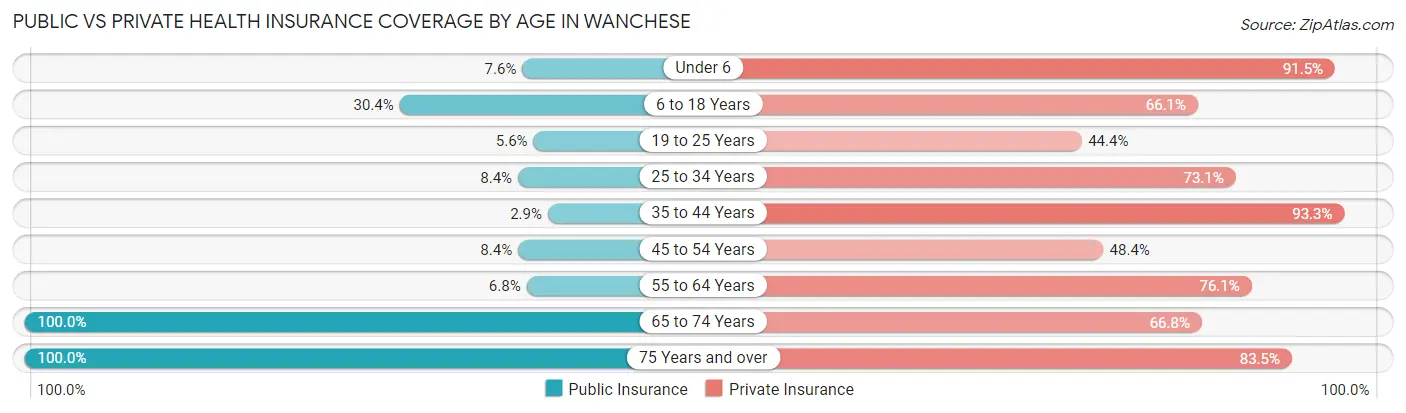
| Age Bracket | Public Insurance | Private Insurance |
| Under 6 | 18 (7.6%) | 216 (91.5%) |
| 6 to 18 Years | 104 (30.4%) | 226 (66.1%) |
| 19 to 25 Years | 4 (5.6%) | 32 (44.4%) |
| 25 to 34 Years | 21 (8.4%) | 182 (73.1%) |
| 35 to 44 Years | 9 (2.9%) | 291 (93.3%) |
| 45 to 54 Years | 16 (8.4%) | 92 (48.4%) |
| 55 to 64 Years | 18 (6.8%) | 200 (76.0%) |
| 65 to 74 Years | 250 (100.0%) | 167 (66.8%) |
| 75 Years and over | 91 (100.0%) | 76 (83.5%) |
| Total | 531 (26.5%) | 1,482 (73.9%) |
Disability Status by Sex by Age in Wanchese
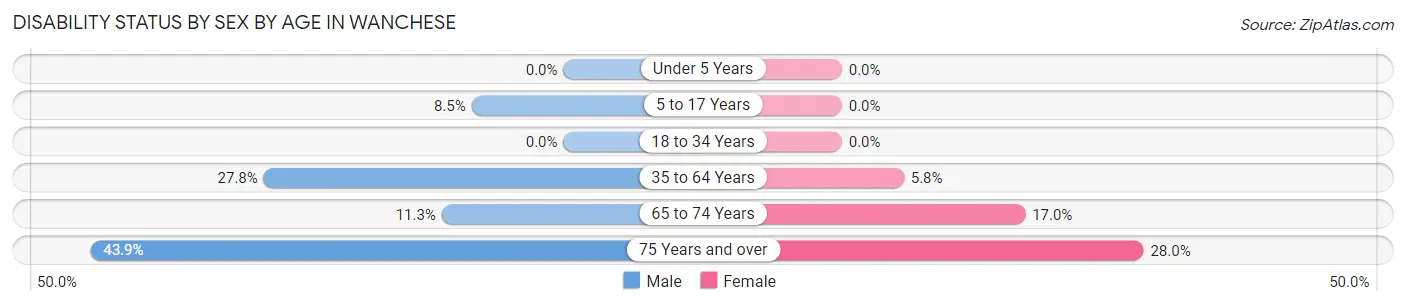
| Age Bracket | Male | Female |
| Under 5 Years | 0 (0.0%) | 0 (0.0%) |
| 5 to 17 Years | 19 (8.5%) | 0 (0.0%) |
| 18 to 34 Years | 0 (0.0%) | 0 (0.0%) |
| 35 to 64 Years | 116 (27.8%) | 20 (5.8%) |
| 65 to 74 Years | 7 (11.3%) | 32 (17.0%) |
| 75 Years and over | 18 (43.9%) | 14 (28.0%) |
Disability Class by Sex by Age in Wanchese
Disability Class: Hearing Difficulty
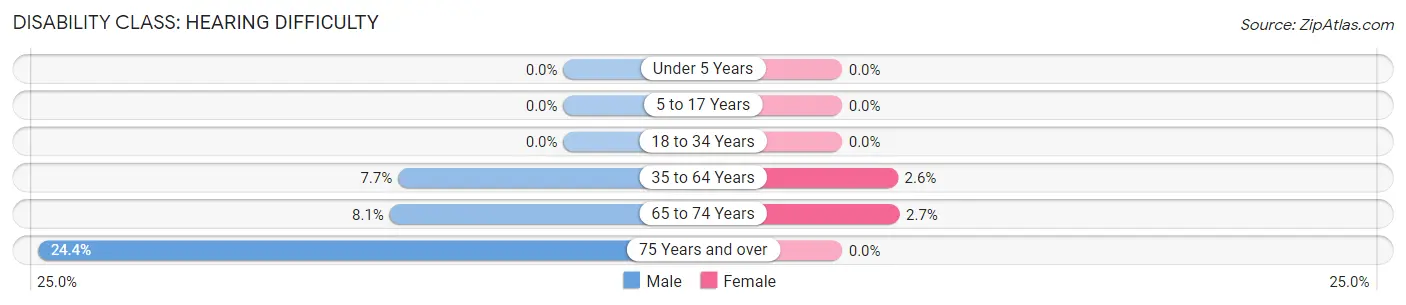
| Age Bracket | Male | Female |
| Under 5 Years | 0 (0.0%) | 0 (0.0%) |
| 5 to 17 Years | 0 (0.0%) | 0 (0.0%) |
| 18 to 34 Years | 0 (0.0%) | 0 (0.0%) |
| 35 to 64 Years | 32 (7.7%) | 9 (2.6%) |
| 65 to 74 Years | 5 (8.1%) | 5 (2.7%) |
| 75 Years and over | 10 (24.4%) | 0 (0.0%) |
Disability Class: Vision Difficulty
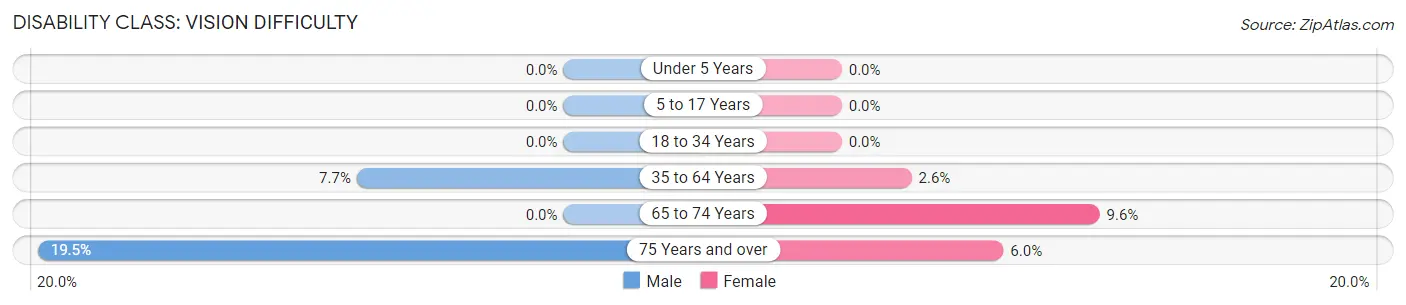
| Age Bracket | Male | Female |
| Under 5 Years | 0 (0.0%) | 0 (0.0%) |
| 5 to 17 Years | 0 (0.0%) | 0 (0.0%) |
| 18 to 34 Years | 0 (0.0%) | 0 (0.0%) |
| 35 to 64 Years | 32 (7.7%) | 9 (2.6%) |
| 65 to 74 Years | 0 (0.0%) | 18 (9.6%) |
| 75 Years and over | 8 (19.5%) | 3 (6.0%) |
Disability Class: Cognitive Difficulty
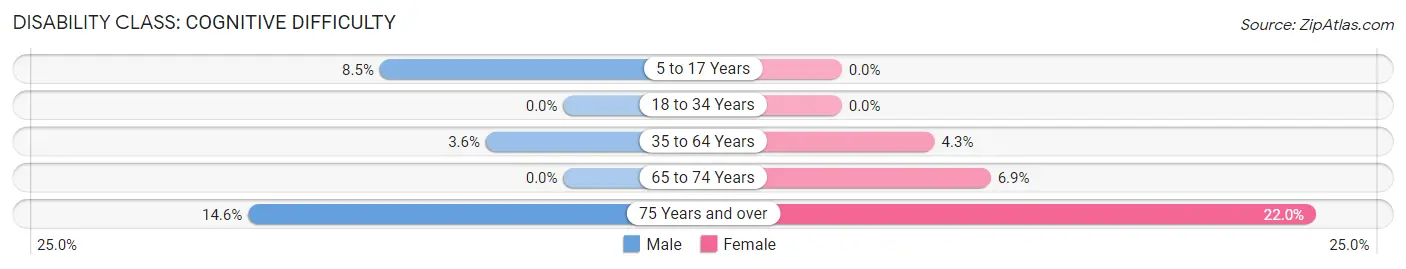
| Age Bracket | Male | Female |
| 5 to 17 Years | 19 (8.5%) | 0 (0.0%) |
| 18 to 34 Years | 0 (0.0%) | 0 (0.0%) |
| 35 to 64 Years | 15 (3.6%) | 15 (4.3%) |
| 65 to 74 Years | 0 (0.0%) | 13 (6.9%) |
| 75 Years and over | 6 (14.6%) | 11 (22.0%) |
Disability Class: Ambulatory Difficulty
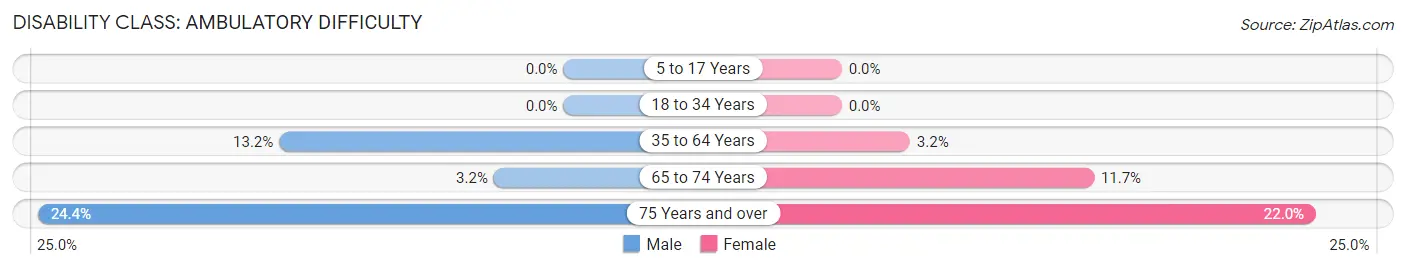
| Age Bracket | Male | Female |
| 5 to 17 Years | 0 (0.0%) | 0 (0.0%) |
| 18 to 34 Years | 0 (0.0%) | 0 (0.0%) |
| 35 to 64 Years | 55 (13.2%) | 11 (3.2%) |
| 65 to 74 Years | 2 (3.2%) | 22 (11.7%) |
| 75 Years and over | 10 (24.4%) | 11 (22.0%) |
Disability Class: Self-Care Difficulty
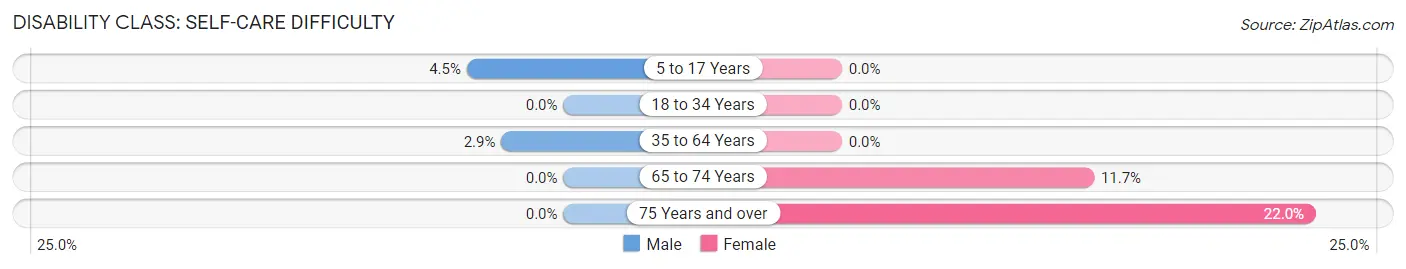
| Age Bracket | Male | Female |
| 5 to 17 Years | 10 (4.5%) | 0 (0.0%) |
| 18 to 34 Years | 0 (0.0%) | 0 (0.0%) |
| 35 to 64 Years | 12 (2.9%) | 0 (0.0%) |
| 65 to 74 Years | 0 (0.0%) | 22 (11.7%) |
| 75 Years and over | 0 (0.0%) | 11 (22.0%) |
Technology Access in Wanchese
Computing Device Access in Wanchese
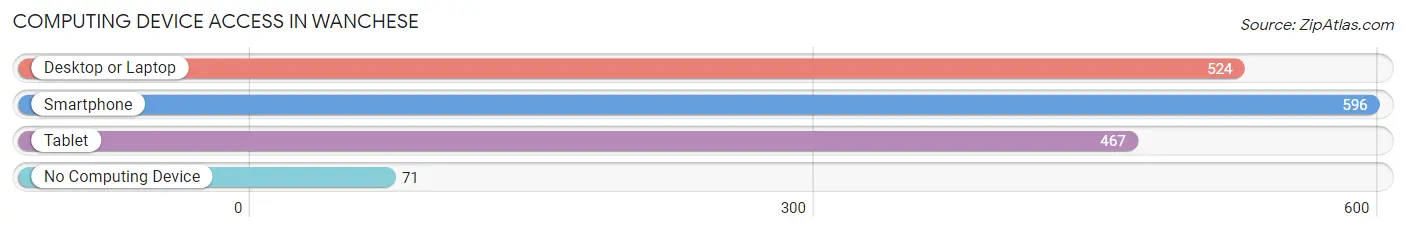
| Device Type | # Households | % Households |
| Desktop or Laptop | 524 | 72.5% |
| Smartphone | 596 | 82.4% |
| Tablet | 467 | 64.6% |
| No Computing Device | 71 | 9.8% |
| Total | 723 | 100.0% |
Internet Access in Wanchese
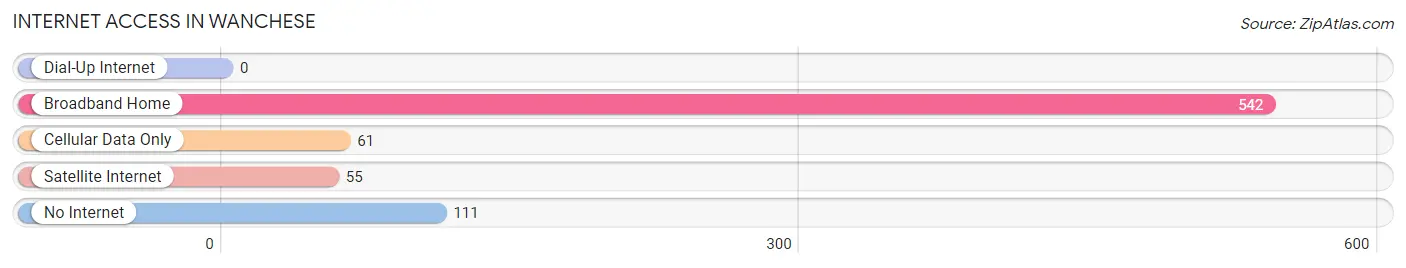
| Internet Type | # Households | % Households |
| Dial-Up Internet | 0 | 0.0% |
| Broadband Home | 542 | 75.0% |
| Cellular Data Only | 61 | 8.4% |
| Satellite Internet | 55 | 7.6% |
| No Internet | 111 | 15.3% |
| Total | 723 | 100.0% |
Wanchese Summary
Wanchese is a small fishing village located on Roanoke Island in Dare County, North Carolina. It is situated on the eastern side of the island, just south of the town of Manteo. The village is home to a population of approximately 500 people, most of whom are of Native American descent.
Geography
Wanchese is located on the eastern side of Roanoke Island, which is part of the Outer Banks of North Carolina. The village is situated on the south side of the island, just south of the town of Manteo. The village is surrounded by the Croatan Sound to the east, the Roanoke Sound to the south, and the Pamlico Sound to the west. The village is located approximately 10 miles from the mainland of North Carolina.
The village is situated on a small peninsula, which is bordered by the Croatan Sound to the east and the Roanoke Sound to the south. The peninsula is approximately 1.5 miles long and 0.5 miles wide. The terrain of the peninsula is mostly flat, with some areas of marshland.
History
The area that is now Wanchese has been inhabited by Native Americans for thousands of years. The village was first settled by Europeans in the late 1600s, when English settlers arrived on Roanoke Island. The village was originally known as “Wanchese Town”, and was home to a small population of Native Americans.
In the late 1700s, the village was renamed “Wanchese”, and the population began to grow. The village was home to a number of fishing families, and the local economy was largely based on fishing and boatbuilding. In the late 1800s, the village was home to a number of fish houses, which processed and shipped fish to markets in the mainland.
In the early 1900s, the village began to decline as the fishing industry moved away from the area. The village was largely abandoned by the mid-1900s, and the population dwindled to just a few hundred people. In the late 1900s, the village began to experience a resurgence, as new businesses and residents moved to the area.
Economy
The economy of Wanchese is largely based on fishing and tourism. The village is home to a number of fishing boats, which are used to catch a variety of fish, including flounder, sea bass, and bluefish. The fish are then sold to local markets and restaurants.
The village is also home to a number of tourist attractions, including the Roanoke Island Festival Park, the Elizabethan Gardens, and the North Carolina Aquarium. These attractions draw visitors from all over the world, and help to support the local economy.
Demographics
As of the 2010 census, the population of Wanchese was 498. The racial makeup of the village was 94.4% White, 2.2% African American, 0.6% Native American, 0.2% Asian, 0.2% Pacific Islander, and 2.4% from other races. The median household income was $37,500, and the median age was 44.
Conclusion
Wanchese is a small fishing village located on Roanoke Island in Dare County, North Carolina. The village is home to a population of approximately 500 people, most of whom are of Native American descent. The economy of the village is largely based on fishing and tourism, and the village is home to a number of tourist attractions. The population of the village is diverse, with a mix of races and ethnicities.
Common Questions
What is Per Capita Income in Wanchese?
Per Capita income in Wanchese is $34,049.
What is the Median Family Income in Wanchese?
Median Family Income in Wanchese is $78,661.
What is the Median Household income in Wanchese?
Median Household Income in Wanchese is $71,484.
What is Income or Wage Gap in Wanchese?
Income or Wage Gap in Wanchese is 19.8%.
Women in Wanchese earn 80.2 cents for every dollar earned by a man.
What is Family Income Deficit in Wanchese?
Family Income Deficit in Wanchese is $4,743.
Families that are below poverty line in Wanchese earn $4,743 less on average than the poverty threshold level.
What is Inequality or Gini Index in Wanchese?
Inequality or Gini Index in Wanchese is 0.41.
What is the Total Population of Wanchese?
Total Population of Wanchese is 2,005.
What is the Total Male Population of Wanchese?
Total Male Population of Wanchese is 989.
What is the Total Female Population of Wanchese?
Total Female Population of Wanchese is 1,016.
What is the Ratio of Males per 100 Females in Wanchese?
There are 97.34 Males per 100 Females in Wanchese.
What is the Ratio of Females per 100 Males in Wanchese?
There are 102.73 Females per 100 Males in Wanchese.
What is the Median Population Age in Wanchese?
Median Population Age in Wanchese is 37.6 Years.
What is the Average Family Size in Wanchese
Average Family Size in Wanchese is 3.1 People.
What is the Average Household Size in Wanchese
Average Household Size in Wanchese is 2.8 People.
How Large is the Labor Force in Wanchese?
There are 1,097 People in the Labor Forcein in Wanchese.
What is the Percentage of People in the Labor Force in Wanchese?
75.2% of People are in the Labor Force in Wanchese.
What is the Unemployment Rate in Wanchese?
Unemployment Rate in Wanchese is 0.8%.