Lillington, NC Map & Demographics
Lillington Map
Lillington Overview
$21,194
PER CAPITA INCOME
$65,625
AVG FAMILY INCOME
$57,774
AVG HOUSEHOLD INCOME
7.9%
WAGE / INCOME GAP [ % ]
92.1¢/ $1
WAGE / INCOME GAP [ $ ]
0.38
INEQUALITY / GINI INDEX
4,566
TOTAL POPULATION
2,643
MALE POPULATION
1,923
FEMALE POPULATION
137.44
MALES / 100 FEMALES
72.76
FEMALES / 100 MALES
37.3
MEDIAN AGE
3.4
AVG FAMILY SIZE
2.7
AVG HOUSEHOLD SIZE
1,751
LABOR FORCE [ PEOPLE ]
46.7%
PERCENT IN LABOR FORCE
0.8%
UNEMPLOYMENT RATE
Lillington Zip Codes
Lillington Area Codes
Income in Lillington
Income Overview in Lillington
Per Capita Income in Lillington is $21,194, while median incomes of families and households are $65,625 and $57,774 respectively.
| Characteristic | Number | Measure |
| Per Capita Income | 4,566 | $21,194 |
| Median Family Income | 825 | $65,625 |
| Mean Family Income | 825 | $76,742 |
| Median Household Income | 1,251 | $57,774 |
| Mean Household Income | 1,251 | $66,501 |
| Income Deficit | 825 | $0 |
| Wage / Income Gap (%) | 4,566 | 7.90% |
| Wage / Income Gap ($) | 4,566 | 92.10¢ per $1 |
| Gini / Inequality Index | 4,566 | 0.38 |
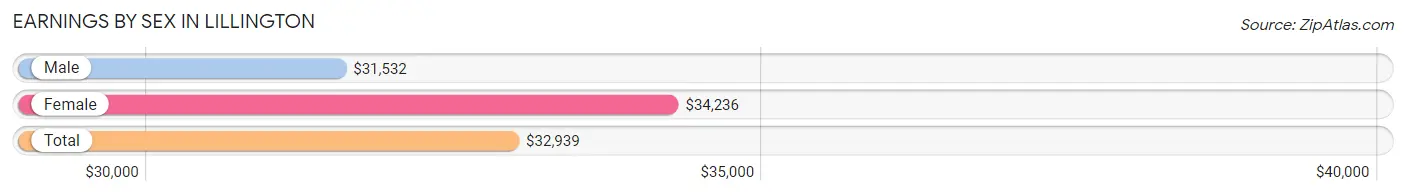
Earnings by Sex in Lillington
Average Earnings in Lillington are $32,939, $31,532 for men and $34,236 for women, a difference of 7.9%.
| Sex | Number | Average Earnings |
| Male | 1,331 (61.3%) | $31,532 |
| Female | 840 (38.7%) | $34,236 |
| Total | 2,171 (100.0%) | $32,939 |
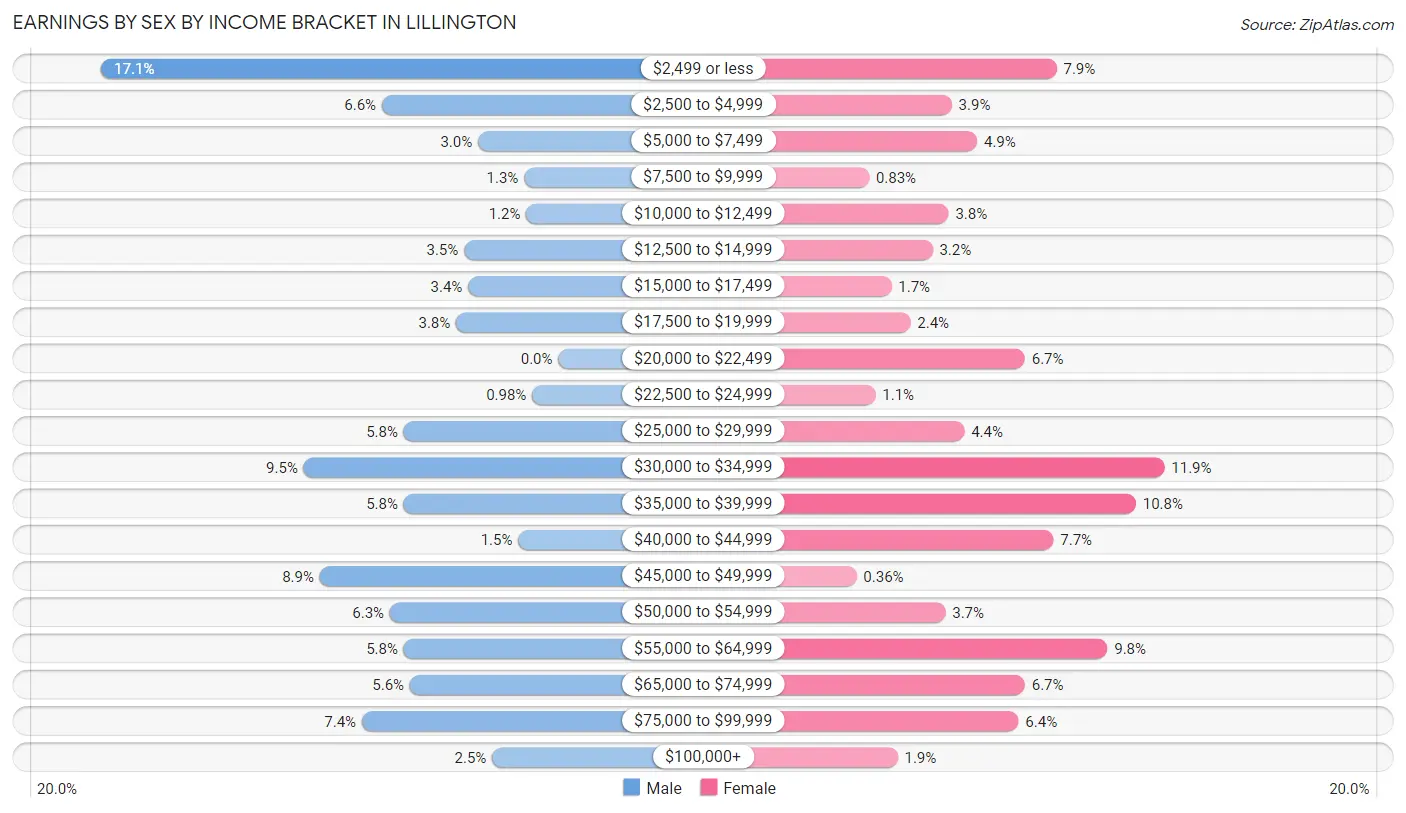
Earnings by Sex by Income Bracket in Lillington
The most common earnings brackets in Lillington are $2,499 or less for men (228 | 17.1%) and $30,000 to $34,999 for women (100 | 11.9%).
| Income | Male | Female |
| $2,499 or less | 228 (17.1%) | 66 (7.9%) |
| $2,500 to $4,999 | 88 (6.6%) | 33 (3.9%) |
| $5,000 to $7,499 | 40 (3.0%) | 41 (4.9%) |
| $7,500 to $9,999 | 17 (1.3%) | 7 (0.8%) |
| $10,000 to $12,499 | 16 (1.2%) | 32 (3.8%) |
| $12,500 to $14,999 | 47 (3.5%) | 27 (3.2%) |
| $15,000 to $17,499 | 45 (3.4%) | 14 (1.7%) |
| $17,500 to $19,999 | 51 (3.8%) | 20 (2.4%) |
| $20,000 to $22,499 | 0 (0.0%) | 56 (6.7%) |
| $22,500 to $24,999 | 13 (1.0%) | 9 (1.1%) |
| $25,000 to $29,999 | 77 (5.8%) | 37 (4.4%) |
| $30,000 to $34,999 | 127 (9.5%) | 100 (11.9%) |
| $35,000 to $39,999 | 77 (5.8%) | 91 (10.8%) |
| $40,000 to $44,999 | 20 (1.5%) | 65 (7.7%) |
| $45,000 to $49,999 | 119 (8.9%) | 3 (0.4%) |
| $50,000 to $54,999 | 84 (6.3%) | 31 (3.7%) |
| $55,000 to $64,999 | 77 (5.8%) | 82 (9.8%) |
| $65,000 to $74,999 | 74 (5.6%) | 56 (6.7%) |
| $75,000 to $99,999 | 98 (7.4%) | 54 (6.4%) |
| $100,000+ | 33 (2.5%) | 16 (1.9%) |
| Total | 1,331 (100.0%) | 840 (100.0%) |
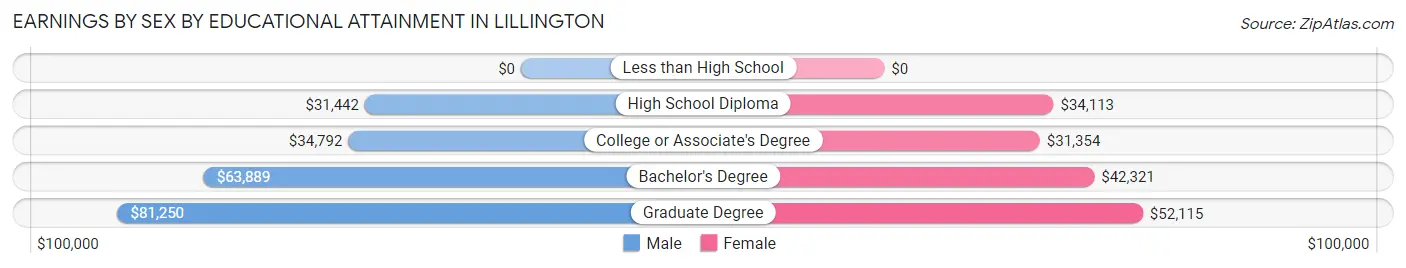
Earnings by Sex by Educational Attainment in Lillington
Average earnings in Lillington are $31,956 for men and $34,981 for women, a difference of 8.6%. Men with an educational attainment of graduate degree enjoy the highest average annual earnings of $81,250, while those with high school diploma education earn the least with $31,442. Women with an educational attainment of graduate degree earn the most with the average annual earnings of $52,115, while those with college or associate's degree education have the smallest earnings of $31,354.
| Educational Attainment | Male Income | Female Income |
| Less than High School | - | - |
| High School Diploma | $31,442 | $34,113 |
| College or Associate's Degree | $34,792 | $31,354 |
| Bachelor's Degree | $63,889 | $42,321 |
| Graduate Degree | $81,250 | $52,115 |
| Total | $31,956 | $34,981 |
Family Income in Lillington
Family Income Brackets in Lillington
According to the Lillington family income data, there are 207 families falling into the $50,000 to $74,999 income range, which is the most common income bracket and makes up 25.1% of all families. Conversely, the $15,000 to $24,999 income bracket is the least frequent group with only 5 families (0.6%) belonging to this category.
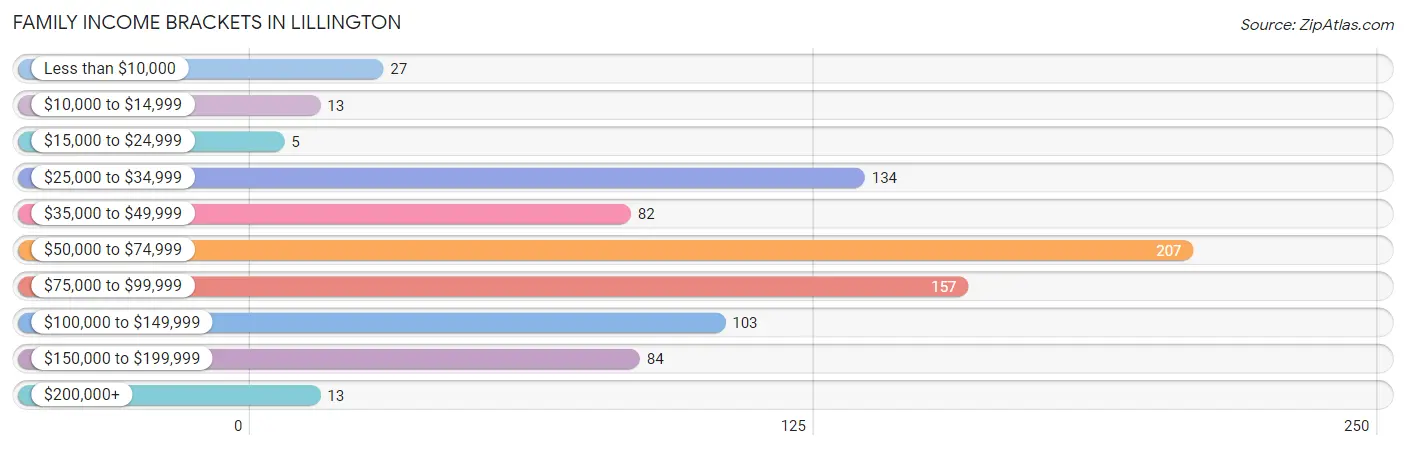
| Income Bracket | # Families | % Families |
| Less than $10,000 | 27 | 3.3% |
| $10,000 to $14,999 | 13 | 1.6% |
| $15,000 to $24,999 | 5 | 0.6% |
| $25,000 to $34,999 | 134 | 16.2% |
| $35,000 to $49,999 | 82 | 9.9% |
| $50,000 to $74,999 | 207 | 25.1% |
| $75,000 to $99,999 | 157 | 19.0% |
| $100,000 to $149,999 | 103 | 12.5% |
| $150,000 to $199,999 | 84 | 10.2% |
| $200,000+ | 13 | 1.6% |
Family Income by Famaliy Size in Lillington
5-person families (58 | 7.0%) account for the highest median family income in Lillington with $87,083 per family, while 2-person families (307 | 37.2%) have the highest median income of $24,806 per family member.
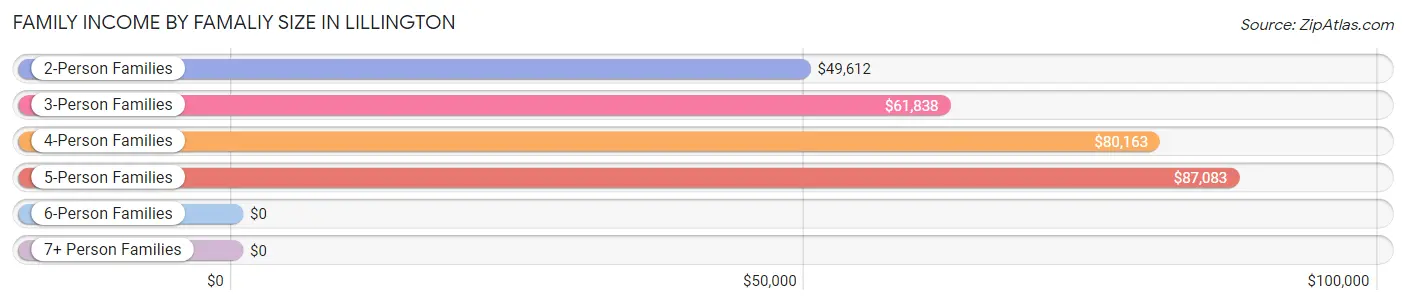
| Income Bracket | # Families | Median Income |
| 2-Person Families | 307 (37.2%) | $49,612 |
| 3-Person Families | 277 (33.6%) | $61,838 |
| 4-Person Families | 158 (19.2%) | $80,163 |
| 5-Person Families | 58 (7.0%) | $87,083 |
| 6-Person Families | 18 (2.2%) | $0 |
| 7+ Person Families | 7 (0.9%) | $0 |
| Total | 825 (100.0%) | $65,625 |
Family Income by Number of Earners in Lillington
The median family income in Lillington is $65,625, with families comprising 2 earners (328) having the highest median family income of $94,286, while families with no earners (80) have the lowest median family income of $31,250, accounting for 39.8% and 9.7% of families, respectively.
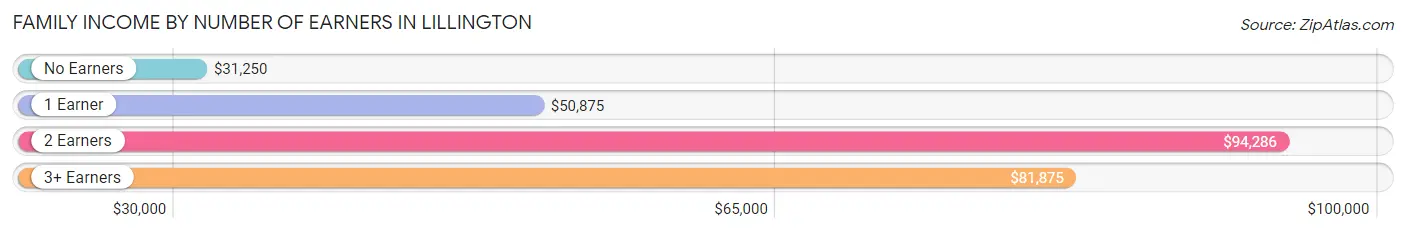
| Number of Earners | # Families | Median Income |
| No Earners | 80 (9.7%) | $31,250 |
| 1 Earner | 339 (41.1%) | $50,875 |
| 2 Earners | 328 (39.8%) | $94,286 |
| 3+ Earners | 78 (9.5%) | $81,875 |
| Total | 825 (100.0%) | $65,625 |
Household Income in Lillington
Household Income Brackets in Lillington
With 290 households falling in the category, the $50,000 to $74,999 income range is the most frequent in Lillington, accounting for 23.2% of all households. In contrast, only 20 households (1.6%) fall into the $200,000+ income bracket, making it the least populous group.
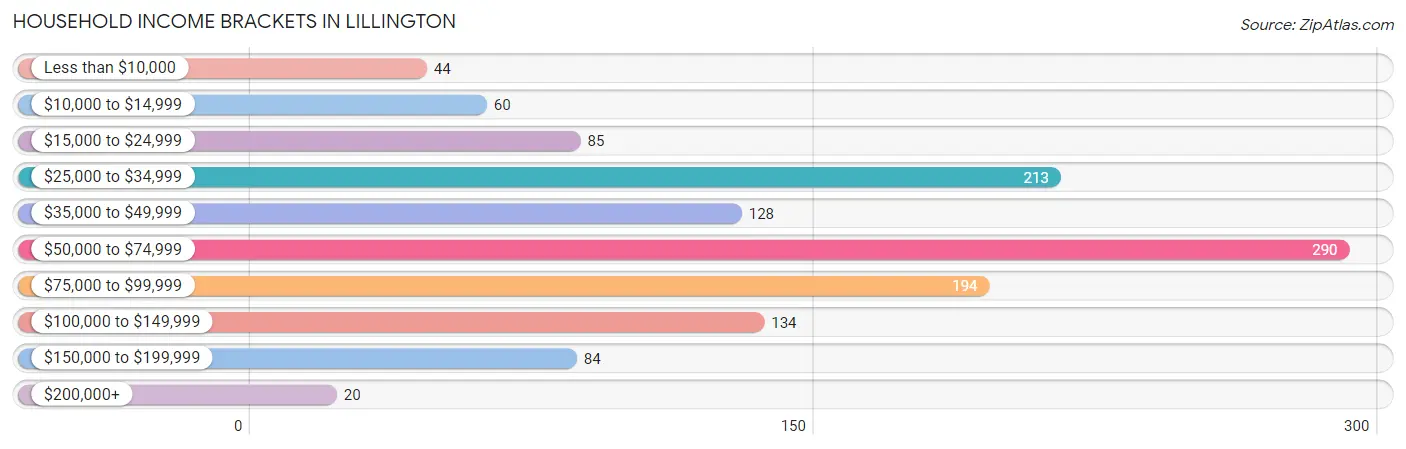
| Income Bracket | # Households | % Households |
| Less than $10,000 | 44 | 3.5% |
| $10,000 to $14,999 | 60 | 4.8% |
| $15,000 to $24,999 | 85 | 6.8% |
| $25,000 to $34,999 | 213 | 17.0% |
| $35,000 to $49,999 | 128 | 10.2% |
| $50,000 to $74,999 | 290 | 23.2% |
| $75,000 to $99,999 | 194 | 15.5% |
| $100,000 to $149,999 | 134 | 10.7% |
| $150,000 to $199,999 | 84 | 6.7% |
| $200,000+ | 20 | 1.6% |
Household Income by Householder Age in Lillington
The median household income in Lillington is $57,774, with the highest median household income of $72,434 found in the 25 to 44 years age bracket for the primary householder. A total of 549 households (43.9%) fall into this category. Meanwhile, the 15 to 24 years age bracket for the primary householder has the lowest median household income of $32,708, with 75 households (6.0%) in this group.
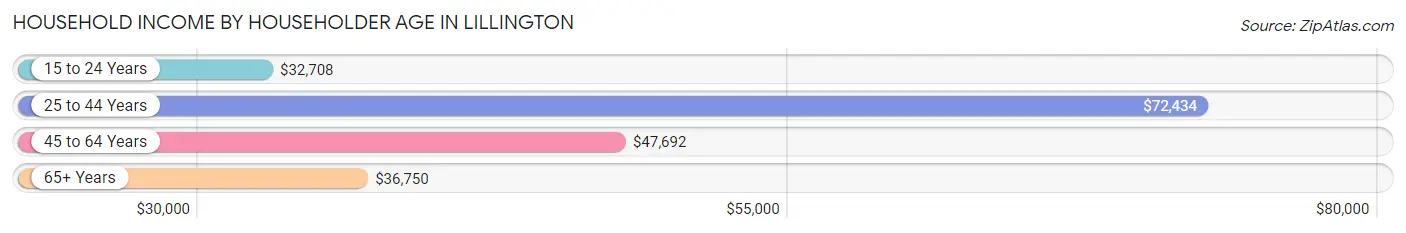
| Income Bracket | # Households | Median Income |
| 15 to 24 Years | 75 (6.0%) | $32,708 |
| 25 to 44 Years | 549 (43.9%) | $72,434 |
| 45 to 64 Years | 352 (28.1%) | $47,692 |
| 65+ Years | 275 (22.0%) | $36,750 |
| Total | 1,251 (100.0%) | $57,774 |
Poverty in Lillington
Income Below Poverty by Sex and Age in Lillington
With 8.2% poverty level for males and 6.2% for females among the residents of Lillington, 45 to 54 year old males and 12 to 14 year old females are the most vulnerable to poverty, with 41 males (31.5%) and 15 females (22.4%) in their respective age groups living below the poverty level.
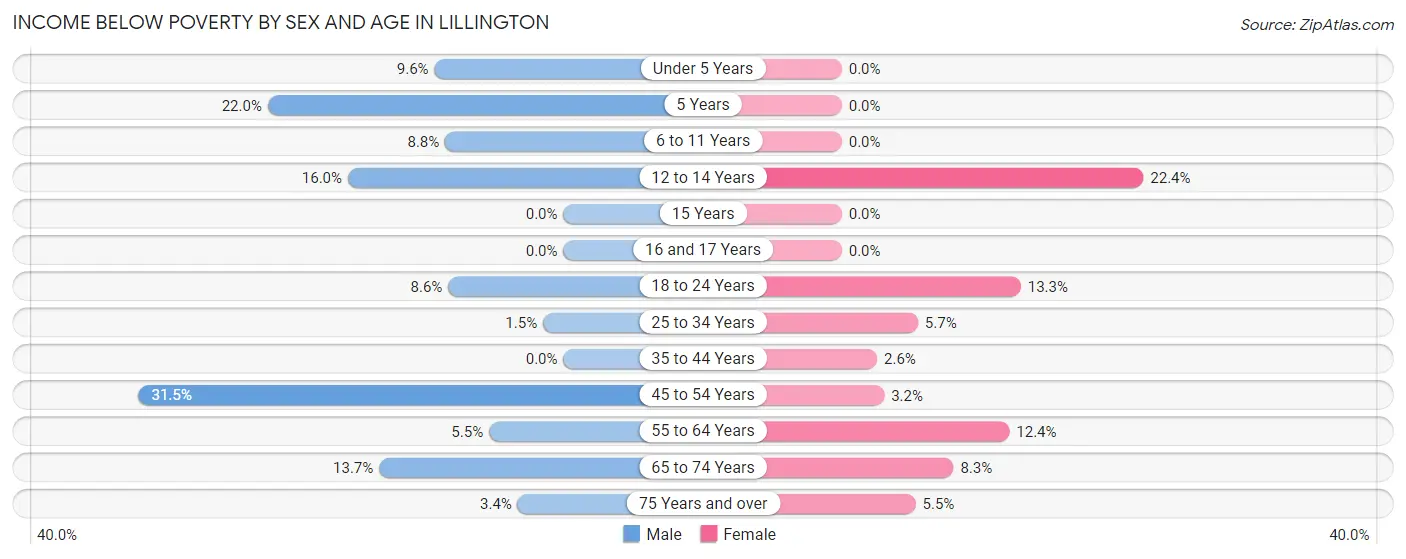
| Age Bracket | Male | Female |
| Under 5 Years | 11 (9.6%) | 0 (0.0%) |
| 5 Years | 9 (22.0%) | 0 (0.0%) |
| 6 to 11 Years | 13 (8.8%) | 0 (0.0%) |
| 12 to 14 Years | 12 (16.0%) | 15 (22.4%) |
| 15 Years | 0 (0.0%) | 0 (0.0%) |
| 16 and 17 Years | 0 (0.0%) | 0 (0.0%) |
| 18 to 24 Years | 20 (8.6%) | 21 (13.3%) |
| 25 to 34 Years | 5 (1.5%) | 19 (5.7%) |
| 35 to 44 Years | 0 (0.0%) | 6 (2.6%) |
| 45 to 54 Years | 41 (31.5%) | 4 (3.2%) |
| 55 to 64 Years | 8 (5.5%) | 25 (12.4%) |
| 65 to 74 Years | 13 (13.7%) | 15 (8.3%) |
| 75 Years and over | 2 (3.4%) | 4 (5.5%) |
| Total | 134 (8.2%) | 109 (6.2%) |
Income Above Poverty by Sex and Age in Lillington
According to the poverty statistics in Lillington, males aged 15 years and females aged under 5 years are the age groups that are most secure financially, with 100.0% of males and 100.0% of females in these age groups living above the poverty line.
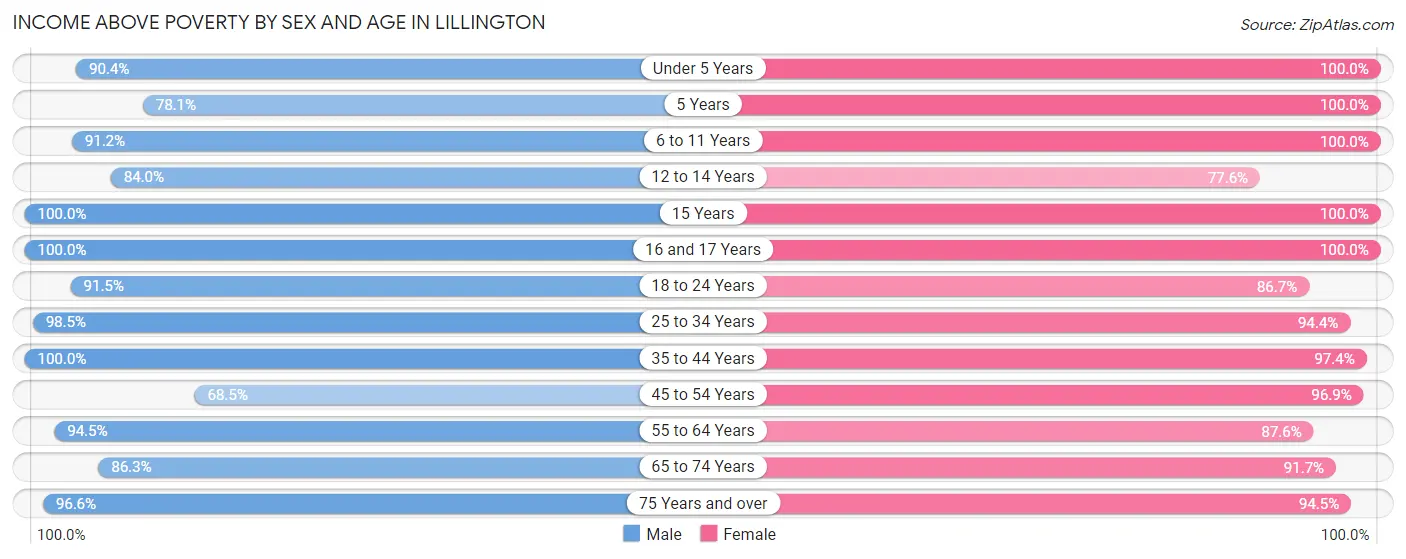
| Age Bracket | Male | Female |
| Under 5 Years | 104 (90.4%) | 138 (100.0%) |
| 5 Years | 32 (78.0%) | 55 (100.0%) |
| 6 to 11 Years | 135 (91.2%) | 143 (100.0%) |
| 12 to 14 Years | 63 (84.0%) | 52 (77.6%) |
| 15 Years | 3 (100.0%) | 32 (100.0%) |
| 16 and 17 Years | 27 (100.0%) | 13 (100.0%) |
| 18 to 24 Years | 214 (91.4%) | 137 (86.7%) |
| 25 to 34 Years | 327 (98.5%) | 317 (94.4%) |
| 35 to 44 Years | 226 (100.0%) | 223 (97.4%) |
| 45 to 54 Years | 89 (68.5%) | 123 (96.9%) |
| 55 to 64 Years | 137 (94.5%) | 176 (87.6%) |
| 65 to 74 Years | 82 (86.3%) | 166 (91.7%) |
| 75 Years and over | 57 (96.6%) | 69 (94.5%) |
| Total | 1,496 (91.8%) | 1,644 (93.8%) |
Income Below Poverty Among Married-Couple Families in Lillington
The poverty statistics for married-couple families in Lillington show that 3.5% or 18 of the total 518 families live below the poverty line. Families with no children have the highest poverty rate of 5.9%, comprising of 13 families. On the other hand, families with 3 or 4 children have the lowest poverty rate of 0.0%, which includes 0 families.
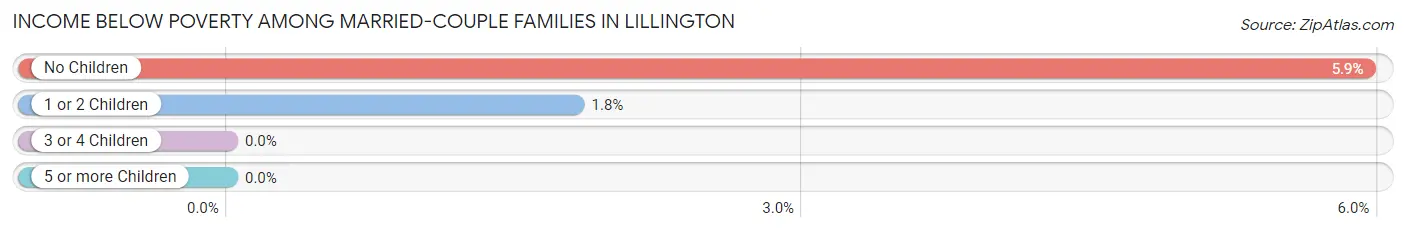
| Children | Above Poverty | Below Poverty |
| No Children | 206 (94.1%) | 13 (5.9%) |
| 1 or 2 Children | 272 (98.2%) | 5 (1.8%) |
| 3 or 4 Children | 22 (100.0%) | 0 (0.0%) |
| 5 or more Children | 0 (0.0%) | 0 (0.0%) |
| Total | 500 (96.5%) | 18 (3.5%) |
Income Below Poverty Among Single-Parent Households in Lillington
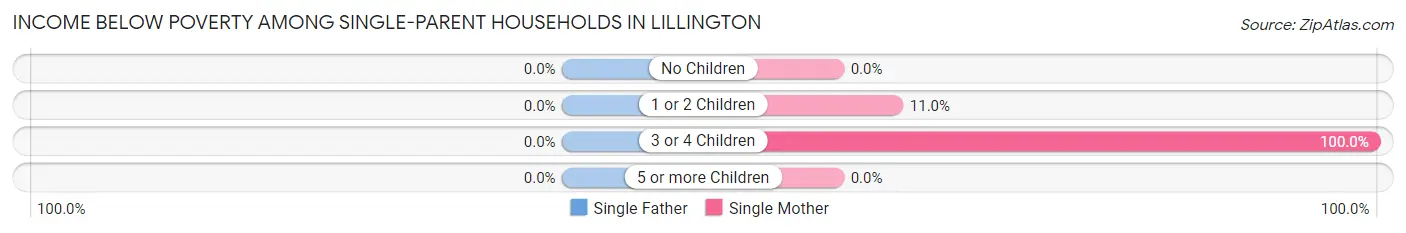
| Children | Single Father | Single Mother |
| No Children | 0 (0.0%) | 0 (0.0%) |
| 1 or 2 Children | 0 (0.0%) | 13 (11.0%) |
| 3 or 4 Children | 0 (0.0%) | 14 (100.0%) |
| 5 or more Children | 0 (0.0%) | 0 (0.0%) |
| Total | 0 (0.0%) | 27 (12.2%) |
Income Below Poverty Among Married-Couple vs Single-Parent Households in Lillington
The poverty data for Lillington shows that 18 of the married-couple family households (3.5%) and 27 of the single-parent households (8.8%) are living below the poverty level. Within the married-couple family households, those with no children have the highest poverty rate, with 13 households (5.9%) falling below the poverty line. Among the single-parent households, those with 3 or 4 children have the highest poverty rate, with 14 household (100.0%) living below poverty.
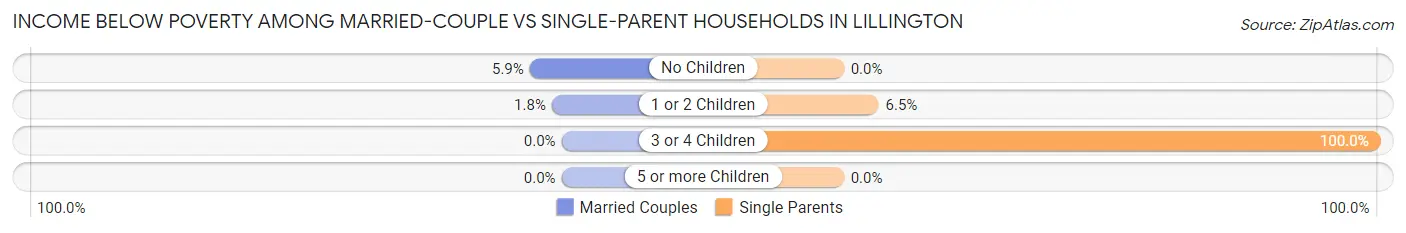
| Children | Married-Couple Families | Single-Parent Households |
| No Children | 13 (5.9%) | 0 (0.0%) |
| 1 or 2 Children | 5 (1.8%) | 13 (6.5%) |
| 3 or 4 Children | 0 (0.0%) | 14 (100.0%) |
| 5 or more Children | 0 (0.0%) | 0 (0.0%) |
| Total | 18 (3.5%) | 27 (8.8%) |
Race in Lillington
The most populous races in Lillington are White / Caucasian (2,420 | 53.0%), Black / African American (1,352 | 29.6%), and Hispanic or Latino (750 | 16.4%).
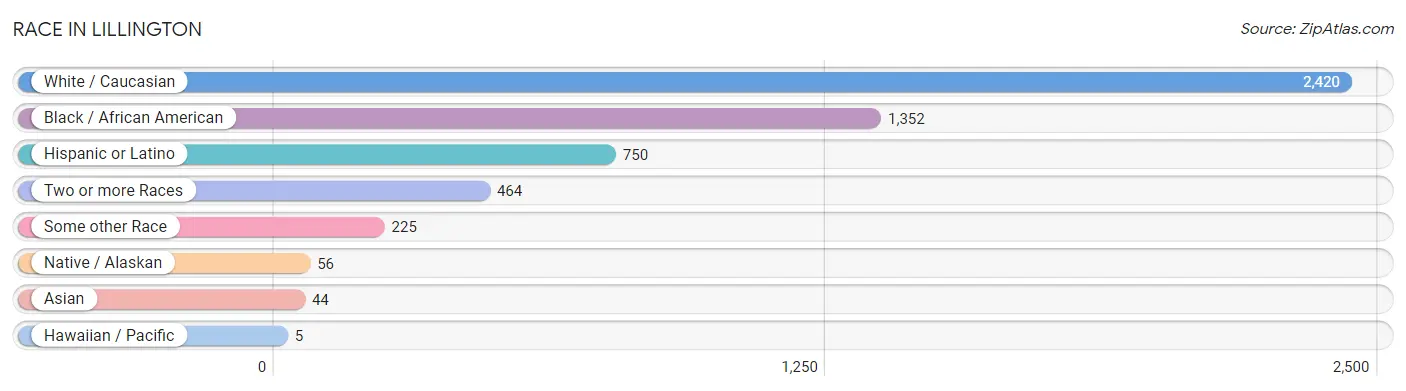
| Race | # Population | % Population |
| Asian | 44 | 1.0% |
| Black / African American | 1,352 | 29.6% |
| Hawaiian / Pacific | 5 | 0.1% |
| Hispanic or Latino | 750 | 16.4% |
| Native / Alaskan | 56 | 1.2% |
| White / Caucasian | 2,420 | 53.0% |
| Two or more Races | 464 | 10.2% |
| Some other Race | 225 | 4.9% |
| Total | 4,566 | 100.0% |
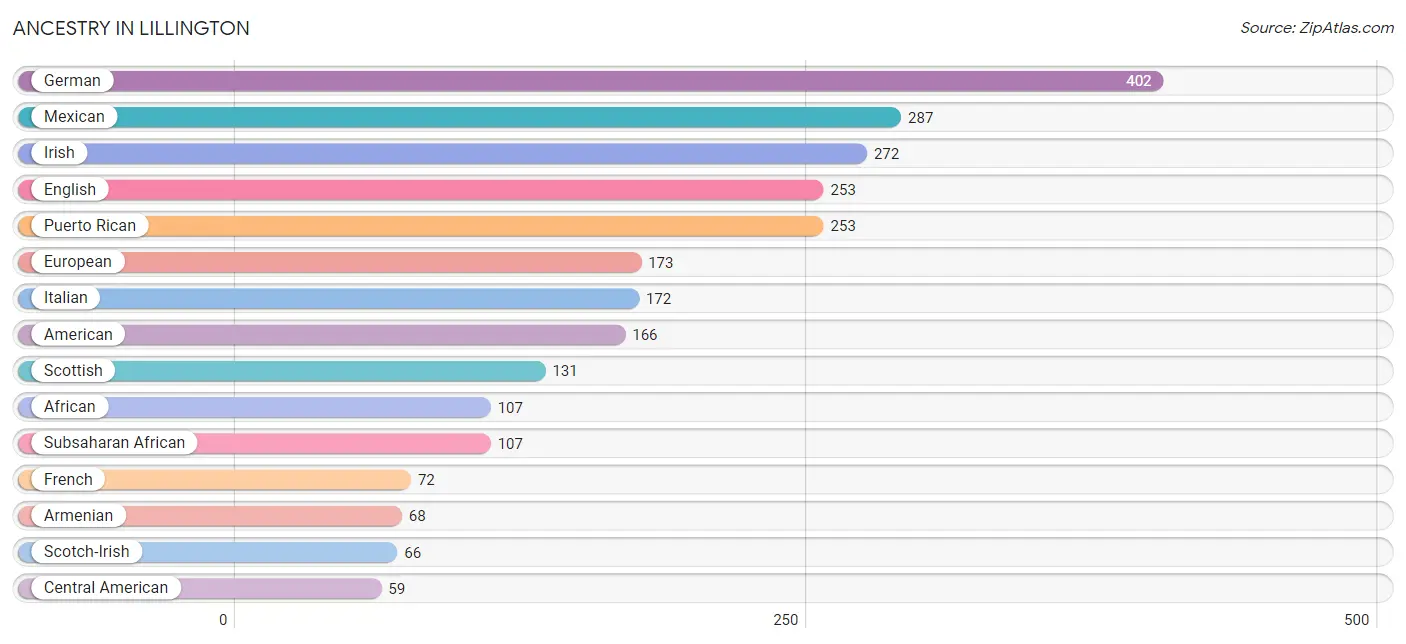
Ancestry in Lillington
The most populous ancestries reported in Lillington are German (402 | 8.8%), Mexican (287 | 6.3%), Irish (272 | 6.0%), English (253 | 5.5%), and Puerto Rican (253 | 5.5%), together accounting for 32.1% of all Lillington residents.
| Ancestry | # Population | % Population |
| African | 107 | 2.3% |
| American | 166 | 3.6% |
| Arab | 6 | 0.1% |
| Armenian | 68 | 1.5% |
| Australian | 2 | 0.0% |
| Austrian | 5 | 0.1% |
| Bermudan | 10 | 0.2% |
| Bhutanese | 2 | 0.0% |
| Blackfeet | 8 | 0.2% |
| British | 20 | 0.4% |
| Cajun | 2 | 0.0% |
| Central American | 59 | 1.3% |
| Central American Indian | 12 | 0.3% |
| Cherokee | 48 | 1.1% |
| Creek | 12 | 0.3% |
| Croatian | 8 | 0.2% |
| Cuban | 43 | 0.9% |
| Czech | 4 | 0.1% |
| Czechoslovakian | 3 | 0.1% |
| Dominican | 3 | 0.1% |
| Dutch | 4 | 0.1% |
| English | 253 | 5.5% |
| European | 173 | 3.8% |
| French | 72 | 1.6% |
| French Canadian | 19 | 0.4% |
| German | 402 | 8.8% |
| Guatemalan | 24 | 0.5% |
| Honduran | 12 | 0.3% |
| Hungarian | 3 | 0.1% |
| Indian (Asian) | 6 | 0.1% |
| Irish | 272 | 6.0% |
| Iroquois | 30 | 0.7% |
| Italian | 172 | 3.8% |
| Korean | 2 | 0.0% |
| Lumbee | 2 | 0.0% |
| Mexican | 287 | 6.3% |
| Mexican American Indian | 12 | 0.3% |
| Moroccan | 6 | 0.1% |
| Navajo | 25 | 0.5% |
| Nicaraguan | 9 | 0.2% |
| Norwegian | 13 | 0.3% |
| Polish | 17 | 0.4% |
| Puerto Rican | 253 | 5.5% |
| Russian | 8 | 0.2% |
| Salvadoran | 14 | 0.3% |
| Scandinavian | 32 | 0.7% |
| Scotch-Irish | 66 | 1.5% |
| Scottish | 131 | 2.9% |
| Sri Lankan | 38 | 0.8% |
| Subsaharan African | 107 | 2.3% |
| Welsh | 6 | 0.1% |
| West Indian | 32 | 0.7% |
| Yaqui | 4 | 0.1% | View All 53 Rows |
Immigrants in Lillington
The most numerous immigrant groups reported in Lillington came from Latin America (245 | 5.4%), Central America (204 | 4.5%), Mexico (193 | 4.2%), Asia (94 | 2.1%), and Caribbean (41 | 0.9%), together accounting for 17.0% of all Lillington residents.
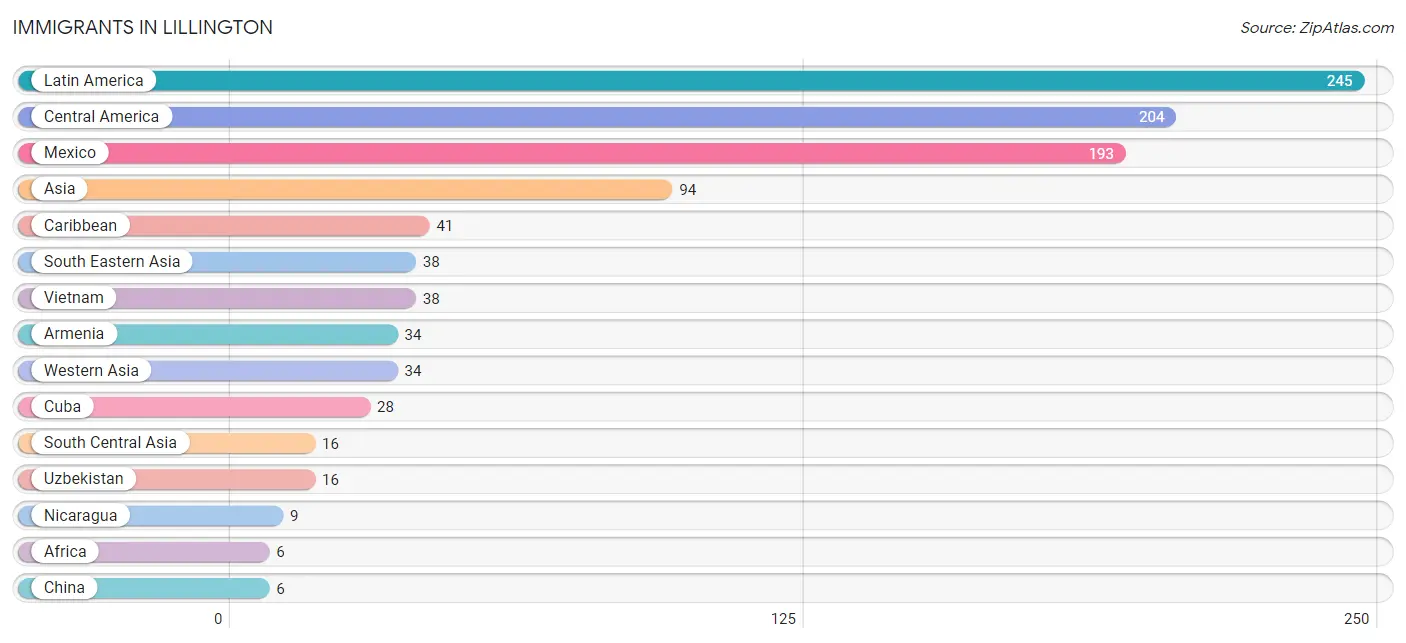
| Immigration Origin | # Population | % Population |
| Africa | 6 | 0.1% |
| Armenia | 34 | 0.7% |
| Asia | 94 | 2.1% |
| Canada | 5 | 0.1% |
| Caribbean | 41 | 0.9% |
| Central America | 204 | 4.5% |
| China | 6 | 0.1% |
| Cuba | 28 | 0.6% |
| Eastern Asia | 6 | 0.1% |
| Guatemala | 2 | 0.0% |
| Jamaica | 5 | 0.1% |
| Latin America | 245 | 5.4% |
| Mexico | 193 | 4.2% |
| Nicaragua | 9 | 0.2% |
| Sierra Leone | 6 | 0.1% |
| South Central Asia | 16 | 0.4% |
| South Eastern Asia | 38 | 0.8% |
| Trinidad and Tobago | 4 | 0.1% |
| Uzbekistan | 16 | 0.4% |
| Vietnam | 38 | 0.8% |
| Western Africa | 6 | 0.1% |
| Western Asia | 34 | 0.7% | View All 22 Rows |
Sex and Age in Lillington
Sex and Age in Lillington
The most populous age groups in Lillington are 25 to 29 Years (285 | 10.8%) for men and 25 to 29 Years (181 | 9.4%) for women.
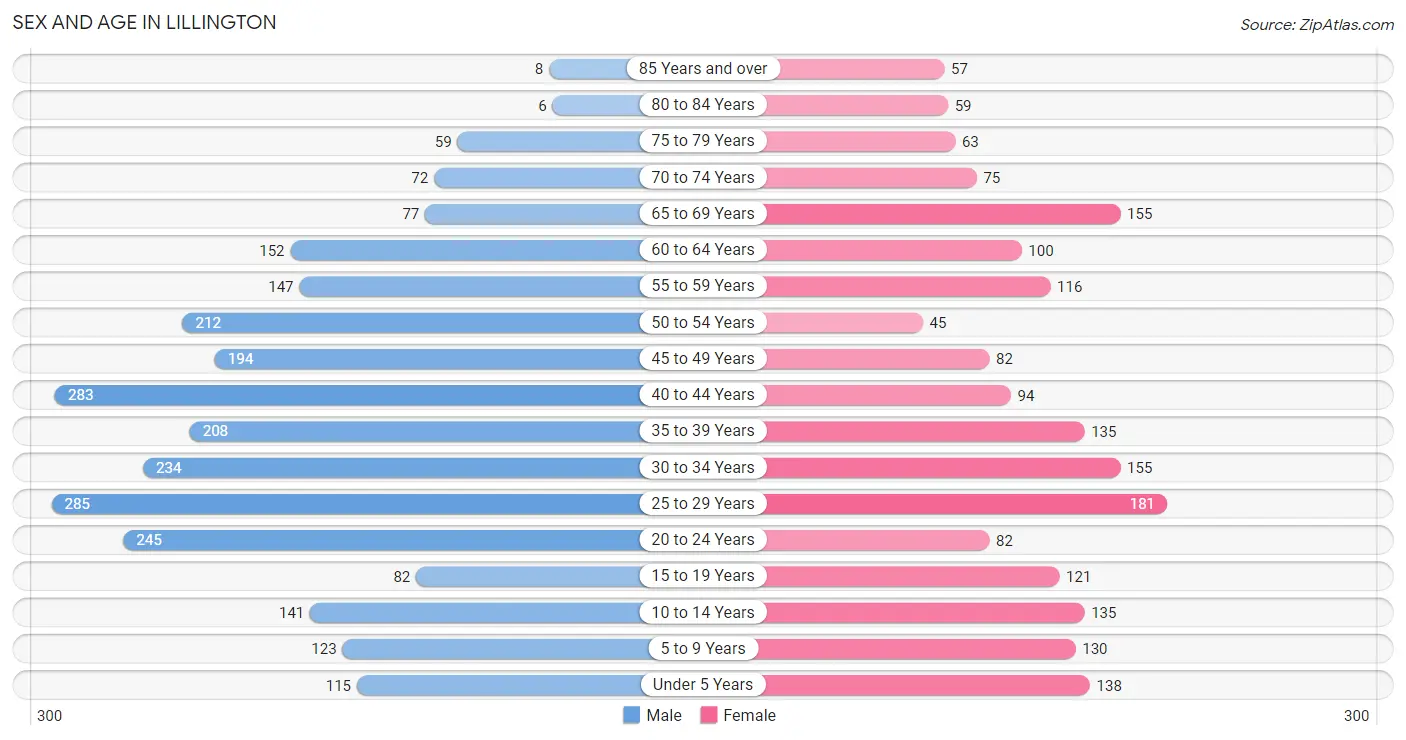
| Age Bracket | Male | Female |
| Under 5 Years | 115 (4.3%) | 138 (7.2%) |
| 5 to 9 Years | 123 (4.6%) | 130 (6.8%) |
| 10 to 14 Years | 141 (5.3%) | 135 (7.0%) |
| 15 to 19 Years | 82 (3.1%) | 121 (6.3%) |
| 20 to 24 Years | 245 (9.3%) | 82 (4.3%) |
| 25 to 29 Years | 285 (10.8%) | 181 (9.4%) |
| 30 to 34 Years | 234 (8.8%) | 155 (8.1%) |
| 35 to 39 Years | 208 (7.9%) | 135 (7.0%) |
| 40 to 44 Years | 283 (10.7%) | 94 (4.9%) |
| 45 to 49 Years | 194 (7.3%) | 82 (4.3%) |
| 50 to 54 Years | 212 (8.0%) | 45 (2.3%) |
| 55 to 59 Years | 147 (5.6%) | 116 (6.0%) |
| 60 to 64 Years | 152 (5.8%) | 100 (5.2%) |
| 65 to 69 Years | 77 (2.9%) | 155 (8.1%) |
| 70 to 74 Years | 72 (2.7%) | 75 (3.9%) |
| 75 to 79 Years | 59 (2.2%) | 63 (3.3%) |
| 80 to 84 Years | 6 (0.2%) | 59 (3.1%) |
| 85 Years and over | 8 (0.3%) | 57 (3.0%) |
| Total | 2,643 (100.0%) | 1,923 (100.0%) |
Families and Households in Lillington
Median Family Size in Lillington
The median family size in Lillington is 3.39 persons per family, with married-couple families (518 | 62.8%) accounting for the largest median family size of 3.7 persons per family. On the other hand, single male/father families (85 | 10.3%) represent the smallest median family size with 2.66 persons per family.
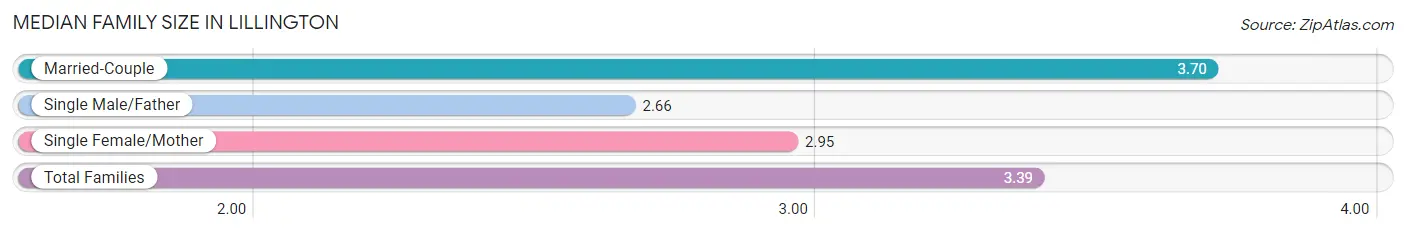
| Family Type | # Families | Family Size |
| Married-Couple | 518 (62.8%) | 3.70 |
| Single Male/Father | 85 (10.3%) | 2.66 |
| Single Female/Mother | 222 (26.9%) | 2.95 |
| Total Families | 825 (100.0%) | 3.39 |
Median Household Size in Lillington
The median household size in Lillington is 2.70 persons per household, with married-couple households (518 | 41.4%) accounting for the largest median household size of 3.77 persons per household. non-family households (426 | 34.1%) represent the smallest median household size with 1.22 persons per household.
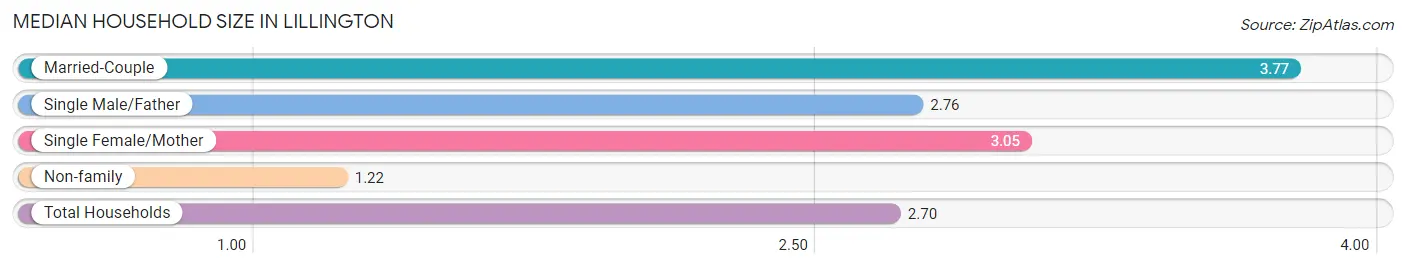
| Household Type | # Households | Household Size |
| Married-Couple | 518 (41.4%) | 3.77 |
| Single Male/Father | 85 (6.8%) | 2.76 |
| Single Female/Mother | 222 (17.7%) | 3.05 |
| Non-family | 426 (34.1%) | 1.22 |
| Total Households | 1,251 (100.0%) | 2.70 |
Household Size by Marriage Status in Lillington
Out of a total of 1,251 households in Lillington, 825 (65.9%) are family households, while 426 (34.1%) are nonfamily households. The most numerous type of family households are 2-person households, comprising 307, and the most common type of nonfamily households are 1-person households, comprising 358.
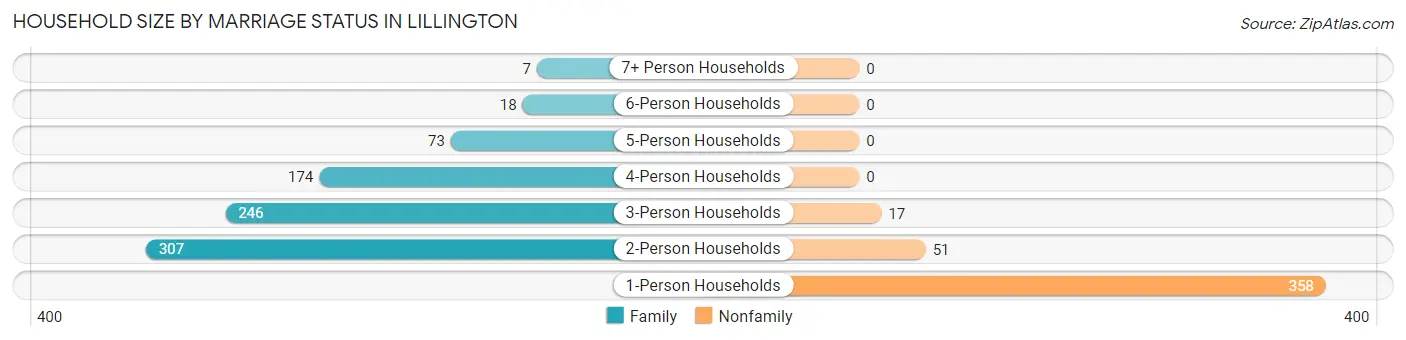
| Household Size | Family Households | Nonfamily Households |
| 1-Person Households | - | 358 (28.6%) |
| 2-Person Households | 307 (24.5%) | 51 (4.1%) |
| 3-Person Households | 246 (19.7%) | 17 (1.4%) |
| 4-Person Households | 174 (13.9%) | 0 (0.0%) |
| 5-Person Households | 73 (5.8%) | 0 (0.0%) |
| 6-Person Households | 18 (1.4%) | 0 (0.0%) |
| 7+ Person Households | 7 (0.6%) | 0 (0.0%) |
| Total | 825 (65.9%) | 426 (34.1%) |
Female Fertility in Lillington
Fertility by Age in Lillington
Average fertility rate in Lillington is 45.0 births per 1,000 women. Women in the age bracket of 20 to 34 years have the highest fertility rate with 91.0 births per 1,000 women. Women in the age bracket of 20 to 34 years acount for 100.0% of all women with births.
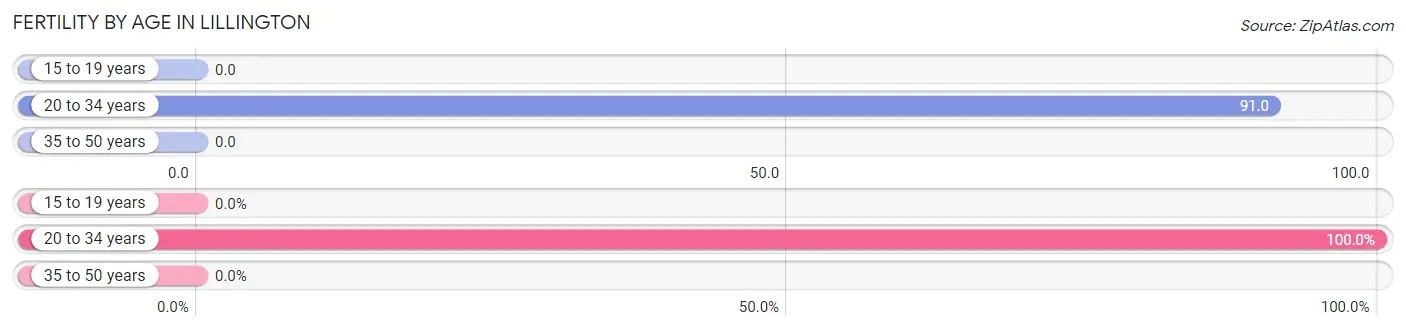
| Age Bracket | Women with Births | Births / 1,000 Women |
| 15 to 19 years | 0 (0.0%) | 0.0 |
| 20 to 34 years | 38 (100.0%) | 91.0 |
| 35 to 50 years | 0 (0.0%) | 0.0 |
| Total | 38 (100.0%) | 45.0 |
Fertility by Age by Marriage Status in Lillington
89.5% of women with births (38) in Lillington are married. The highest percentage of unmarried women with births falls into 20 to 34 years age bracket with 10.5% of them unmarried at the time of birth, while the lowest percentage of unmarried women with births belong to 20 to 34 years age bracket with 10.5% of them unmarried.
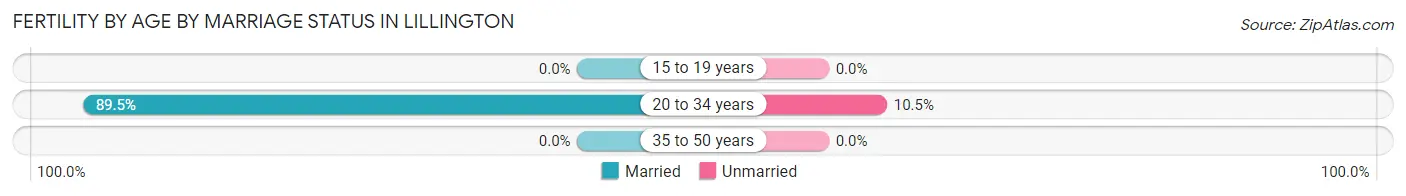
| Age Bracket | Married | Unmarried |
| 15 to 19 years | 0 (0.0%) | 0 (0.0%) |
| 20 to 34 years | 34 (89.5%) | 4 (10.5%) |
| 35 to 50 years | 0 (0.0%) | 0 (0.0%) |
| Total | 34 (89.5%) | 4 (10.5%) |
Fertility by Education in Lillington
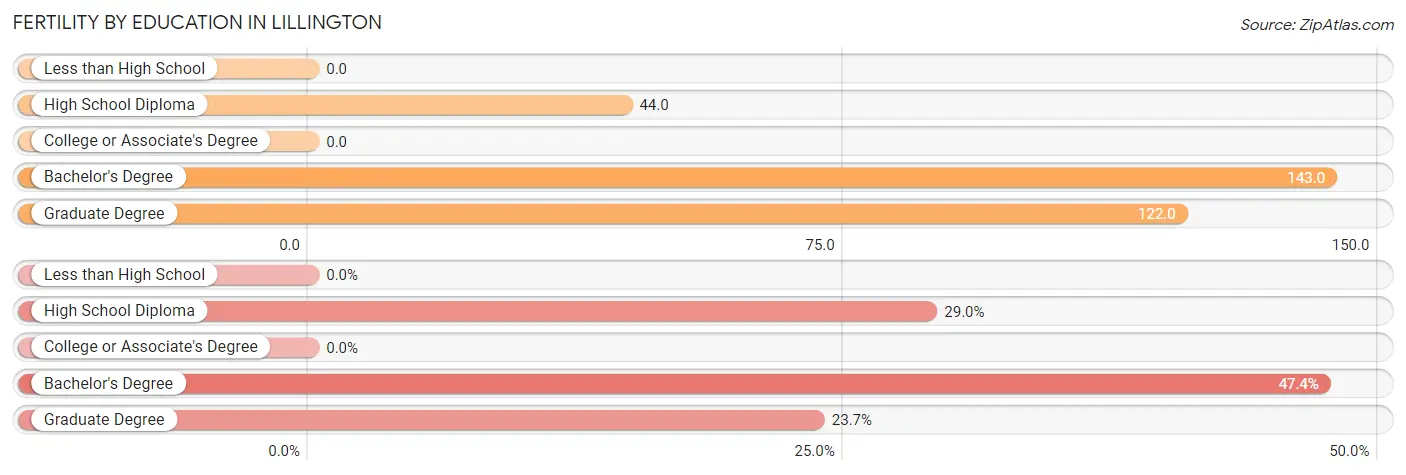
| Educational Attainment | Women with Births | Births / 1,000 Women |
| Less than High School | 0 (0.0%) | 0.0 |
| High School Diploma | 11 (28.9%) | 44.0 |
| College or Associate's Degree | 0 (0.0%) | 0.0 |
| Bachelor's Degree | 18 (47.4%) | 143.0 |
| Graduate Degree | 9 (23.7%) | 122.0 |
| Total | 38 (100.0%) | 45.0 |
Fertility by Education by Marriage Status in Lillington
10.5% of women with births in Lillington are unmarried. Women with the educational attainment of bachelor's degree are most likely to be married with 100.0% of them married at childbirth, while women with the educational attainment of high school diploma are least likely to be married with 36.4% of them unmarried at childbirth.
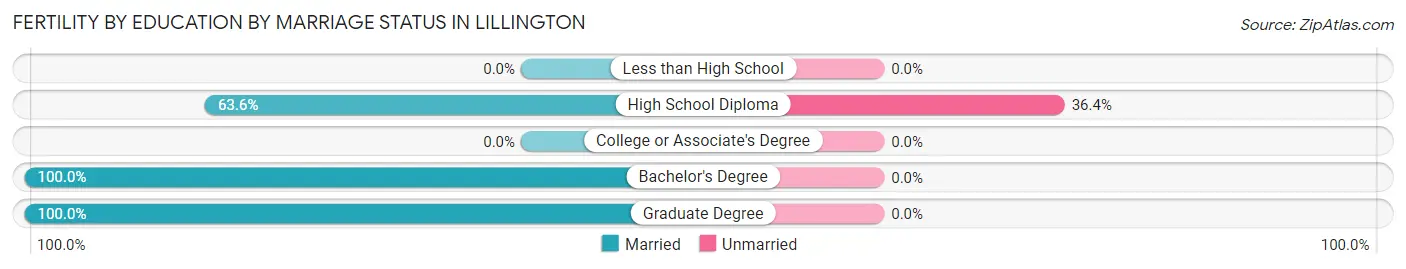
| Educational Attainment | Married | Unmarried |
| Less than High School | 0 (0.0%) | 0 (0.0%) |
| High School Diploma | 7 (63.6%) | 4 (36.4%) |
| College or Associate's Degree | 0 (0.0%) | 0 (0.0%) |
| Bachelor's Degree | 18 (100.0%) | 0 (0.0%) |
| Graduate Degree | 9 (100.0%) | 0 (0.0%) |
| Total | 34 (89.5%) | 4 (10.5%) |
Employment Characteristics in Lillington
Employment by Class of Employer in Lillington
Among the 1,690 employed individuals in Lillington, private company employees (1,114 | 65.9%), local government employees (156 | 9.2%), and self-employed (incorporated) (104 | 6.1%) make up the most common classes of employment.
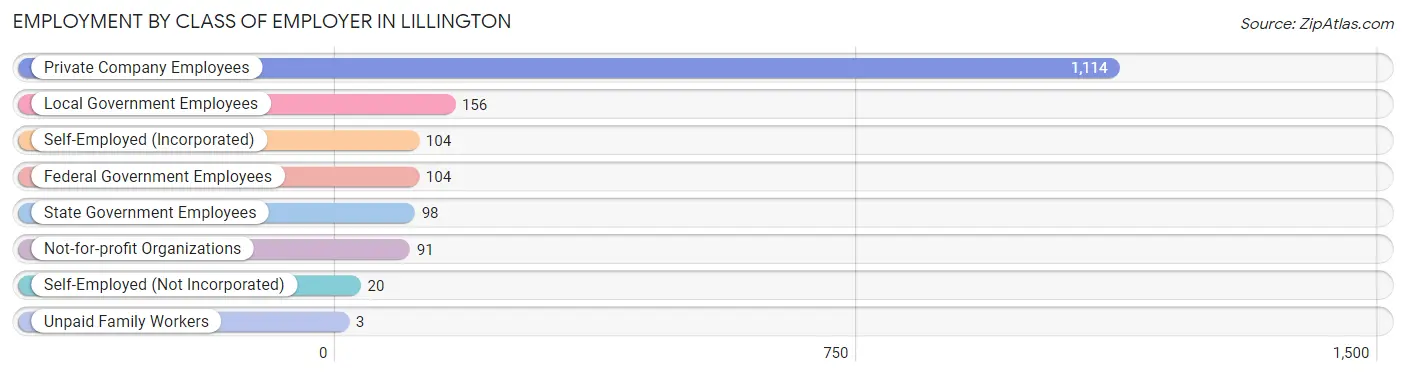
| Employer Class | # Employees | % Employees |
| Private Company Employees | 1,114 | 65.9% |
| Self-Employed (Incorporated) | 104 | 6.1% |
| Self-Employed (Not Incorporated) | 20 | 1.2% |
| Not-for-profit Organizations | 91 | 5.4% |
| Local Government Employees | 156 | 9.2% |
| State Government Employees | 98 | 5.8% |
| Federal Government Employees | 104 | 6.1% |
| Unpaid Family Workers | 3 | 0.2% |
| Total | 1,690 | 100.0% |
Employment Status by Age in Lillington
According to the labor force statistics for Lillington, out of the total population over 16 years of age (3,749), 46.7% or 1,751 individuals are in the labor force, with 0.8% or 14 of them unemployed. The age group with the highest labor force participation rate is 20 to 24 years, with 72.5% or 237 individuals in the labor force. Within the labor force, the 45 to 54 years age range has the highest percentage of unemployed individuals, with 3.9% or 8 of them being unemployed.
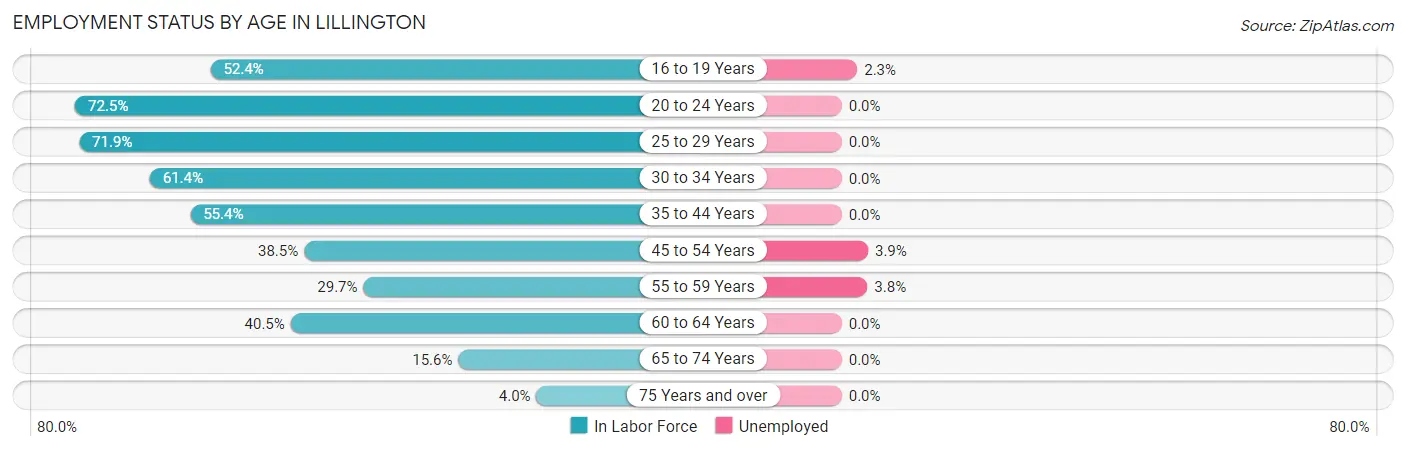
| Age Bracket | In Labor Force | Unemployed |
| 16 to 19 Years | 88 (52.4%) | 2 (2.3%) |
| 20 to 24 Years | 237 (72.5%) | 0 (0.0%) |
| 25 to 29 Years | 335 (71.9%) | 0 (0.0%) |
| 30 to 34 Years | 239 (61.4%) | 0 (0.0%) |
| 35 to 44 Years | 399 (55.4%) | 0 (0.0%) |
| 45 to 54 Years | 205 (38.5%) | 8 (3.9%) |
| 55 to 59 Years | 78 (29.7%) | 3 (3.8%) |
| 60 to 64 Years | 102 (40.5%) | 0 (0.0%) |
| 65 to 74 Years | 59 (15.6%) | 0 (0.0%) |
| 75 Years and over | 10 (4.0%) | 0 (0.0%) |
| Total | 1,751 (46.7%) | 14 (0.8%) |
Employment Status by Educational Attainment in Lillington
According to labor force statistics for Lillington, 51.8% of individuals (1,359) out of the total population between 25 and 64 years of age (2,623) are in the labor force, with 0.8% or 11 of them being unemployed. The group with the highest labor force participation rate are those with the educational attainment of bachelor's degree or higher, with 88.0% or 402 individuals in the labor force. Within the labor force, individuals with college / associate degree education have the highest percentage of unemployment, with 1.8% or 8 of them being unemployed.
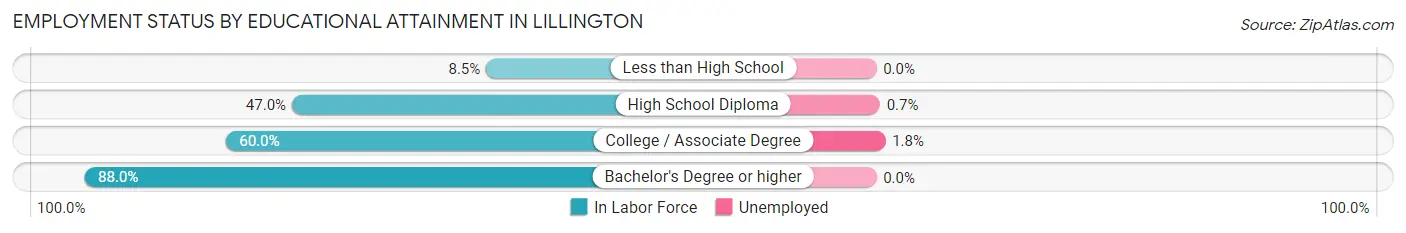
| Educational Attainment | In Labor Force | Unemployed |
| Less than High School | 36 (8.5%) | 0 (0.0%) |
| High School Diploma | 453 (47.0%) | 7 (0.7%) |
| College / Associate Degree | 467 (60.0%) | 14 (1.8%) |
| Bachelor's Degree or higher | 402 (88.0%) | 0 (0.0%) |
| Total | 1,359 (51.8%) | 21 (0.8%) |
Employment Occupations by Sex in Lillington
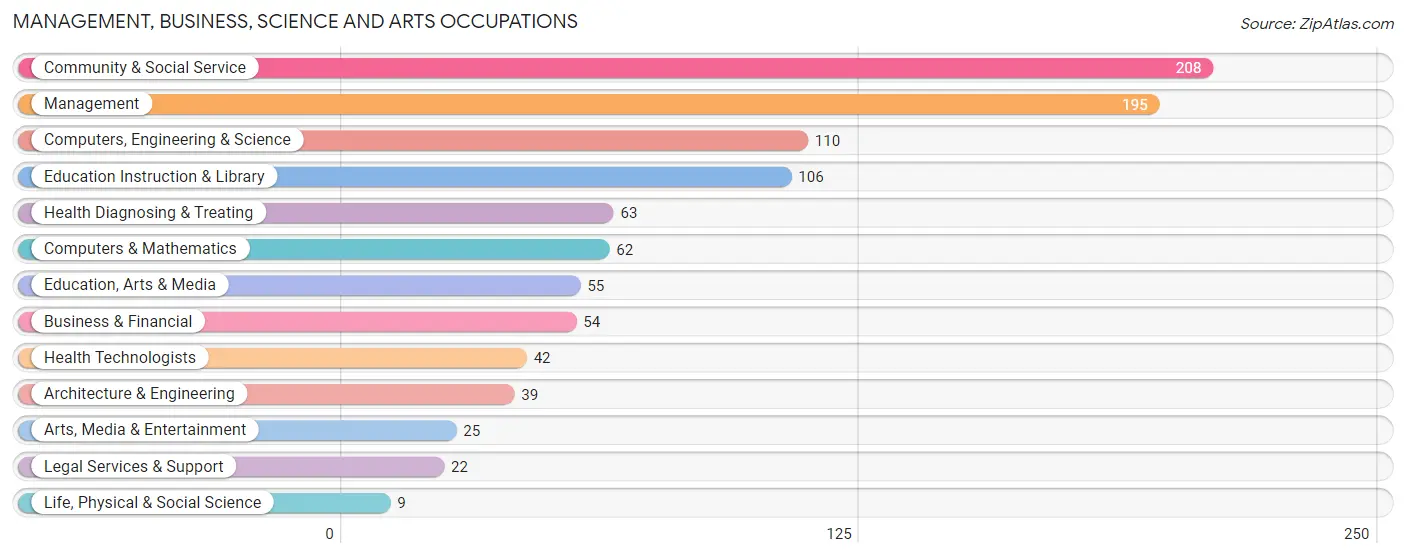
Management, Business, Science and Arts Occupations
The most common Management, Business, Science and Arts occupations in Lillington are Community & Social Service (208 | 12.4%), Management (195 | 11.6%), Computers, Engineering & Science (110 | 6.6%), Education Instruction & Library (106 | 6.3%), and Health Diagnosing & Treating (63 | 3.7%).
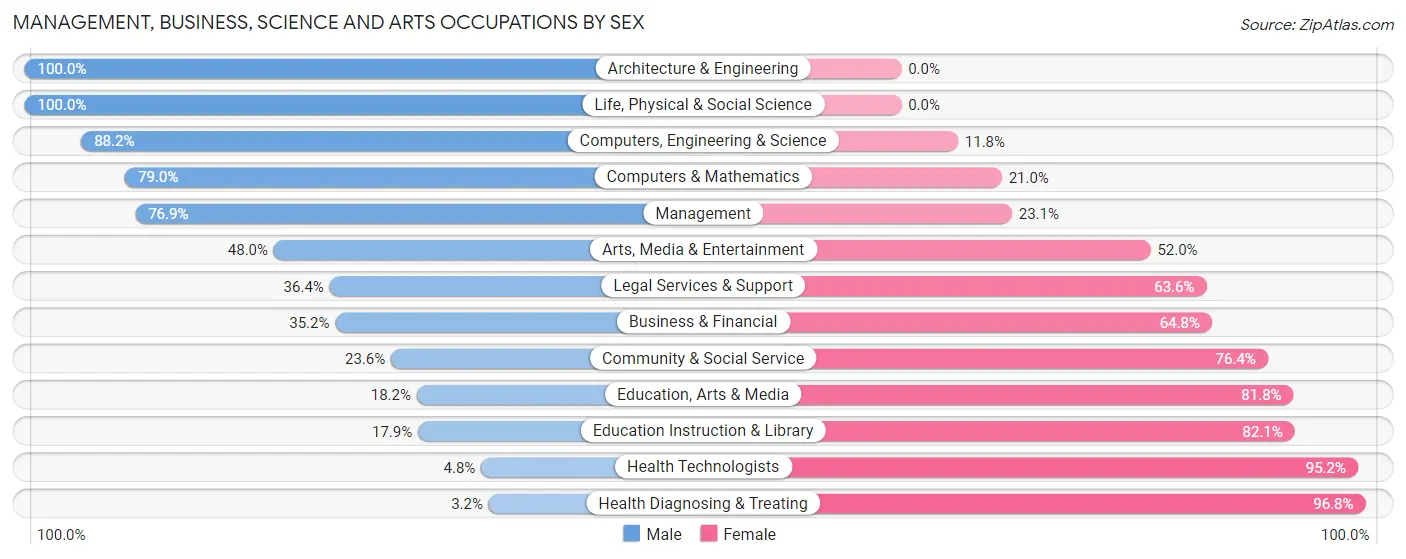
Management, Business, Science and Arts Occupations by Sex
Within the Management, Business, Science and Arts occupations in Lillington, the most male-oriented occupations are Architecture & Engineering (100.0%), Life, Physical & Social Science (100.0%), and Computers, Engineering & Science (88.2%), while the most female-oriented occupations are Health Diagnosing & Treating (96.8%), Health Technologists (95.2%), and Education Instruction & Library (82.1%).
| Occupation | Male | Female |
| Management | 150 (76.9%) | 45 (23.1%) |
| Business & Financial | 19 (35.2%) | 35 (64.8%) |
| Computers, Engineering & Science | 97 (88.2%) | 13 (11.8%) |
| Computers & Mathematics | 49 (79.0%) | 13 (21.0%) |
| Architecture & Engineering | 39 (100.0%) | 0 (0.0%) |
| Life, Physical & Social Science | 9 (100.0%) | 0 (0.0%) |
| Community & Social Service | 49 (23.6%) | 159 (76.4%) |
| Education, Arts & Media | 10 (18.2%) | 45 (81.8%) |
| Legal Services & Support | 8 (36.4%) | 14 (63.6%) |
| Education Instruction & Library | 19 (17.9%) | 87 (82.1%) |
| Arts, Media & Entertainment | 12 (48.0%) | 13 (52.0%) |
| Health Diagnosing & Treating | 2 (3.2%) | 61 (96.8%) |
| Health Technologists | 2 (4.8%) | 40 (95.2%) |
| Total (Category) | 317 (50.3%) | 313 (49.7%) |
| Total (Overall) | 887 (52.8%) | 792 (47.2%) |
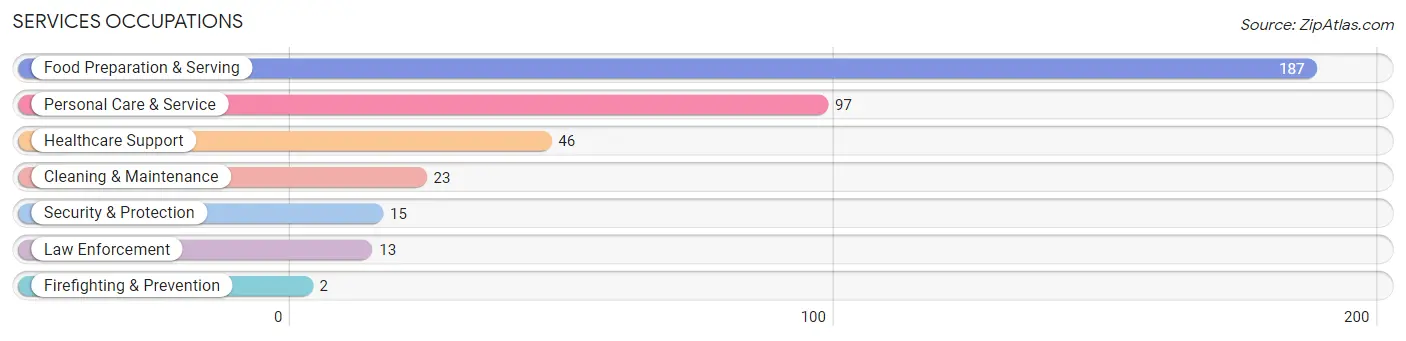
Services Occupations
The most common Services occupations in Lillington are Food Preparation & Serving (187 | 11.1%), Personal Care & Service (97 | 5.8%), Healthcare Support (46 | 2.7%), Cleaning & Maintenance (23 | 1.4%), and Security & Protection (15 | 0.9%).
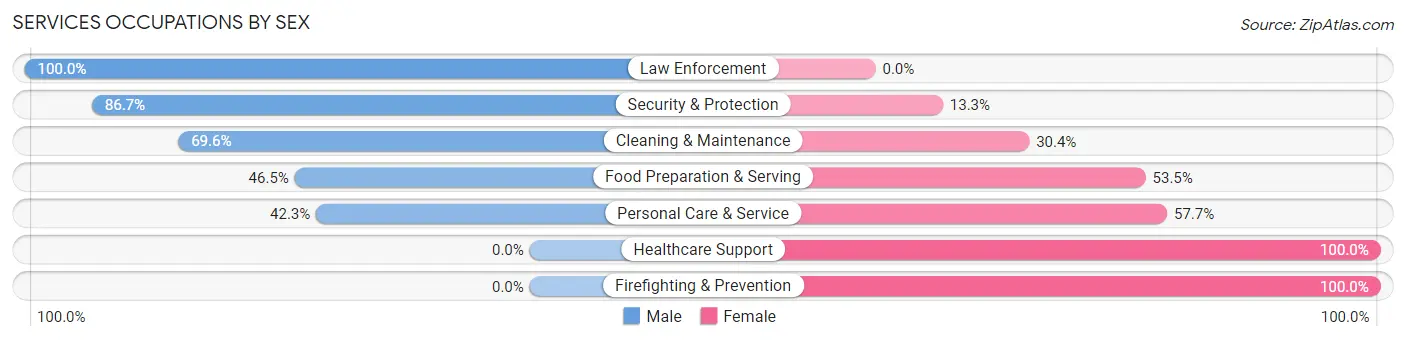
Services Occupations by Sex
Within the Services occupations in Lillington, the most male-oriented occupations are Law Enforcement (100.0%), Security & Protection (86.7%), and Cleaning & Maintenance (69.6%), while the most female-oriented occupations are Healthcare Support (100.0%), Firefighting & Prevention (100.0%), and Personal Care & Service (57.7%).
| Occupation | Male | Female |
| Healthcare Support | 0 (0.0%) | 46 (100.0%) |
| Security & Protection | 13 (86.7%) | 2 (13.3%) |
| Firefighting & Prevention | 0 (0.0%) | 2 (100.0%) |
| Law Enforcement | 13 (100.0%) | 0 (0.0%) |
| Food Preparation & Serving | 87 (46.5%) | 100 (53.5%) |
| Cleaning & Maintenance | 16 (69.6%) | 7 (30.4%) |
| Personal Care & Service | 41 (42.3%) | 56 (57.7%) |
| Total (Category) | 157 (42.7%) | 211 (57.3%) |
| Total (Overall) | 887 (52.8%) | 792 (47.2%) |
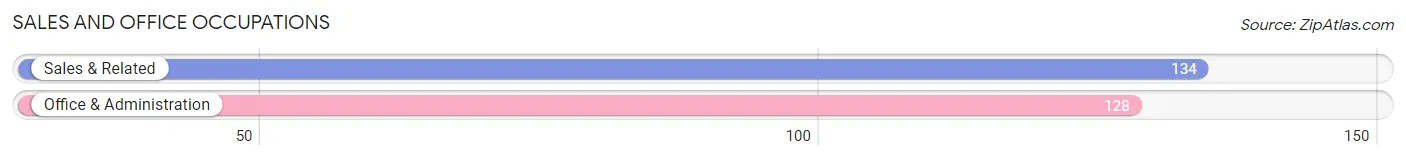
Sales and Office Occupations
The most common Sales and Office occupations in Lillington are Sales & Related (134 | 8.0%), and Office & Administration (128 | 7.6%).
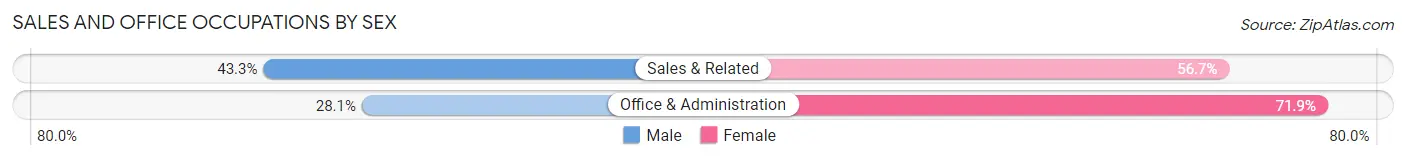
Sales and Office Occupations by Sex
| Occupation | Male | Female |
| Sales & Related | 58 (43.3%) | 76 (56.7%) |
| Office & Administration | 36 (28.1%) | 92 (71.9%) |
| Total (Category) | 94 (35.9%) | 168 (64.1%) |
| Total (Overall) | 887 (52.8%) | 792 (47.2%) |
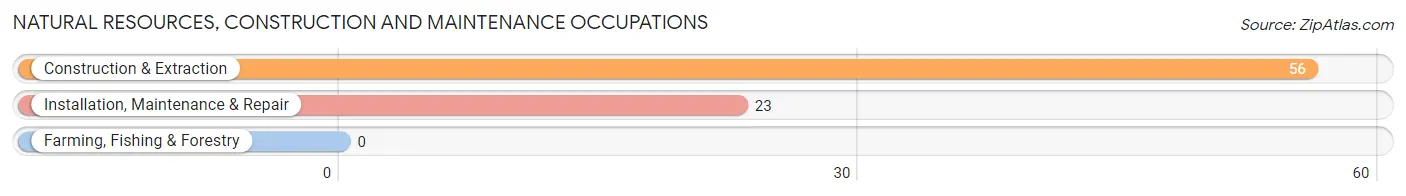
Natural Resources, Construction and Maintenance Occupations
The most common Natural Resources, Construction and Maintenance occupations in Lillington are Construction & Extraction (56 | 3.3%), and Installation, Maintenance & Repair (23 | 1.4%).
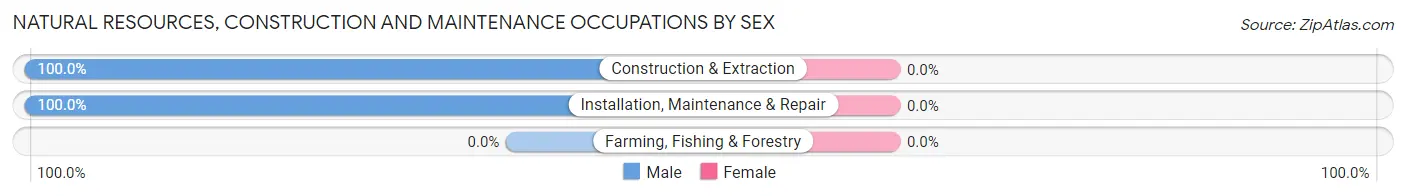
Natural Resources, Construction and Maintenance Occupations by Sex
| Occupation | Male | Female |
| Farming, Fishing & Forestry | 0 (0.0%) | 0 (0.0%) |
| Construction & Extraction | 56 (100.0%) | 0 (0.0%) |
| Installation, Maintenance & Repair | 23 (100.0%) | 0 (0.0%) |
| Total (Category) | 79 (100.0%) | 0 (0.0%) |
| Total (Overall) | 887 (52.8%) | 792 (47.2%) |
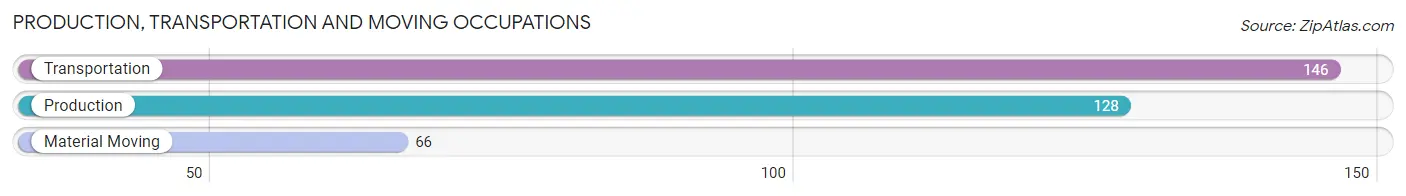
Production, Transportation and Moving Occupations
The most common Production, Transportation and Moving occupations in Lillington are Transportation (146 | 8.7%), Production (128 | 7.6%), and Material Moving (66 | 3.9%).
Production, Transportation and Moving Occupations by Sex
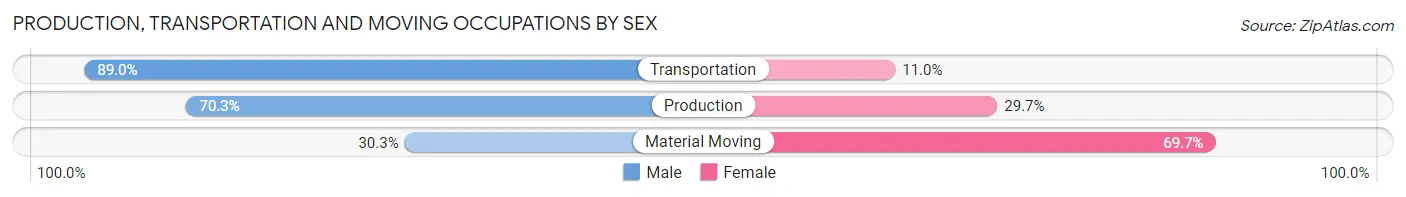
| Occupation | Male | Female |
| Production | 90 (70.3%) | 38 (29.7%) |
| Transportation | 130 (89.0%) | 16 (11.0%) |
| Material Moving | 20 (30.3%) | 46 (69.7%) |
| Total (Category) | 240 (70.6%) | 100 (29.4%) |
| Total (Overall) | 887 (52.8%) | 792 (47.2%) |
Employment Industries by Sex in Lillington
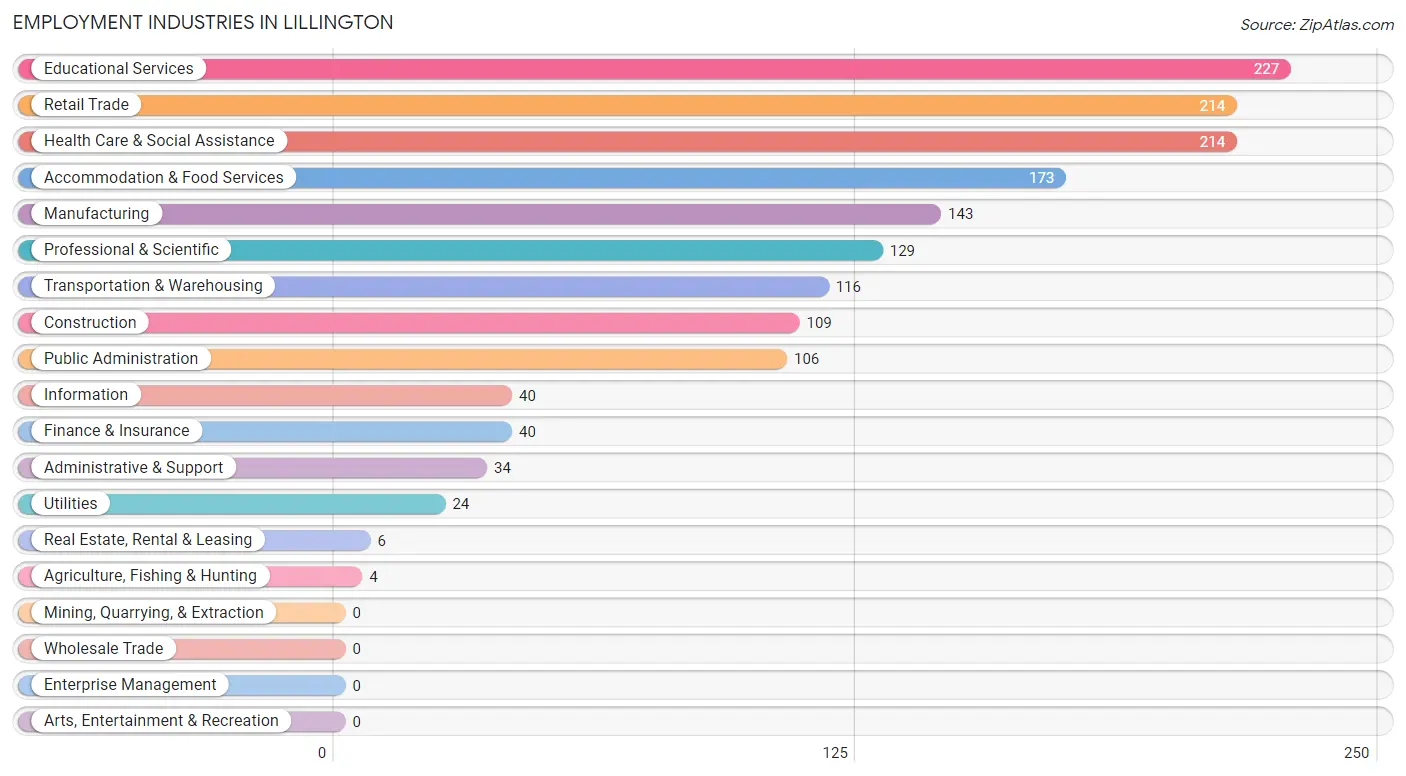
Employment Industries in Lillington
The major employment industries in Lillington include Educational Services (227 | 13.5%), Retail Trade (214 | 12.8%), Health Care & Social Assistance (214 | 12.8%), Accommodation & Food Services (173 | 10.3%), and Manufacturing (143 | 8.5%).
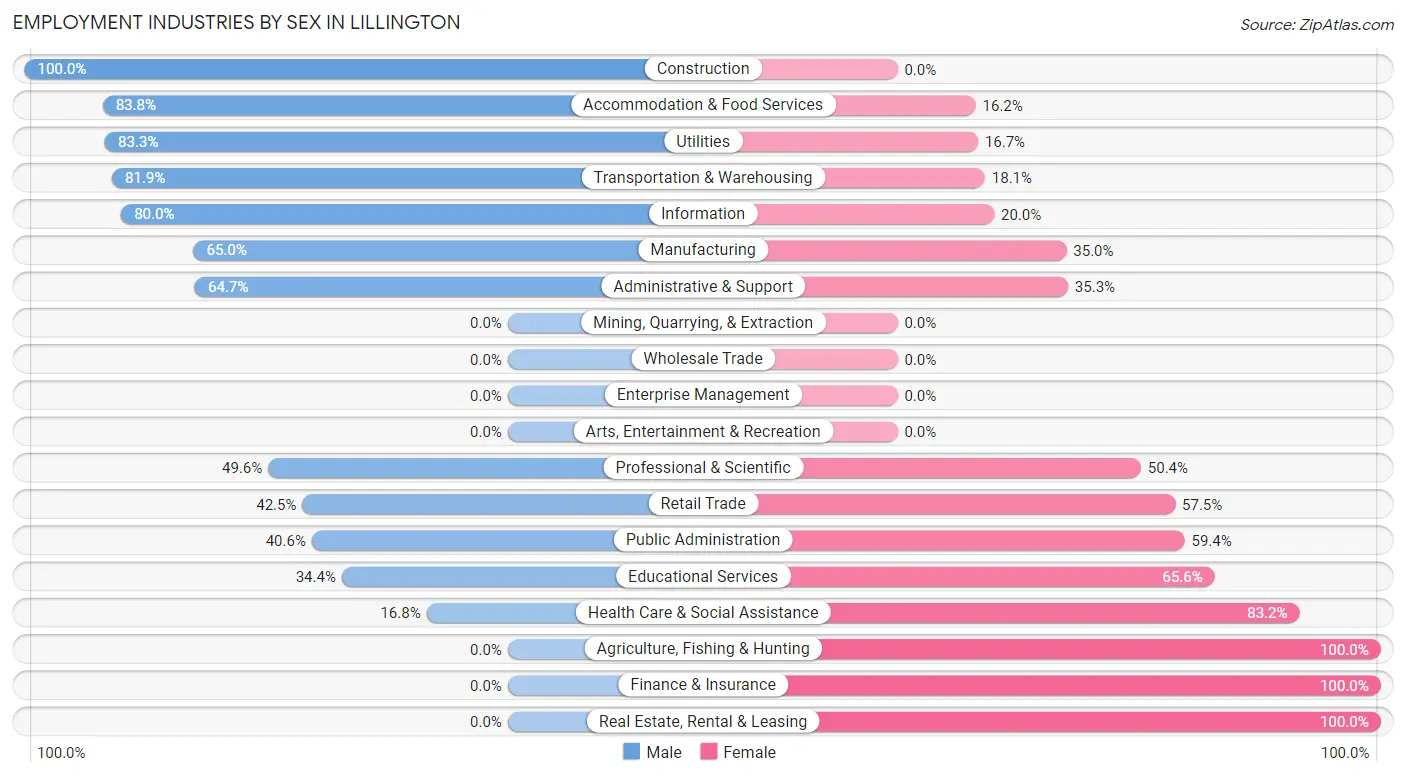
Employment Industries by Sex in Lillington
The Lillington industries that see more men than women are Construction (100.0%), Accommodation & Food Services (83.8%), and Utilities (83.3%), whereas the industries that tend to have a higher number of women are Agriculture, Fishing & Hunting (100.0%), Finance & Insurance (100.0%), and Real Estate, Rental & Leasing (100.0%).
| Industry | Male | Female |
| Agriculture, Fishing & Hunting | 0 (0.0%) | 4 (100.0%) |
| Mining, Quarrying, & Extraction | 0 (0.0%) | 0 (0.0%) |
| Construction | 109 (100.0%) | 0 (0.0%) |
| Manufacturing | 93 (65.0%) | 50 (35.0%) |
| Wholesale Trade | 0 (0.0%) | 0 (0.0%) |
| Retail Trade | 91 (42.5%) | 123 (57.5%) |
| Transportation & Warehousing | 95 (81.9%) | 21 (18.1%) |
| Utilities | 20 (83.3%) | 4 (16.7%) |
| Information | 32 (80.0%) | 8 (20.0%) |
| Finance & Insurance | 0 (0.0%) | 40 (100.0%) |
| Real Estate, Rental & Leasing | 0 (0.0%) | 6 (100.0%) |
| Professional & Scientific | 64 (49.6%) | 65 (50.4%) |
| Enterprise Management | 0 (0.0%) | 0 (0.0%) |
| Administrative & Support | 22 (64.7%) | 12 (35.3%) |
| Educational Services | 78 (34.4%) | 149 (65.6%) |
| Health Care & Social Assistance | 36 (16.8%) | 178 (83.2%) |
| Arts, Entertainment & Recreation | 0 (0.0%) | 0 (0.0%) |
| Accommodation & Food Services | 145 (83.8%) | 28 (16.2%) |
| Public Administration | 43 (40.6%) | 63 (59.4%) |
| Total | 887 (52.8%) | 792 (47.2%) |
Education in Lillington
School Enrollment in Lillington
The most common levels of schooling among the 1,065 students in Lillington are college / undergraduate (241 | 22.6%), middle school (234 | 22.0%), and high school (193 | 18.1%).
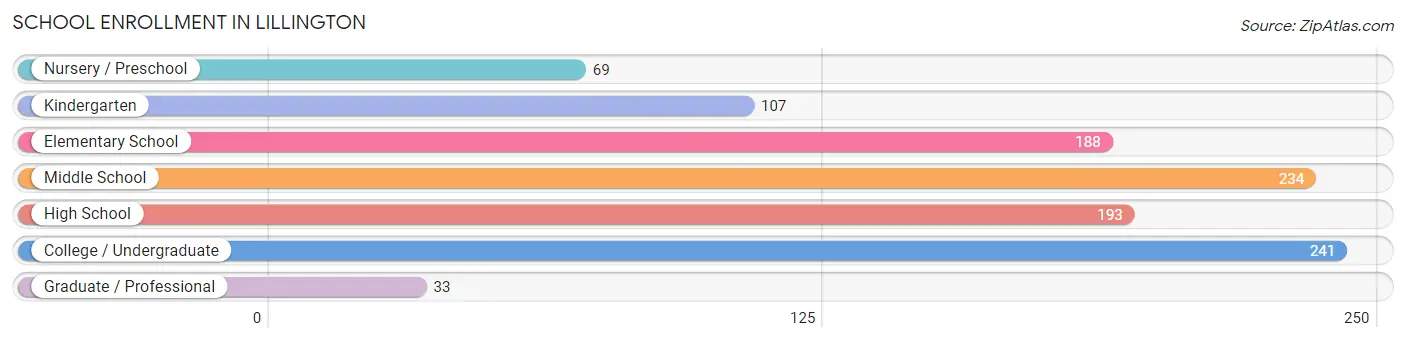
| School Level | # Students | % Students |
| Nursery / Preschool | 69 | 6.5% |
| Kindergarten | 107 | 10.1% |
| Elementary School | 188 | 17.6% |
| Middle School | 234 | 22.0% |
| High School | 193 | 18.1% |
| College / Undergraduate | 241 | 22.6% |
| Graduate / Professional | 33 | 3.1% |
| Total | 1,065 | 100.0% |
School Enrollment by Age by Funding Source in Lillington
Out of a total of 1,065 students who are enrolled in schools in Lillington, 213 (20.0%) attend a private institution, while the remaining 852 (80.0%) are enrolled in public schools. The age group of 3 to 4 year olds has the highest likelihood of being enrolled in private schools, with 46 (70.8% in the age bracket) enrolled. Conversely, the age group of 10 to 14 year olds has the lowest likelihood of being enrolled in a private school, with 268 (97.1% in the age bracket) attending a public institution.
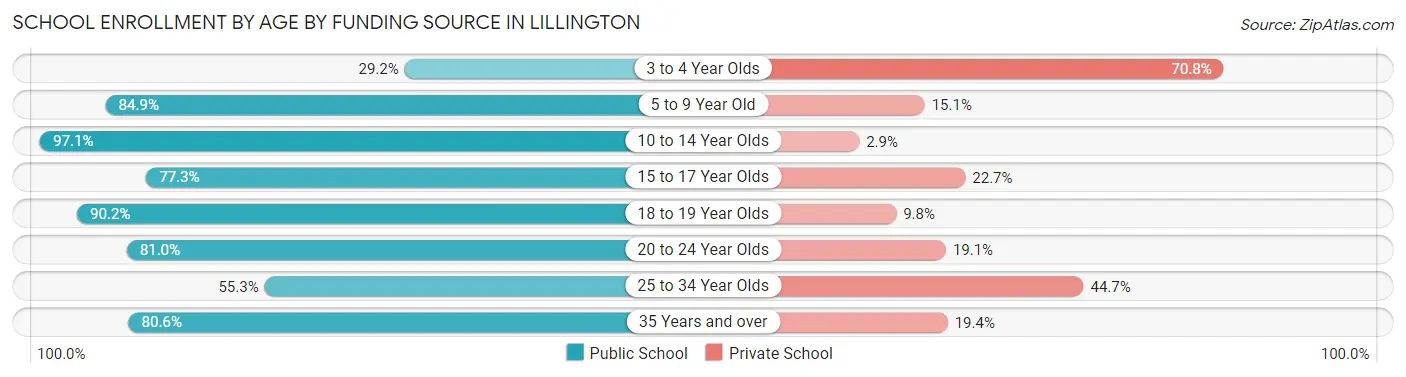
| Age Bracket | Public School | Private School |
| 3 to 4 Year Olds | 19 (29.2%) | 46 (70.8%) |
| 5 to 9 Year Old | 208 (84.9%) | 37 (15.1%) |
| 10 to 14 Year Olds | 268 (97.1%) | 8 (2.9%) |
| 15 to 17 Year Olds | 58 (77.3%) | 17 (22.7%) |
| 18 to 19 Year Olds | 83 (90.2%) | 9 (9.8%) |
| 20 to 24 Year Olds | 34 (80.9%) | 8 (19.1%) |
| 25 to 34 Year Olds | 78 (55.3%) | 63 (44.7%) |
| 35 Years and over | 104 (80.6%) | 25 (19.4%) |
| Total | 852 (80.0%) | 213 (20.0%) |
Educational Attainment by Field of Study in Lillington
Business (98 | 16.8%), arts & humanities (92 | 15.8%), education (69 | 11.9%), science & technology (62 | 10.6%), and liberal arts & history (51 | 8.8%) are the most common fields of study among 582 individuals in Lillington who have obtained a bachelor's degree or higher.
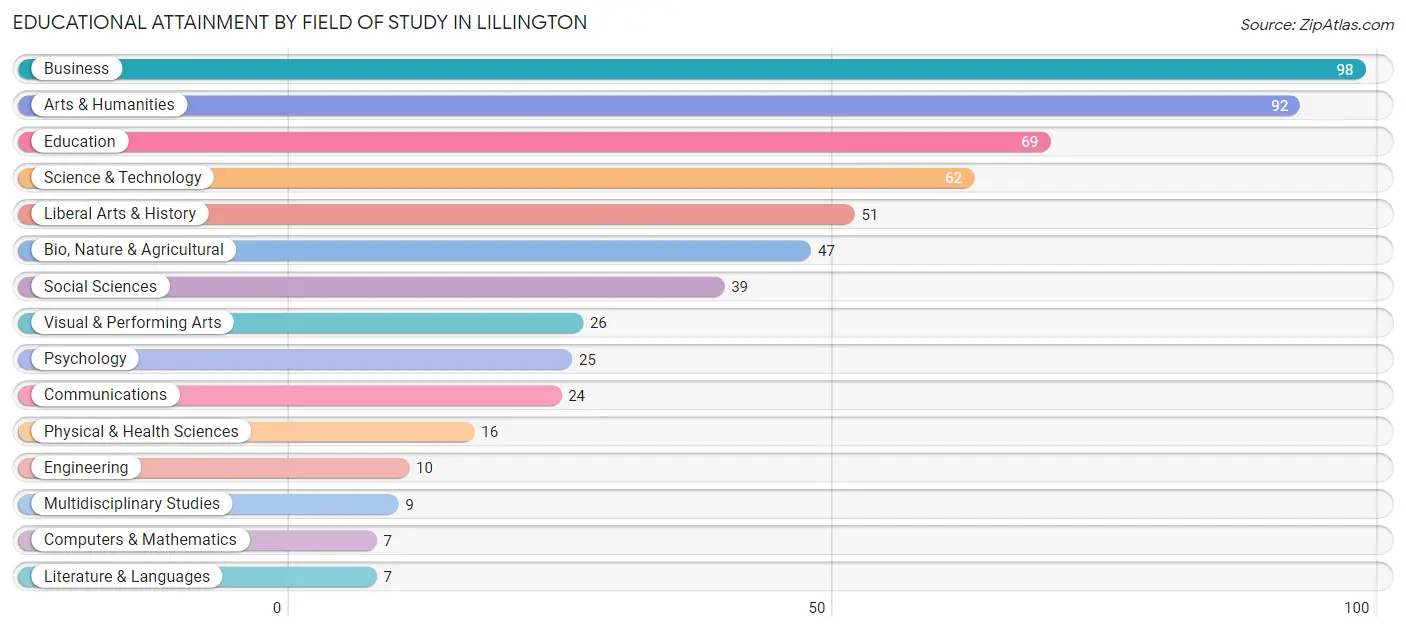
| Field of Study | # Graduates | % Graduates |
| Computers & Mathematics | 7 | 1.2% |
| Bio, Nature & Agricultural | 47 | 8.1% |
| Physical & Health Sciences | 16 | 2.8% |
| Psychology | 25 | 4.3% |
| Social Sciences | 39 | 6.7% |
| Engineering | 10 | 1.7% |
| Multidisciplinary Studies | 9 | 1.5% |
| Science & Technology | 62 | 10.6% |
| Business | 98 | 16.8% |
| Education | 69 | 11.9% |
| Literature & Languages | 7 | 1.2% |
| Liberal Arts & History | 51 | 8.8% |
| Visual & Performing Arts | 26 | 4.5% |
| Communications | 24 | 4.1% |
| Arts & Humanities | 92 | 15.8% |
| Total | 582 | 100.0% |
Transportation & Commute in Lillington
Vehicle Availability by Sex in Lillington
The most prevalent vehicle ownership categories in Lillington are males with 3 vehicles (442, accounting for 48.1%) and females with 3 vehicles (247, making up 57.3%).
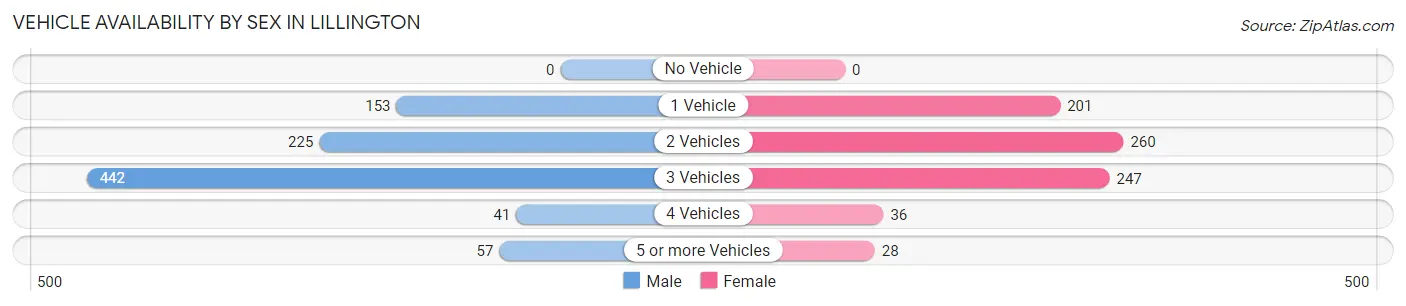
| Vehicles Available | Male | Female |
| No Vehicle | 0 (0.0%) | 0 (0.0%) |
| 1 Vehicle | 153 (16.7%) | 201 (26.0%) |
| 2 Vehicles | 225 (24.5%) | 260 (33.7%) |
| 3 Vehicles | 442 (48.1%) | 247 (32.0%) |
| 4 Vehicles | 41 (4.5%) | 36 (4.7%) |
| 5 or more Vehicles | 57 (6.2%) | 28 (3.6%) |
| Total | 918 (100.0%) | 772 (100.0%) |
Commute Time in Lillington
The most frequently occuring commute durations in Lillington are 5 to 9 minutes (252 commuters, 15.5%), 60 to 89 minutes (222 commuters, 13.7%), and 20 to 24 minutes (209 commuters, 12.9%).
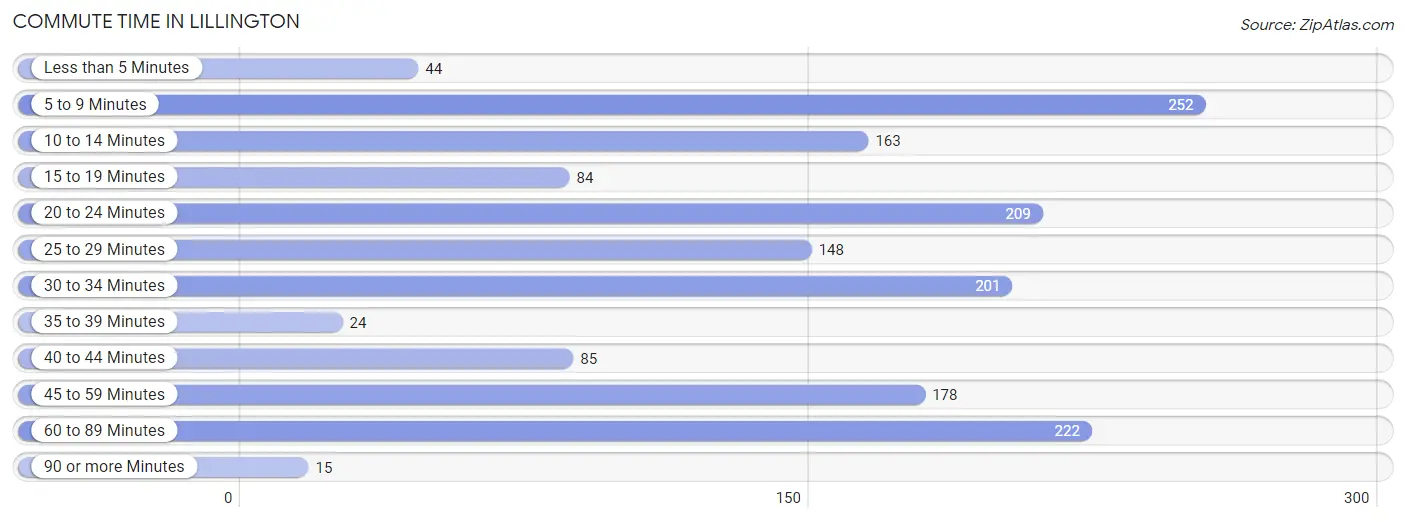
| Commute Time | # Commuters | % Commuters |
| Less than 5 Minutes | 44 | 2.7% |
| 5 to 9 Minutes | 252 | 15.5% |
| 10 to 14 Minutes | 163 | 10.0% |
| 15 to 19 Minutes | 84 | 5.2% |
| 20 to 24 Minutes | 209 | 12.9% |
| 25 to 29 Minutes | 148 | 9.1% |
| 30 to 34 Minutes | 201 | 12.4% |
| 35 to 39 Minutes | 24 | 1.5% |
| 40 to 44 Minutes | 85 | 5.2% |
| 45 to 59 Minutes | 178 | 11.0% |
| 60 to 89 Minutes | 222 | 13.7% |
| 90 or more Minutes | 15 | 0.9% |
Commute Time by Sex in Lillington
The most common commute times in Lillington are 5 to 9 minutes (160 commuters, 18.1%) for males and 20 to 24 minutes (157 commuters, 21.2%) for females.
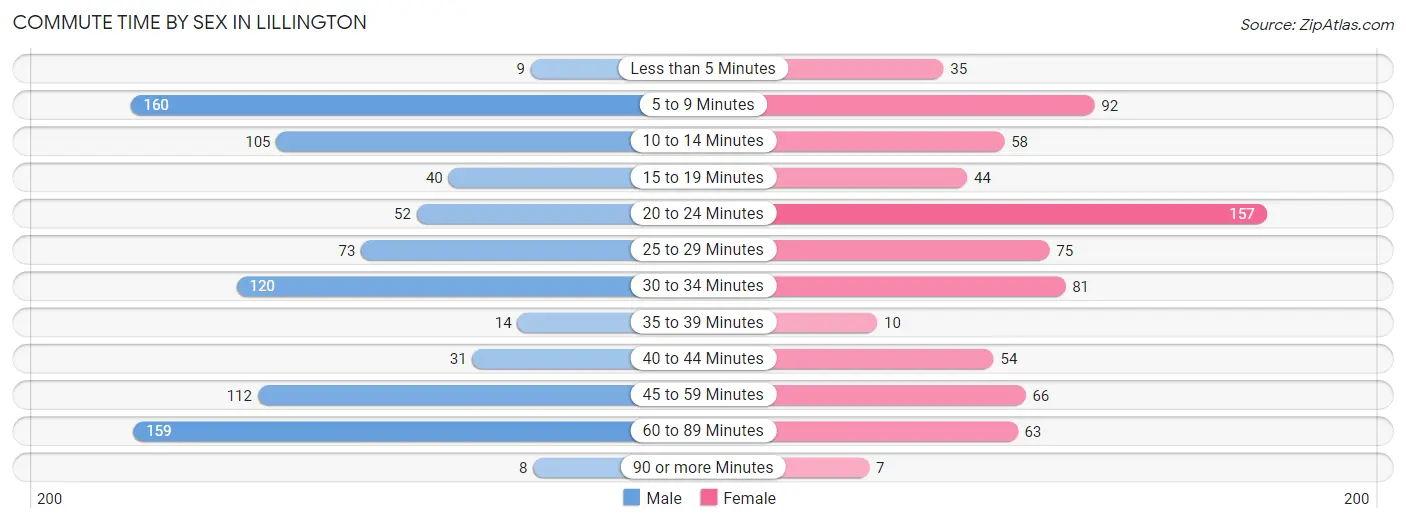
| Commute Time | Male | Female |
| Less than 5 Minutes | 9 (1.0%) | 35 (4.7%) |
| 5 to 9 Minutes | 160 (18.1%) | 92 (12.4%) |
| 10 to 14 Minutes | 105 (11.9%) | 58 (7.8%) |
| 15 to 19 Minutes | 40 (4.5%) | 44 (5.9%) |
| 20 to 24 Minutes | 52 (5.9%) | 157 (21.2%) |
| 25 to 29 Minutes | 73 (8.3%) | 75 (10.1%) |
| 30 to 34 Minutes | 120 (13.6%) | 81 (10.9%) |
| 35 to 39 Minutes | 14 (1.6%) | 10 (1.3%) |
| 40 to 44 Minutes | 31 (3.5%) | 54 (7.3%) |
| 45 to 59 Minutes | 112 (12.7%) | 66 (8.9%) |
| 60 to 89 Minutes | 159 (18.0%) | 63 (8.5%) |
| 90 or more Minutes | 8 (0.9%) | 7 (0.9%) |
Time of Departure to Work by Sex in Lillington
The most frequent times of departure to work in Lillington are 8:00 AM to 8:29 AM (150, 17.0%) for males and 7:00 AM to 7:29 AM (124, 16.7%) for females.
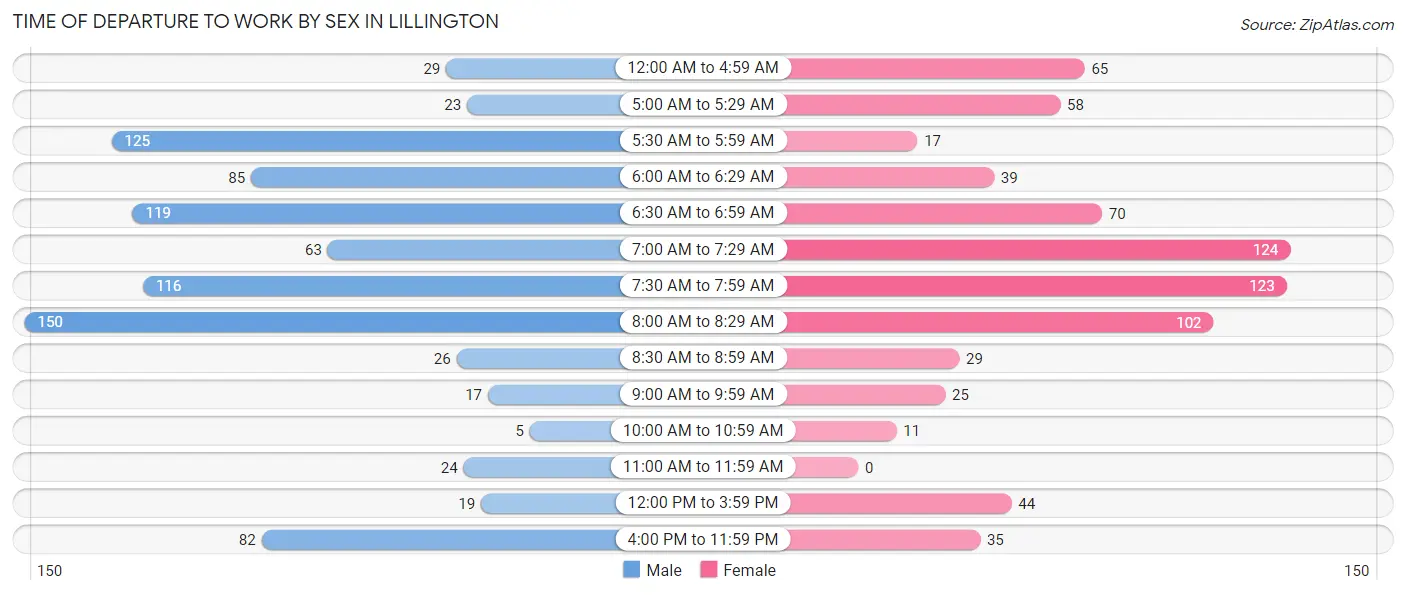
| Time of Departure | Male | Female |
| 12:00 AM to 4:59 AM | 29 (3.3%) | 65 (8.8%) |
| 5:00 AM to 5:29 AM | 23 (2.6%) | 58 (7.8%) |
| 5:30 AM to 5:59 AM | 125 (14.2%) | 17 (2.3%) |
| 6:00 AM to 6:29 AM | 85 (9.6%) | 39 (5.3%) |
| 6:30 AM to 6:59 AM | 119 (13.5%) | 70 (9.4%) |
| 7:00 AM to 7:29 AM | 63 (7.1%) | 124 (16.7%) |
| 7:30 AM to 7:59 AM | 116 (13.1%) | 123 (16.6%) |
| 8:00 AM to 8:29 AM | 150 (17.0%) | 102 (13.8%) |
| 8:30 AM to 8:59 AM | 26 (2.9%) | 29 (3.9%) |
| 9:00 AM to 9:59 AM | 17 (1.9%) | 25 (3.4%) |
| 10:00 AM to 10:59 AM | 5 (0.6%) | 11 (1.5%) |
| 11:00 AM to 11:59 AM | 24 (2.7%) | 0 (0.0%) |
| 12:00 PM to 3:59 PM | 19 (2.1%) | 44 (5.9%) |
| 4:00 PM to 11:59 PM | 82 (9.3%) | 35 (4.7%) |
| Total | 883 (100.0%) | 742 (100.0%) |
Housing Occupancy in Lillington
Occupancy by Ownership in Lillington
Of the total 1,251 dwellings in Lillington, owner-occupied units account for 706 (56.4%), while renter-occupied units make up 545 (43.6%).
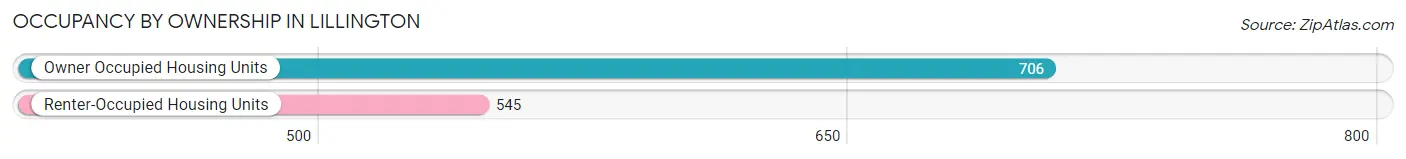
| Occupancy | # Housing Units | % Housing Units |
| Owner Occupied Housing Units | 706 | 56.4% |
| Renter-Occupied Housing Units | 545 | 43.6% |
| Total Occupied Housing Units | 1,251 | 100.0% |
Occupancy by Household Size in Lillington
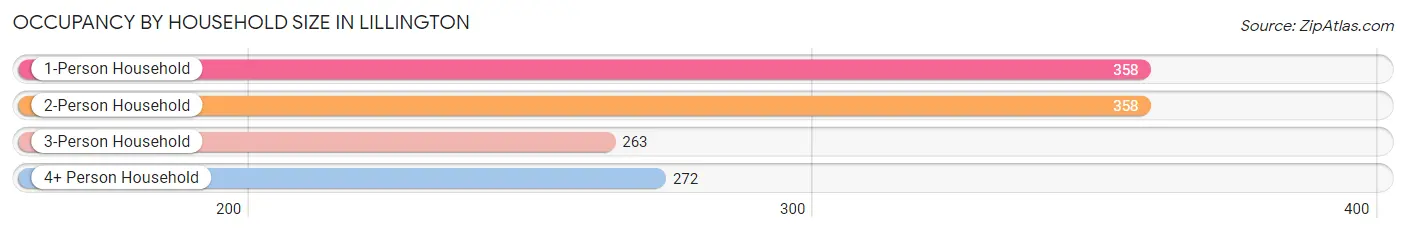
| Household Size | # Housing Units | % Housing Units |
| 1-Person Household | 358 | 28.6% |
| 2-Person Household | 358 | 28.6% |
| 3-Person Household | 263 | 21.0% |
| 4+ Person Household | 272 | 21.7% |
| Total Housing Units | 1,251 | 100.0% |
Occupancy by Ownership by Household Size in Lillington
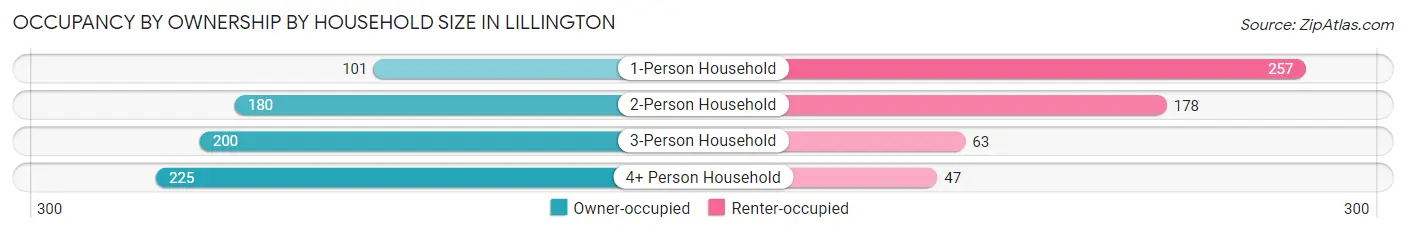
| Household Size | Owner-occupied | Renter-occupied |
| 1-Person Household | 101 (28.2%) | 257 (71.8%) |
| 2-Person Household | 180 (50.3%) | 178 (49.7%) |
| 3-Person Household | 200 (76.0%) | 63 (23.9%) |
| 4+ Person Household | 225 (82.7%) | 47 (17.3%) |
| Total Housing Units | 706 (56.4%) | 545 (43.6%) |
Occupancy by Educational Attainment in Lillington
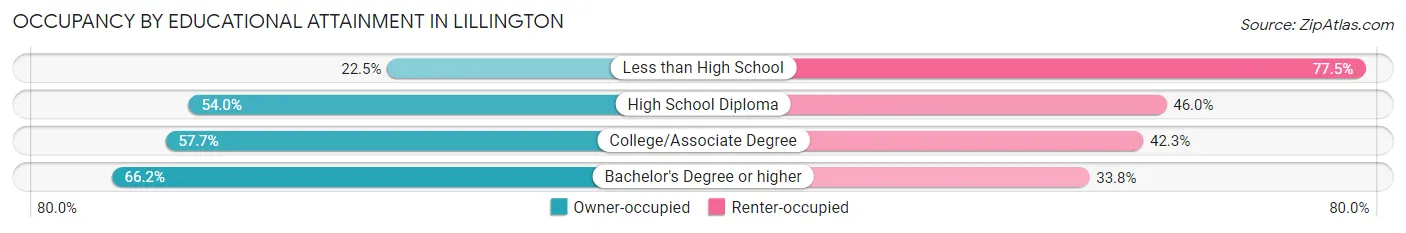
| Household Size | Owner-occupied | Renter-occupied |
| Less than High School | 20 (22.5%) | 69 (77.5%) |
| High School Diploma | 203 (54.0%) | 173 (46.0%) |
| College/Associate Degree | 252 (57.7%) | 185 (42.3%) |
| Bachelor's Degree or higher | 231 (66.2%) | 118 (33.8%) |
Occupancy by Age of Householder in Lillington
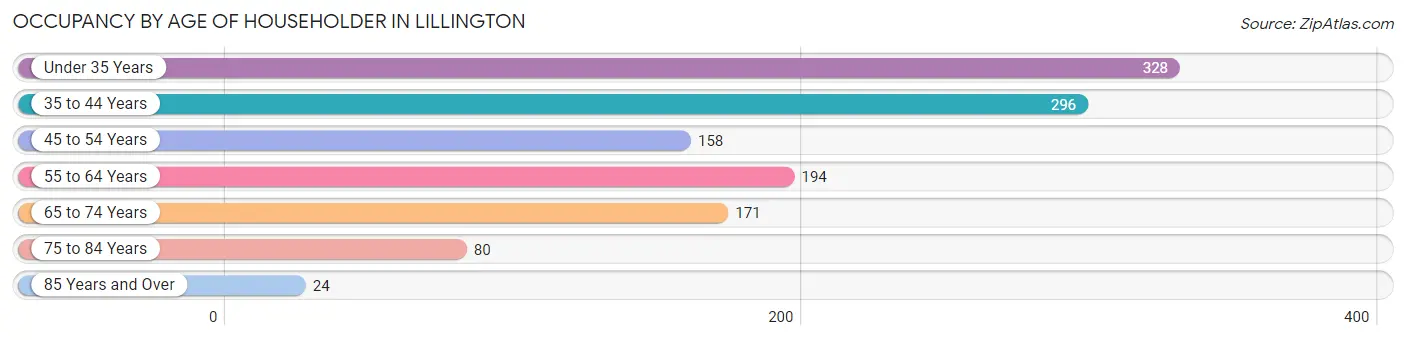
| Age Bracket | # Households | % Households |
| Under 35 Years | 328 | 26.2% |
| 35 to 44 Years | 296 | 23.7% |
| 45 to 54 Years | 158 | 12.6% |
| 55 to 64 Years | 194 | 15.5% |
| 65 to 74 Years | 171 | 13.7% |
| 75 to 84 Years | 80 | 6.4% |
| 85 Years and Over | 24 | 1.9% |
| Total | 1,251 | 100.0% |
Housing Finances in Lillington
Median Income by Occupancy in Lillington
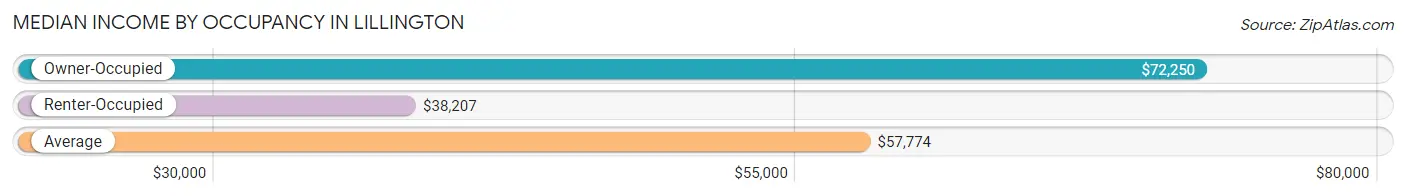
| Occupancy Type | # Households | Median Income |
| Owner-Occupied | 706 (56.4%) | $72,250 |
| Renter-Occupied | 545 (43.6%) | $38,207 |
| Average | 1,251 (100.0%) | $57,774 |
Occupancy by Householder Income Bracket in Lillington
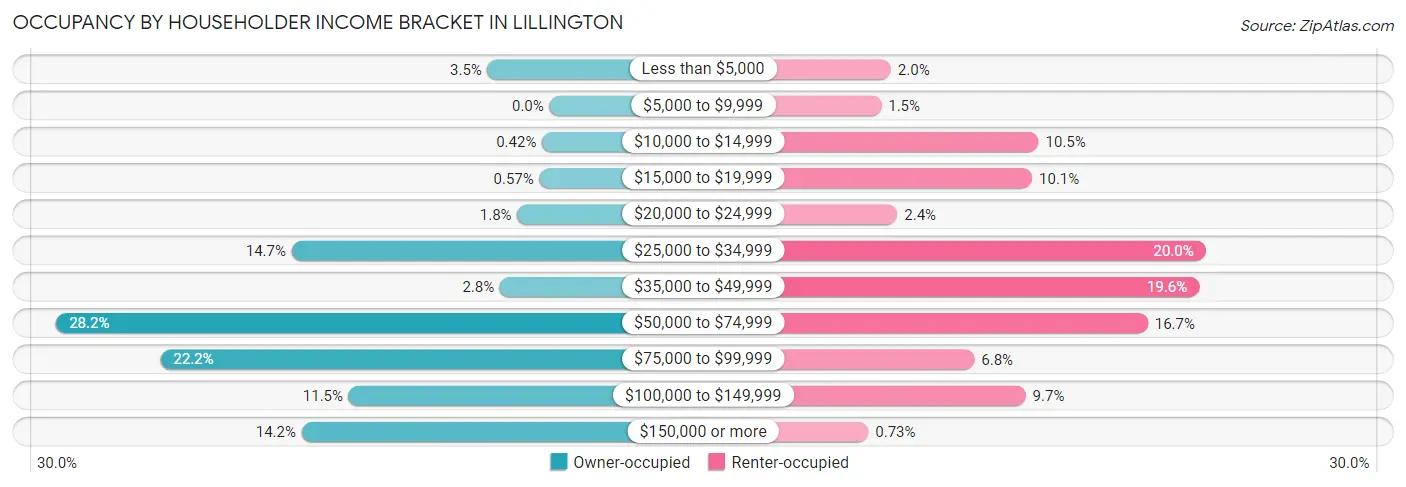
| Income Bracket | Owner-occupied | Renter-occupied |
| Less than $5,000 | 25 (3.5%) | 11 (2.0%) |
| $5,000 to $9,999 | 0 (0.0%) | 8 (1.5%) |
| $10,000 to $14,999 | 3 (0.4%) | 57 (10.5%) |
| $15,000 to $19,999 | 4 (0.6%) | 55 (10.1%) |
| $20,000 to $24,999 | 13 (1.8%) | 13 (2.4%) |
| $25,000 to $34,999 | 104 (14.7%) | 109 (20.0%) |
| $35,000 to $49,999 | 20 (2.8%) | 107 (19.6%) |
| $50,000 to $74,999 | 199 (28.2%) | 91 (16.7%) |
| $75,000 to $99,999 | 157 (22.2%) | 37 (6.8%) |
| $100,000 to $149,999 | 81 (11.5%) | 53 (9.7%) |
| $150,000 or more | 100 (14.2%) | 4 (0.7%) |
| Total | 706 (100.0%) | 545 (100.0%) |
Monthly Housing Cost Tiers in Lillington
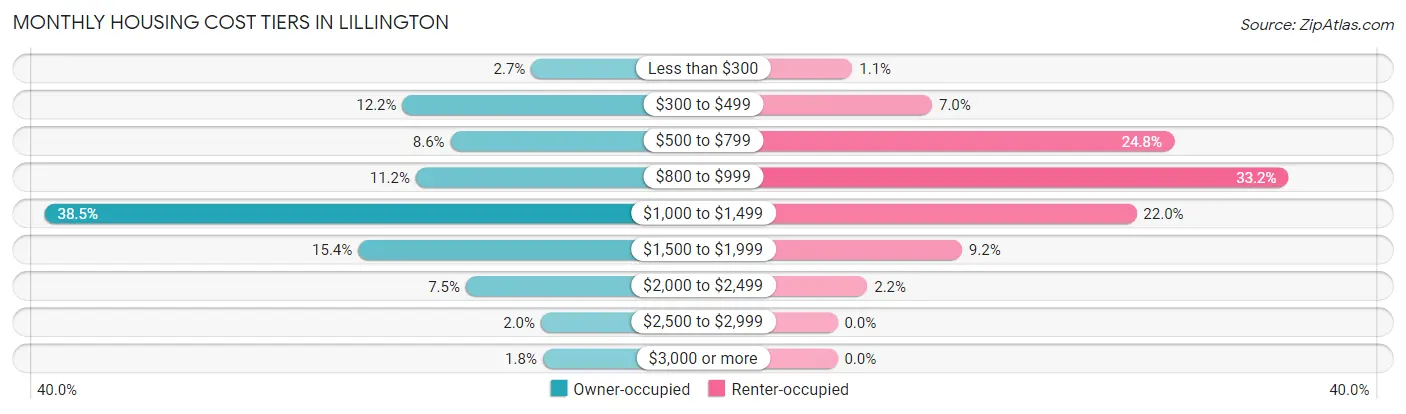
| Monthly Cost | Owner-occupied | Renter-occupied |
| Less than $300 | 19 (2.7%) | 6 (1.1%) |
| $300 to $499 | 86 (12.2%) | 38 (7.0%) |
| $500 to $799 | 61 (8.6%) | 135 (24.8%) |
| $800 to $999 | 79 (11.2%) | 181 (33.2%) |
| $1,000 to $1,499 | 272 (38.5%) | 120 (22.0%) |
| $1,500 to $1,999 | 109 (15.4%) | 50 (9.2%) |
| $2,000 to $2,499 | 53 (7.5%) | 12 (2.2%) |
| $2,500 to $2,999 | 14 (2.0%) | 0 (0.0%) |
| $3,000 or more | 13 (1.8%) | 0 (0.0%) |
| Total | 706 (100.0%) | 545 (100.0%) |
Physical Housing Characteristics in Lillington
Housing Structures in Lillington
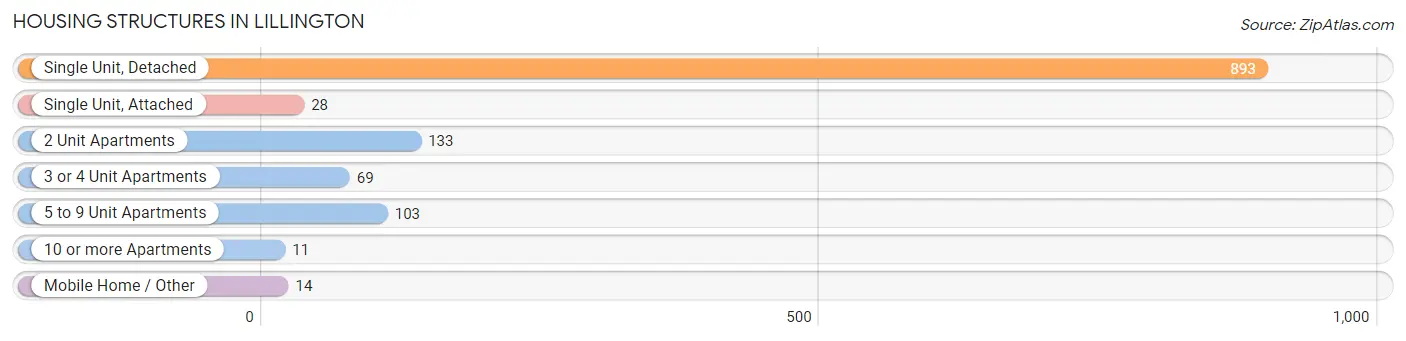
| Structure Type | # Housing Units | % Housing Units |
| Single Unit, Detached | 893 | 71.4% |
| Single Unit, Attached | 28 | 2.2% |
| 2 Unit Apartments | 133 | 10.6% |
| 3 or 4 Unit Apartments | 69 | 5.5% |
| 5 to 9 Unit Apartments | 103 | 8.2% |
| 10 or more Apartments | 11 | 0.9% |
| Mobile Home / Other | 14 | 1.1% |
| Total | 1,251 | 100.0% |
Housing Structures by Occupancy in Lillington
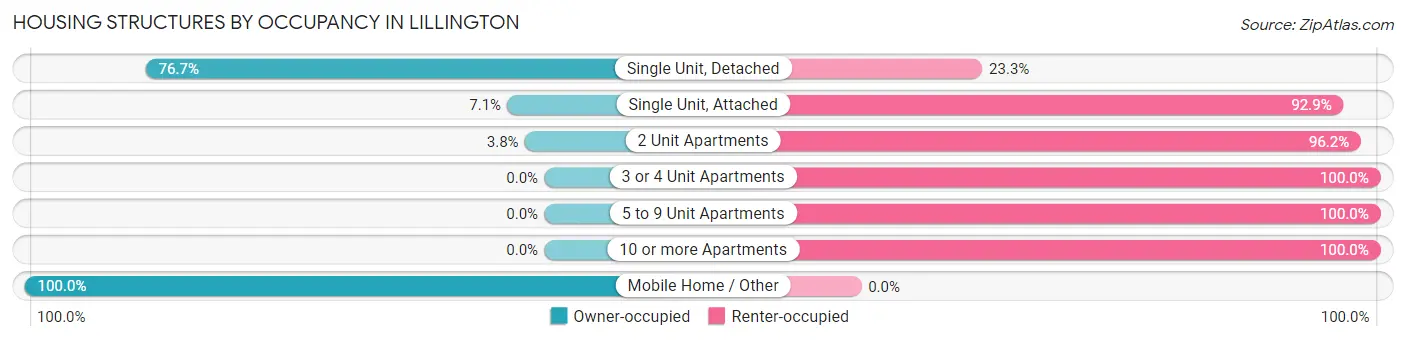
| Structure Type | Owner-occupied | Renter-occupied |
| Single Unit, Detached | 685 (76.7%) | 208 (23.3%) |
| Single Unit, Attached | 2 (7.1%) | 26 (92.9%) |
| 2 Unit Apartments | 5 (3.8%) | 128 (96.2%) |
| 3 or 4 Unit Apartments | 0 (0.0%) | 69 (100.0%) |
| 5 to 9 Unit Apartments | 0 (0.0%) | 103 (100.0%) |
| 10 or more Apartments | 0 (0.0%) | 11 (100.0%) |
| Mobile Home / Other | 14 (100.0%) | 0 (0.0%) |
| Total | 706 (56.4%) | 545 (43.6%) |
Housing Structures by Number of Rooms in Lillington
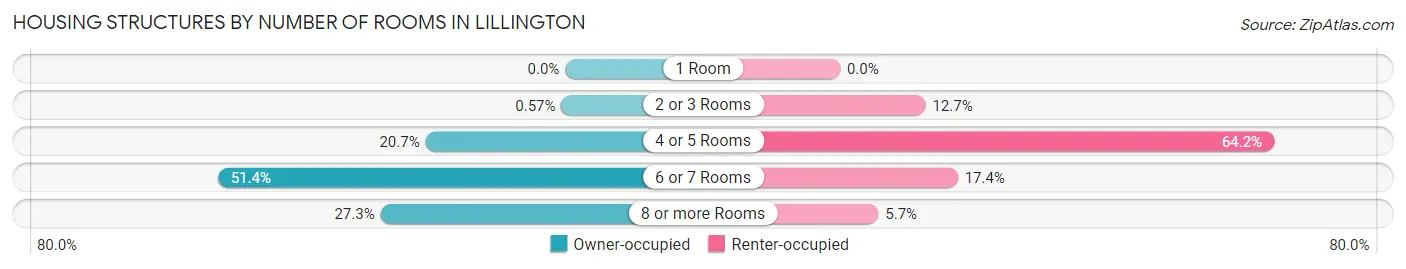
| Number of Rooms | Owner-occupied | Renter-occupied |
| 1 Room | 0 (0.0%) | 0 (0.0%) |
| 2 or 3 Rooms | 4 (0.6%) | 69 (12.7%) |
| 4 or 5 Rooms | 146 (20.7%) | 350 (64.2%) |
| 6 or 7 Rooms | 363 (51.4%) | 95 (17.4%) |
| 8 or more Rooms | 193 (27.3%) | 31 (5.7%) |
| Total | 706 (100.0%) | 545 (100.0%) |
Housing Structure by Heating Type in Lillington
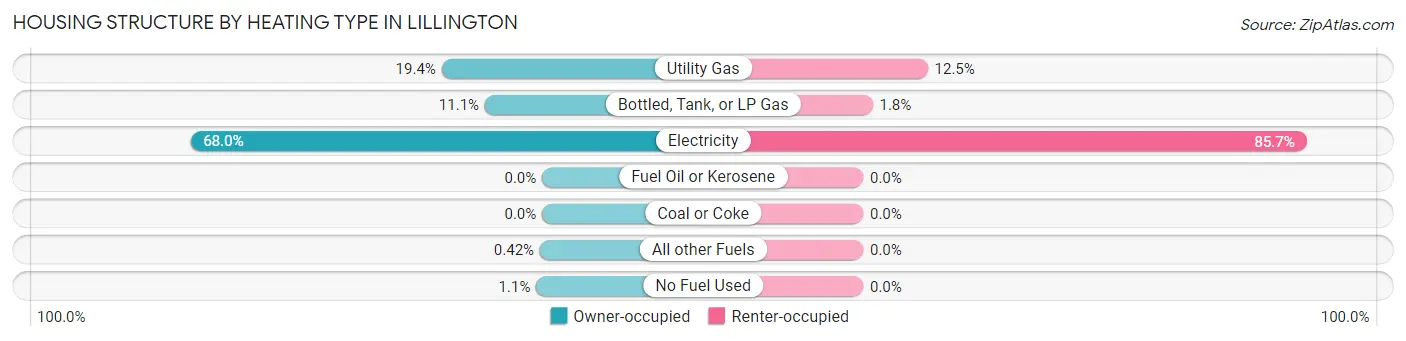
| Heating Type | Owner-occupied | Renter-occupied |
| Utility Gas | 137 (19.4%) | 68 (12.5%) |
| Bottled, Tank, or LP Gas | 78 (11.1%) | 10 (1.8%) |
| Electricity | 480 (68.0%) | 467 (85.7%) |
| Fuel Oil or Kerosene | 0 (0.0%) | 0 (0.0%) |
| Coal or Coke | 0 (0.0%) | 0 (0.0%) |
| All other Fuels | 3 (0.4%) | 0 (0.0%) |
| No Fuel Used | 8 (1.1%) | 0 (0.0%) |
| Total | 706 (100.0%) | 545 (100.0%) |
Household Vehicle Usage in Lillington
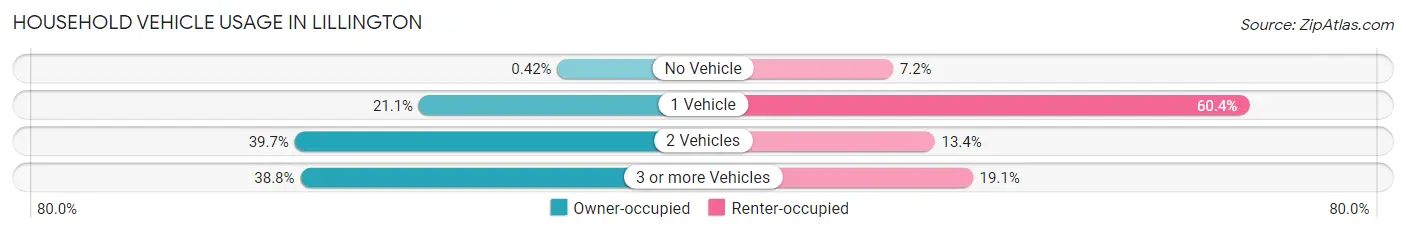
| Vehicles per Household | Owner-occupied | Renter-occupied |
| No Vehicle | 3 (0.4%) | 39 (7.2%) |
| 1 Vehicle | 149 (21.1%) | 329 (60.4%) |
| 2 Vehicles | 280 (39.7%) | 73 (13.4%) |
| 3 or more Vehicles | 274 (38.8%) | 104 (19.1%) |
| Total | 706 (100.0%) | 545 (100.0%) |
Real Estate & Mortgages in Lillington
Real Estate and Mortgage Overview in Lillington
| Characteristic | Without Mortgage | With Mortgage |
| Housing Units | 168 | 538 |
| Median Property Value | $167,900 | $211,100 |
| Median Household Income | $57,045 | $91 |
| Monthly Housing Costs | $467 | $13 |
| Real Estate Taxes | $1,432 | $0 |
Property Value by Mortgage Status in Lillington
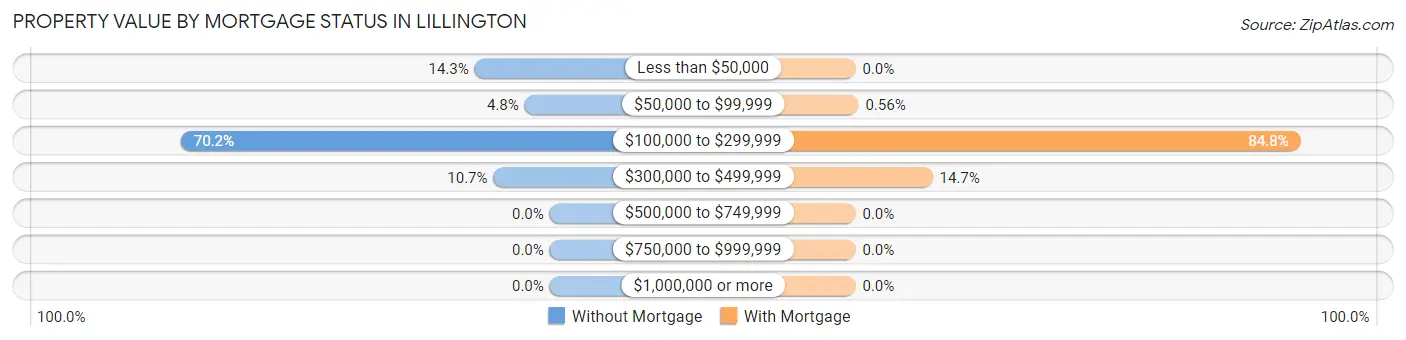
| Property Value | Without Mortgage | With Mortgage |
| Less than $50,000 | 24 (14.3%) | 0 (0.0%) |
| $50,000 to $99,999 | 8 (4.8%) | 3 (0.6%) |
| $100,000 to $299,999 | 118 (70.2%) | 456 (84.8%) |
| $300,000 to $499,999 | 18 (10.7%) | 79 (14.7%) |
| $500,000 to $749,999 | 0 (0.0%) | 0 (0.0%) |
| $750,000 to $999,999 | 0 (0.0%) | 0 (0.0%) |
| $1,000,000 or more | 0 (0.0%) | 0 (0.0%) |
| Total | 168 (100.0%) | 538 (100.0%) |
Household Income by Mortgage Status in Lillington
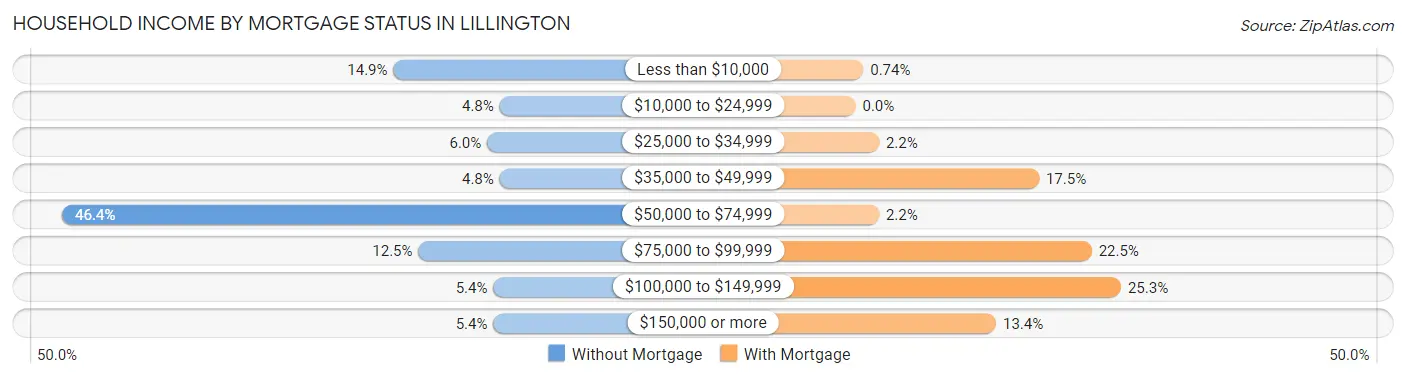
| Household Income | Without Mortgage | With Mortgage |
| Less than $10,000 | 25 (14.9%) | 4 (0.7%) |
| $10,000 to $24,999 | 8 (4.8%) | 0 (0.0%) |
| $25,000 to $34,999 | 10 (5.9%) | 12 (2.2%) |
| $35,000 to $49,999 | 8 (4.8%) | 94 (17.5%) |
| $50,000 to $74,999 | 78 (46.4%) | 12 (2.2%) |
| $75,000 to $99,999 | 21 (12.5%) | 121 (22.5%) |
| $100,000 to $149,999 | 9 (5.4%) | 136 (25.3%) |
| $150,000 or more | 9 (5.4%) | 72 (13.4%) |
| Total | 168 (100.0%) | 538 (100.0%) |
Property Value to Household Income Ratio in Lillington
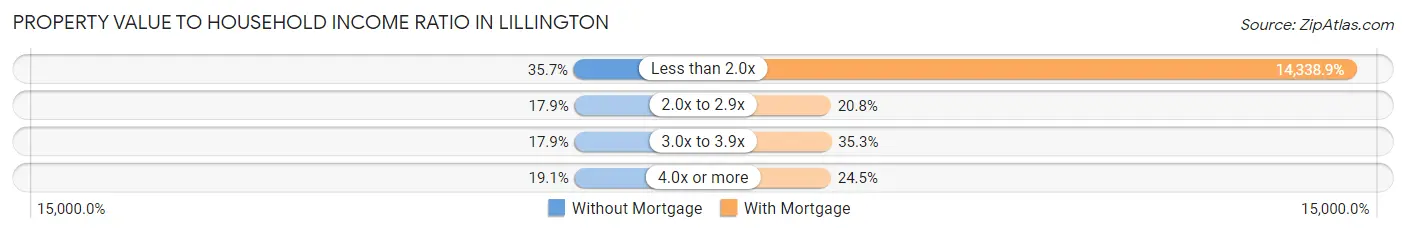
| Value-to-Income Ratio | Without Mortgage | With Mortgage |
| Less than 2.0x | 60 (35.7%) | 77,143 (14,338.8%) |
| 2.0x to 2.9x | 30 (17.9%) | 112 (20.8%) |
| 3.0x to 3.9x | 30 (17.9%) | 190 (35.3%) |
| 4.0x or more | 32 (19.1%) | 132 (24.5%) |
| Total | 168 (100.0%) | 538 (100.0%) |
Real Estate Taxes by Mortgage Status in Lillington
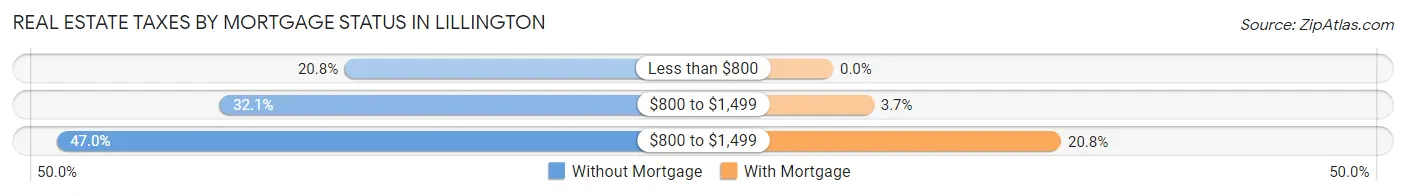
| Property Taxes | Without Mortgage | With Mortgage |
| Less than $800 | 35 (20.8%) | 0 (0.0%) |
| $800 to $1,499 | 54 (32.1%) | 20 (3.7%) |
| $800 to $1,499 | 79 (47.0%) | 112 (20.8%) |
| Total | 168 (100.0%) | 538 (100.0%) |
Health & Disability in Lillington
Health Insurance Coverage by Age in Lillington
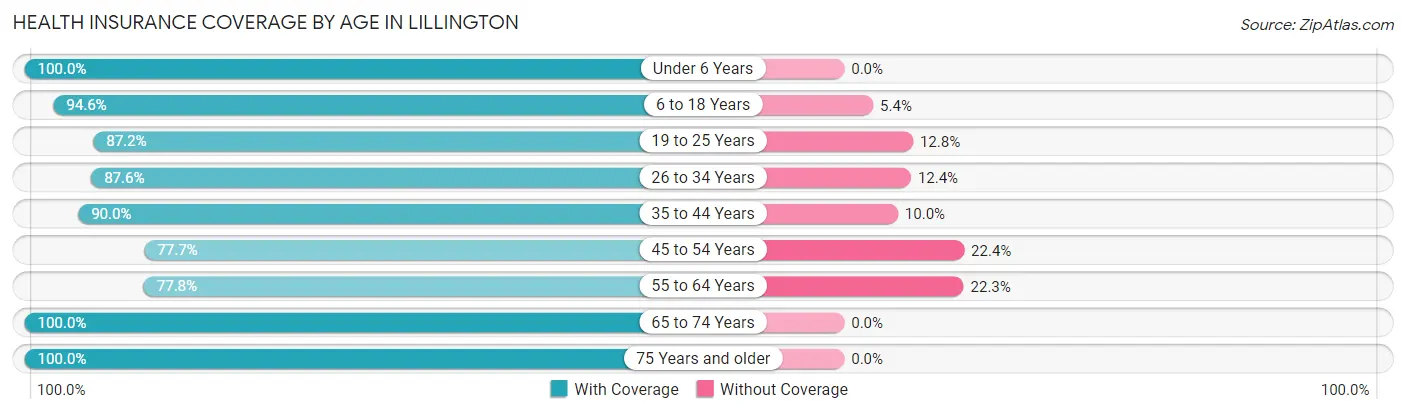
| Age Bracket | With Coverage | Without Coverage |
| Under 6 Years | 349 (100.0%) | 0 (0.0%) |
| 6 to 18 Years | 563 (94.6%) | 32 (5.4%) |
| 19 to 25 Years | 313 (87.2%) | 46 (12.8%) |
| 26 to 34 Years | 500 (87.6%) | 71 (12.4%) |
| 35 to 44 Years | 396 (90.0%) | 44 (10.0%) |
| 45 to 54 Years | 198 (77.6%) | 57 (22.4%) |
| 55 to 64 Years | 269 (77.7%) | 77 (22.3%) |
| 65 to 74 Years | 276 (100.0%) | 0 (0.0%) |
| 75 Years and older | 132 (100.0%) | 0 (0.0%) |
| Total | 2,996 (90.2%) | 327 (9.8%) |
Health Insurance Coverage by Citizenship Status in Lillington
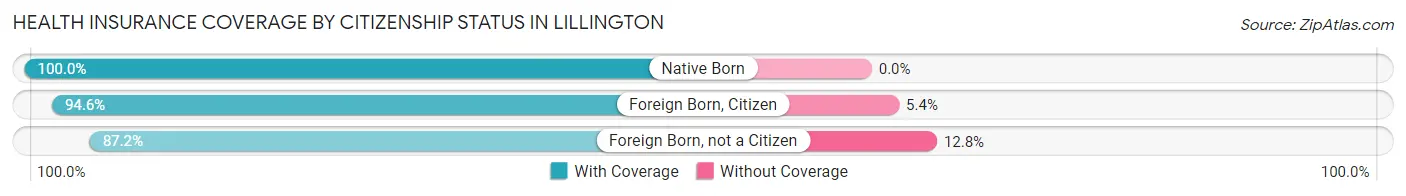
| Citizenship Status | With Coverage | Without Coverage |
| Native Born | 349 (100.0%) | 0 (0.0%) |
| Foreign Born, Citizen | 563 (94.6%) | 32 (5.4%) |
| Foreign Born, not a Citizen | 313 (87.2%) | 46 (12.8%) |
Health Insurance Coverage by Household Income in Lillington
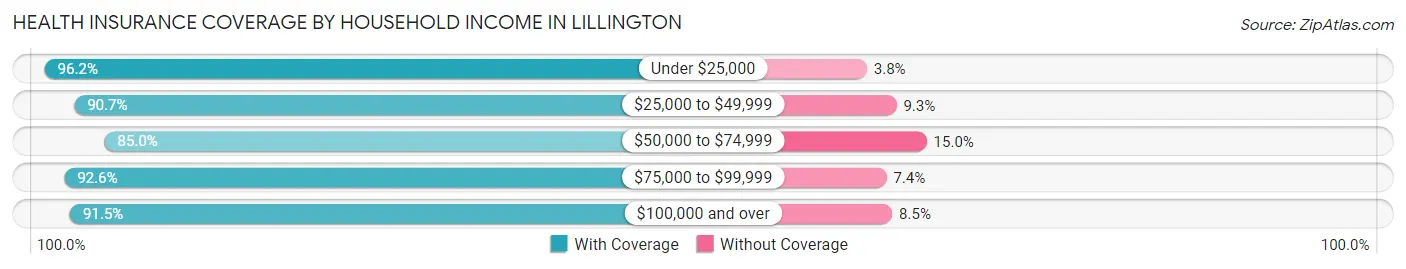
| Household Income | With Coverage | Without Coverage |
| Under $25,000 | 256 (96.2%) | 10 (3.8%) |
| $25,000 to $49,999 | 605 (90.7%) | 62 (9.3%) |
| $50,000 to $74,999 | 762 (85.0%) | 134 (15.0%) |
| $75,000 to $99,999 | 598 (92.6%) | 48 (7.4%) |
| $100,000 and over | 775 (91.5%) | 72 (8.5%) |
Public vs Private Health Insurance Coverage by Age in Lillington
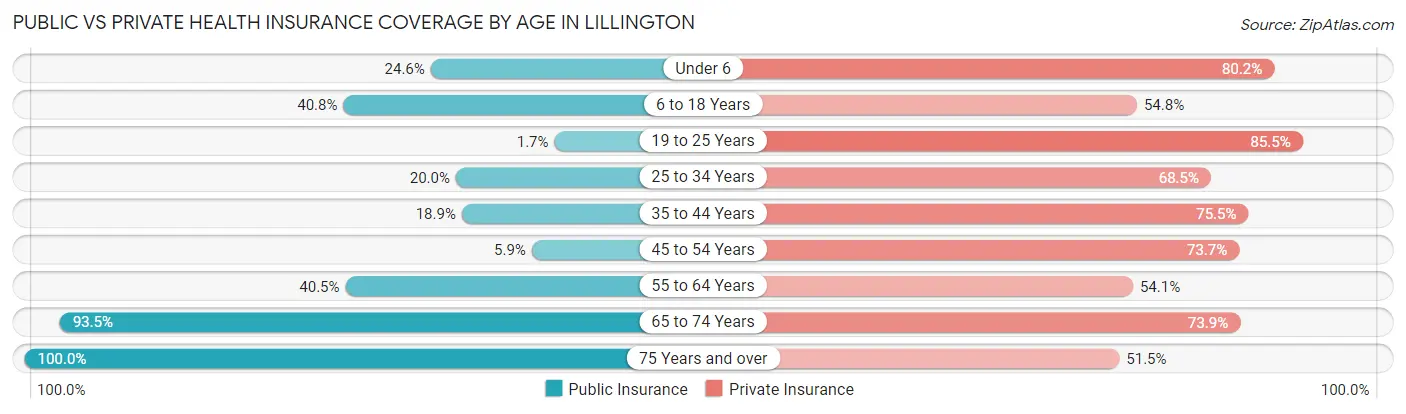
| Age Bracket | Public Insurance | Private Insurance |
| Under 6 | 86 (24.6%) | 280 (80.2%) |
| 6 to 18 Years | 243 (40.8%) | 326 (54.8%) |
| 19 to 25 Years | 6 (1.7%) | 307 (85.5%) |
| 25 to 34 Years | 114 (20.0%) | 391 (68.5%) |
| 35 to 44 Years | 83 (18.9%) | 332 (75.4%) |
| 45 to 54 Years | 15 (5.9%) | 188 (73.7%) |
| 55 to 64 Years | 140 (40.5%) | 187 (54.0%) |
| 65 to 74 Years | 258 (93.5%) | 204 (73.9%) |
| 75 Years and over | 132 (100.0%) | 68 (51.5%) |
| Total | 1,077 (32.4%) | 2,283 (68.7%) |
Disability Status by Sex by Age in Lillington
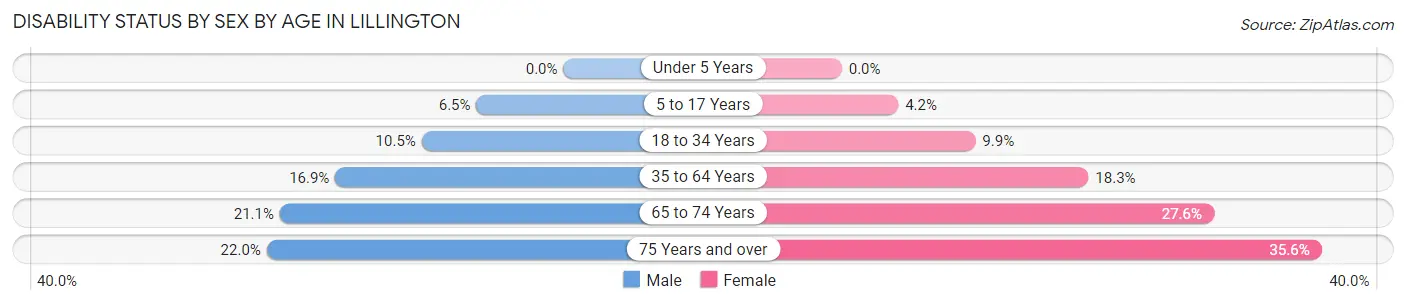
| Age Bracket | Male | Female |
| Under 5 Years | 0 (0.0%) | 0 (0.0%) |
| 5 to 17 Years | 19 (6.5%) | 13 (4.2%) |
| 18 to 34 Years | 55 (10.5%) | 49 (9.9%) |
| 35 to 64 Years | 82 (16.9%) | 102 (18.3%) |
| 65 to 74 Years | 20 (21.0%) | 50 (27.6%) |
| 75 Years and over | 13 (22.0%) | 26 (35.6%) |
Disability Class by Sex by Age in Lillington
Disability Class: Hearing Difficulty
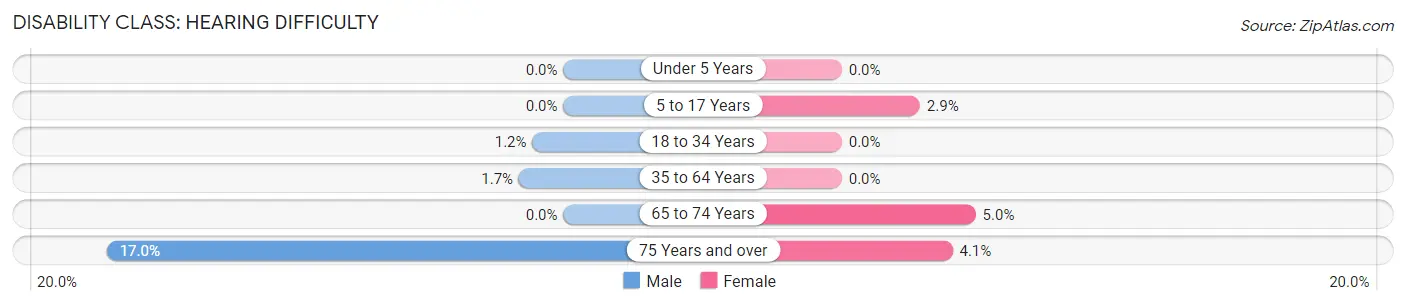
| Age Bracket | Male | Female |
| Under 5 Years | 0 (0.0%) | 0 (0.0%) |
| 5 to 17 Years | 0 (0.0%) | 9 (2.9%) |
| 18 to 34 Years | 6 (1.1%) | 0 (0.0%) |
| 35 to 64 Years | 8 (1.7%) | 0 (0.0%) |
| 65 to 74 Years | 0 (0.0%) | 9 (5.0%) |
| 75 Years and over | 10 (17.0%) | 3 (4.1%) |
Disability Class: Vision Difficulty
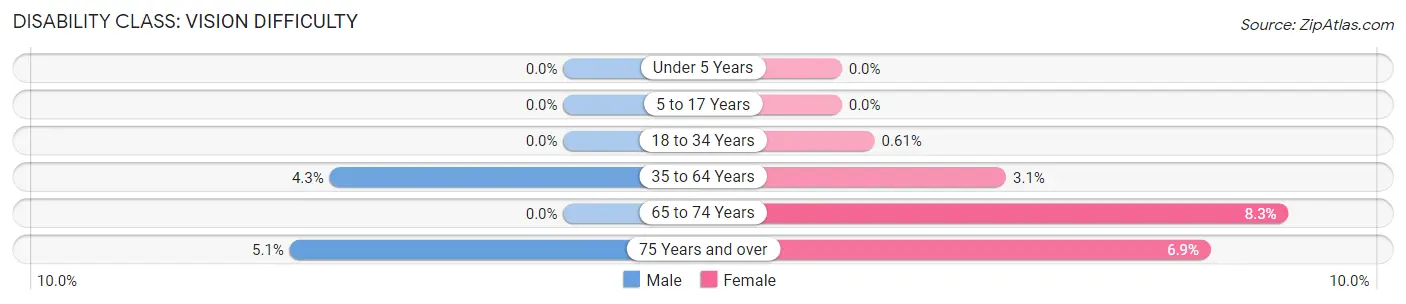
| Age Bracket | Male | Female |
| Under 5 Years | 0 (0.0%) | 0 (0.0%) |
| 5 to 17 Years | 0 (0.0%) | 0 (0.0%) |
| 18 to 34 Years | 0 (0.0%) | 3 (0.6%) |
| 35 to 64 Years | 21 (4.3%) | 17 (3.0%) |
| 65 to 74 Years | 0 (0.0%) | 15 (8.3%) |
| 75 Years and over | 3 (5.1%) | 5 (6.9%) |
Disability Class: Cognitive Difficulty
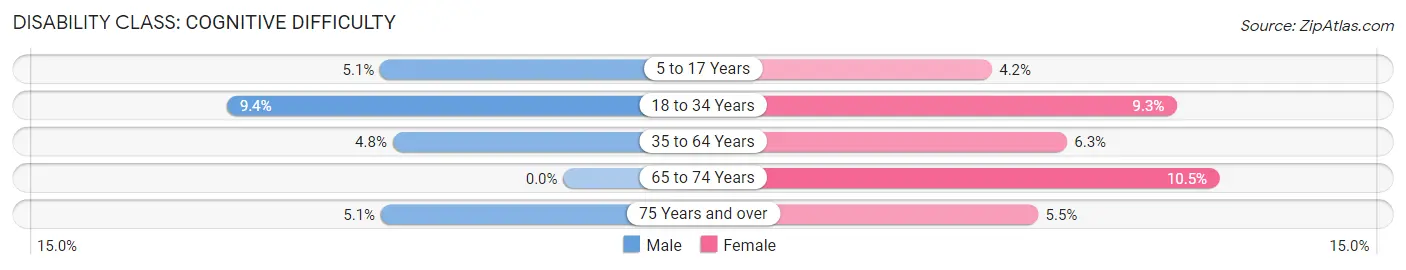
| Age Bracket | Male | Female |
| 5 to 17 Years | 15 (5.1%) | 13 (4.2%) |
| 18 to 34 Years | 49 (9.4%) | 46 (9.3%) |
| 35 to 64 Years | 23 (4.8%) | 35 (6.3%) |
| 65 to 74 Years | 0 (0.0%) | 19 (10.5%) |
| 75 Years and over | 3 (5.1%) | 4 (5.5%) |
Disability Class: Ambulatory Difficulty
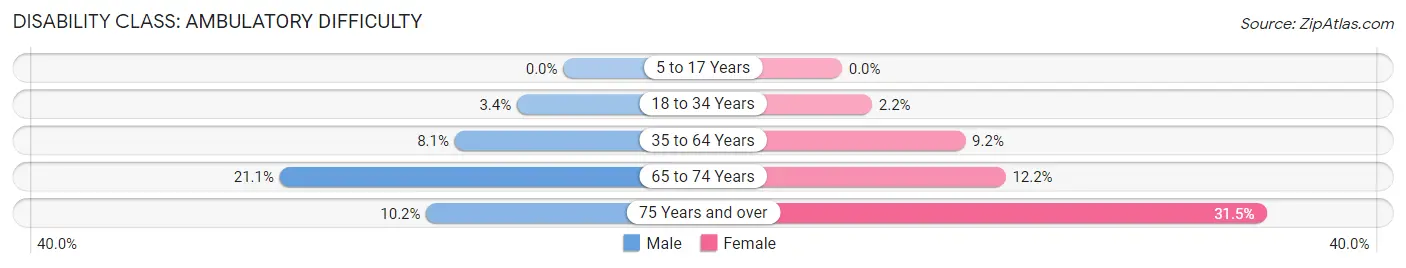
| Age Bracket | Male | Female |
| 5 to 17 Years | 0 (0.0%) | 0 (0.0%) |
| 18 to 34 Years | 18 (3.4%) | 11 (2.2%) |
| 35 to 64 Years | 39 (8.1%) | 51 (9.2%) |
| 65 to 74 Years | 20 (21.0%) | 22 (12.1%) |
| 75 Years and over | 6 (10.2%) | 23 (31.5%) |
Disability Class: Self-Care Difficulty
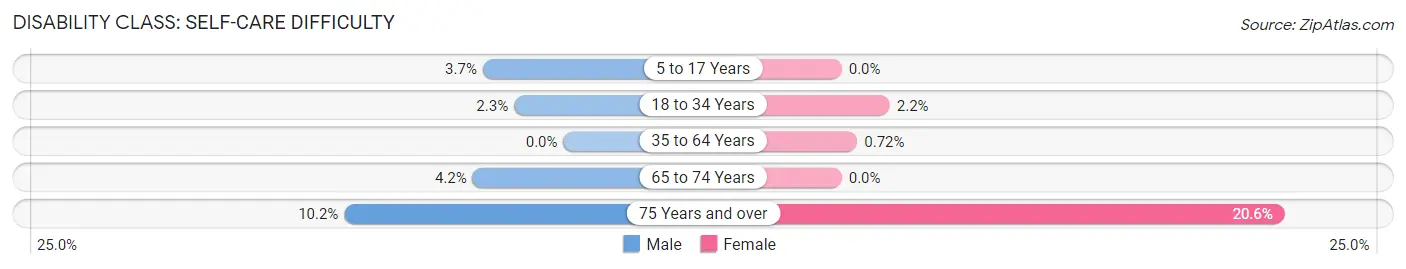
| Age Bracket | Male | Female |
| 5 to 17 Years | 11 (3.7%) | 0 (0.0%) |
| 18 to 34 Years | 12 (2.3%) | 11 (2.2%) |
| 35 to 64 Years | 0 (0.0%) | 4 (0.7%) |
| 65 to 74 Years | 4 (4.2%) | 0 (0.0%) |
| 75 Years and over | 6 (10.2%) | 15 (20.5%) |
Technology Access in Lillington
Computing Device Access in Lillington
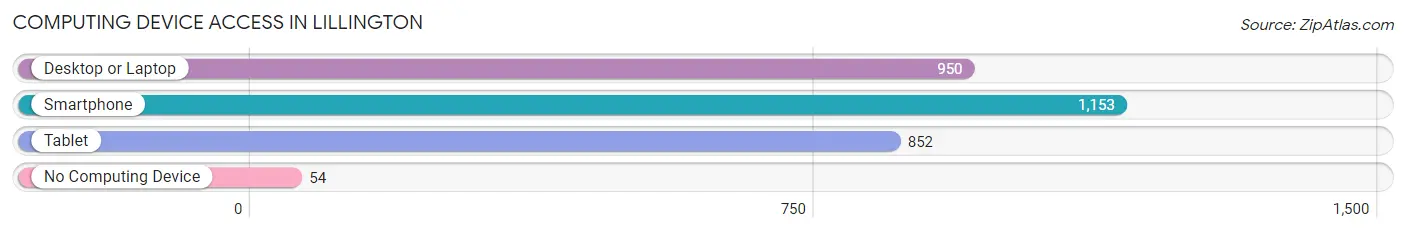
| Device Type | # Households | % Households |
| Desktop or Laptop | 950 | 75.9% |
| Smartphone | 1,153 | 92.2% |
| Tablet | 852 | 68.1% |
| No Computing Device | 54 | 4.3% |
| Total | 1,251 | 100.0% |
Internet Access in Lillington
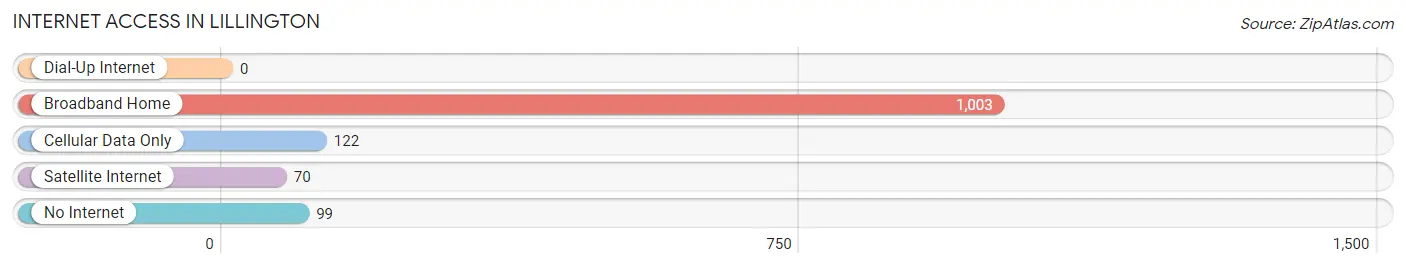
| Internet Type | # Households | % Households |
| Dial-Up Internet | 0 | 0.0% |
| Broadband Home | 1,003 | 80.2% |
| Cellular Data Only | 122 | 9.8% |
| Satellite Internet | 70 | 5.6% |
| No Internet | 99 | 7.9% |
| Total | 1,251 | 100.0% |
Lillington Summary
Lillington is a town located in Harnett County, North Carolina. It is situated in the heart of the Sandhills region of the state, and is the county seat of Harnett County. The town was founded in 1873 and has a population of approximately 4,500 people.
Geography
Lillington is located in the Sandhills region of North Carolina, which is characterized by rolling hills and sandy soils. The town is situated in the center of Harnett County, and is bordered by the towns of Angier, Coats, Erwin, and Dunn. The town is located approximately 30 miles south of Raleigh, the state capital, and is situated along the banks of the Cape Fear River.
The town is located at an elevation of approximately 200 feet above sea level, and the climate is generally mild and humid. The average annual temperature is around 70 degrees Fahrenheit, and the average annual precipitation is around 45 inches.
Economy
Lillington's economy is largely based on agriculture and manufacturing. The town is home to several large agricultural operations, including poultry farms, hog farms, and vegetable farms. The town is also home to several manufacturing companies, including a furniture factory, a plastics factory, and a paper mill.
The town is also home to several retail stores, restaurants, and other businesses. The town is served by several major highways, including Interstate 95, US Highway 421, and US Highway 401.
Demographics
As of the 2010 census, the population of Lillington was 4,500 people. The racial makeup of the town was 79.3% White, 15.2% African American, 0.3% Native American, 0.7% Asian, 0.1% Pacific Islander, and 4.4% from other races. Hispanic or Latino of any race were 3.2% of the population.
The median household income in Lillington was $37,917, and the median family income was $45,938. The per capita income for the town was $18,945. About 17.2% of families and 20.3% of the population were below the poverty line, including 28.2% of those under age 18 and 11.2% of those age 65 or over.
Education
Lillington is served by the Harnett County Schools system. The town is home to two public schools, Lillington-Shawtown Elementary School and Harnett Central High School. The town is also home to several private schools, including Lillington Christian Academy and Lillington Academy.
Conclusion
Lillington is a small town located in the Sandhills region of North Carolina. The town is home to a diverse population and a strong economy based on agriculture and manufacturing. The town is served by several major highways, and is home to several public and private schools. Lillington is a great place to live, work, and raise a family.
Common Questions
What is Per Capita Income in Lillington?
Per Capita income in Lillington is $21,194.
What is the Median Family Income in Lillington?
Median Family Income in Lillington is $65,625.
What is the Median Household income in Lillington?
Median Household Income in Lillington is $57,774.
What is Income or Wage Gap in Lillington?
Income or Wage Gap in Lillington is 7.9%.
Women in Lillington earn 92.1 cents for every dollar earned by a man.
What is Inequality or Gini Index in Lillington?
Inequality or Gini Index in Lillington is 0.38.
What is the Total Population of Lillington?
Total Population of Lillington is 4,566.
What is the Total Male Population of Lillington?
Total Male Population of Lillington is 2,643.
What is the Total Female Population of Lillington?
Total Female Population of Lillington is 1,923.
What is the Ratio of Males per 100 Females in Lillington?
There are 137.44 Males per 100 Females in Lillington.
What is the Ratio of Females per 100 Males in Lillington?
There are 72.76 Females per 100 Males in Lillington.
What is the Median Population Age in Lillington?
Median Population Age in Lillington is 37.3 Years.
What is the Average Family Size in Lillington
Average Family Size in Lillington is 3.4 People.
What is the Average Household Size in Lillington
Average Household Size in Lillington is 2.7 People.
How Large is the Labor Force in Lillington?
There are 1,751 People in the Labor Forcein in Lillington.
What is the Percentage of People in the Labor Force in Lillington?
46.7% of People are in the Labor Force in Lillington.
What is the Unemployment Rate in Lillington?
Unemployment Rate in Lillington is 0.8%.